Abstract
Background: The prevalence of transthyretin amyloid cardiomyopathy (ATTR-CM) in atrial fibrillation (AF) patients remains unclear. We explored the efficacy of computed tomography-based myocardial extracellular volume (CT-ECV) combined with red flags for the early screening of concealed ATTR-CM in AF patients undergoing catheter ablation.
Methods and Results: Patients referred for AF ablation at Oita University Hospital were prescreened using the red-flag signs defined by echocardiographic or electrocardiographic findings, medical history, symptoms, and blood biochemical findings. Myocardial CT-ECV was quantified in red flag-positive patients using routine pre-AF ablation planning cardiac CT with the addition of delayed-phase cardiac CT scans. Patients with high (>35%) ECV were evaluated using technetium pyrophosphate (99 mTc-PYP) scintigraphy. A cardiac biopsy was performed during the planned AF ablation procedure if 99 mTc-PYP scintigraphy was positive. Between June 2022 and June 2023, 342 patients were referred for AF ablation. Sixty-seven (19.6%) patients had at least one of the red-flag signs. Myocardial CT-ECV was evaluated in 57 patients because of contraindications to contrast media, revealing that 16 patients had high CT-ECV. Of these, 6 patients showed a positive 99 mTc-PYP study, and 6 patients were subsequently diagnosed with wild-type ATTR-CM via cardiac biopsy and genetic testing.
Conclusions: CT-ECV combined with red flags could contribute to the systematic early screening of concealed ATTR-CM in AF patients undergoing catheter ablation.
Transthyretin amyloid cardiomyopathy (ATTR-CM) is a disease with a poor prognosis in which amyloid protein is deposited in the myocardial tissue, resulting in thickening of the myocardial wall, diastolic dysfunction, and progression to heart failure.1 ATTR-CM is an underdiagnosed disease, but the number of patients diagnosed with ATTR-CM is notably increasing. Atrial fibrillation (AF) is one of the common arrhythmias observed in patients with ATTR-CM. According to the Japanese Circulation Society (JCS) 2020 Guideline on Diagnosis and Treatment of Cardiac Amyloidosis,2 AF is present in 27–67% of patients with ATTR-CM, which is consistent with a recent report from the UK National Amyloidosis Centre.3
Conversely, the prevalence of ATTR-CM in patients with AF remains unclear. Recently, Prasad et al reported that only 1 patient out of 801 patients with AF was diagnosed with ATTR-CM via screening.4 However, the eligibility criteria for technetium-99 m pyrophosphate (99 mTc-PYP) scintigraphy in that study were just 2 findings, namely age ≥60 years and left ventricular (LV) wall thickness >12 mm,4 which seem to be insufficient for effective screening.
Magnetic resonance imaging (MRI)-derived myocardial extracellular volume (ECV) is an important tool in diagnosing ATTR-CM.5 Recently, it has been reported that the diagnostic accuracy of computed tomography (CT)-based myocardial ECV is comparable to that of MRI-ECV6 and that CT-ECV could be a promising alternative diagnostic tool for ATTR-CM, particularly in cases where MRI is contraindicated.7
Therefore, we prospectively explored the prevalence of ATTR-CM in patients referred for AF ablation using a self-modified version of the previously reported red-flag symptoms and signs8 and our sequential diagnostic algorithm, including CT-ECV, 99 mTc-PYP scintigraphy, myocardial biopsy, and genetic testing. Here, we report the efficacy of CT-ECV evaluation using pre-ablation cardiac contrast CT images for early screening of concealed ATTR-CM in patients with AF undergoing catheter ablation.
Methods
This was a prospective study conducted at Oita University Hospital between June 2022 and June 2023. The study conformed to the principles outlined in the Declaration of Helsinki and was approved by the Review Board and Ethics Committee of Oita University (Approval no. 2539). Written informed consent was obtained from all patients who underwent cardiac screening.
Patient Selection
This study enrolled consecutive 342 patients referred and admitted to Oita University Hospital for AF ablation between June 2022 and June 2023. Patients eligible for CT-ECV evaluation were initially screened for red-flag symptoms and signs of cardiac amyloidosis, and those who had at least 1 symptom or sign were additionally evaluated for CT-ECV using pre-ablation planning CT. The red-flag symptoms and signs were as follows: (1) symptoms of heart failure; (2) electrocardiogram (ECG) finding presenting low voltage or pseudo-infarction; (3) increased serum troponin T concentrations >0.015 ng/mL; (4) increased plasma N-terminal pro B-type natriuretic peptide (NT-proBNP) concentrations ≥400 pg/mL for paroxysmal AF and ≥1,000 pg/mL for persistent AF; (5) echocardiographic findings of LV wall thickness >12 mm; and (6) a history of carpal tunnel syndrome or spinal canal stenosis. To exclude amyloid light chain amyloidosis, the monoclonal protein detection test or hematological consultation were performed in patients eligible for CT-ECV evaluation. Patients with a CT-ECV value of ≥35% were considered to have tested positive7 and subsequently underwent 99 mTc-PYP scintigraphy. Positive findings on 99 mTc-PYP scintigraphy were defined as a visual score of 2 or 3 and an increased heart-to-contralateral (H/CL) ratio >1.5 in the early phase and >1.3 in the delayed phase. Patients with positive findings on 99 mTc-PYP scintigraphy underwent endomyocardial biopsy of the right ventricle simultaneously with catheter ablation for AF. When endomyocardial biopsy led to a diagnosis of ATTR-CM, genetic testing was performed to identify the genetic variants of transthyretin (TTR). Final pathological and genetic diagnoses were made according to the opinions of clinicians at the Kumamoto University Amyloidosis Center.
Echocardiography
We performed M-mode, 2-dimensional, and Doppler echocardiographic measurements using a 1.5- to 4.0-MHz transducer at a fitting depth on the apical and parasternal views. Echocardiographic parameters, including LV wall thickness, were measured.
Cardiac CT Image Acquisition
All patients were scanned using a 320-section multidetector CT (MDCT) scanner (Aquilion ONE First Genesis [TSX-305A/1W]; CANON Medical Systems, Tochigi, Japan). First, preoperative CT for myocardial ablation was performed with a 12-s intravenous infusion of 24 mgI/kg/s iopamidol (Iopamidol 370; Fuji Pharma Co., Ltd., Tokyo, Japan) and a 30-mL saline flush as Phase 1. After 15 s, a 15-s intravenous infusion of 20 mgI/kg/s iopamidol and a 50-mL saline flush were administered as Phase 2, for a total of 600 mg/kg iopamidol. After 7 min, late iodine enhancement (LIE) CT was performed using continuous electrocardiography-triggered axial scans. The parameters for LIE CT were as follows: detector collimation, 320×0.5 mm; tube rotation time, 275 ms; tube voltage, 120 kVp; mean (±SD) tube current, 328.6±50.2 mA (range 170–450 mA); and mean (±SD) volume CT dose index, 146.9±42.7 mGy (range 92–201 mGy).
CT-ECV Calculation
Axial source LIE 120-kVp CT images were reconstructed with section thicknesses and intervals of 0.5 mm using a deep learning reconstruction algorithm (Advanced Intelligent Clear-IQ Engine [AiCE]; CANON Medical Systems, Tochigi, Japan) at AiCE-level Body Sharp Strong. To create a myocardial CT-derived ECV map, iodine density images were analyzed using a post-processing workstation (Ziostation 2; Ziosoft, Tokyo, Japan). The iodine density-derived CT-ECV (%) was calculated as follows:
CT-ECV = (1−Hct) × (iodine density in the myocardium) / (iodine density in the LV) × 100
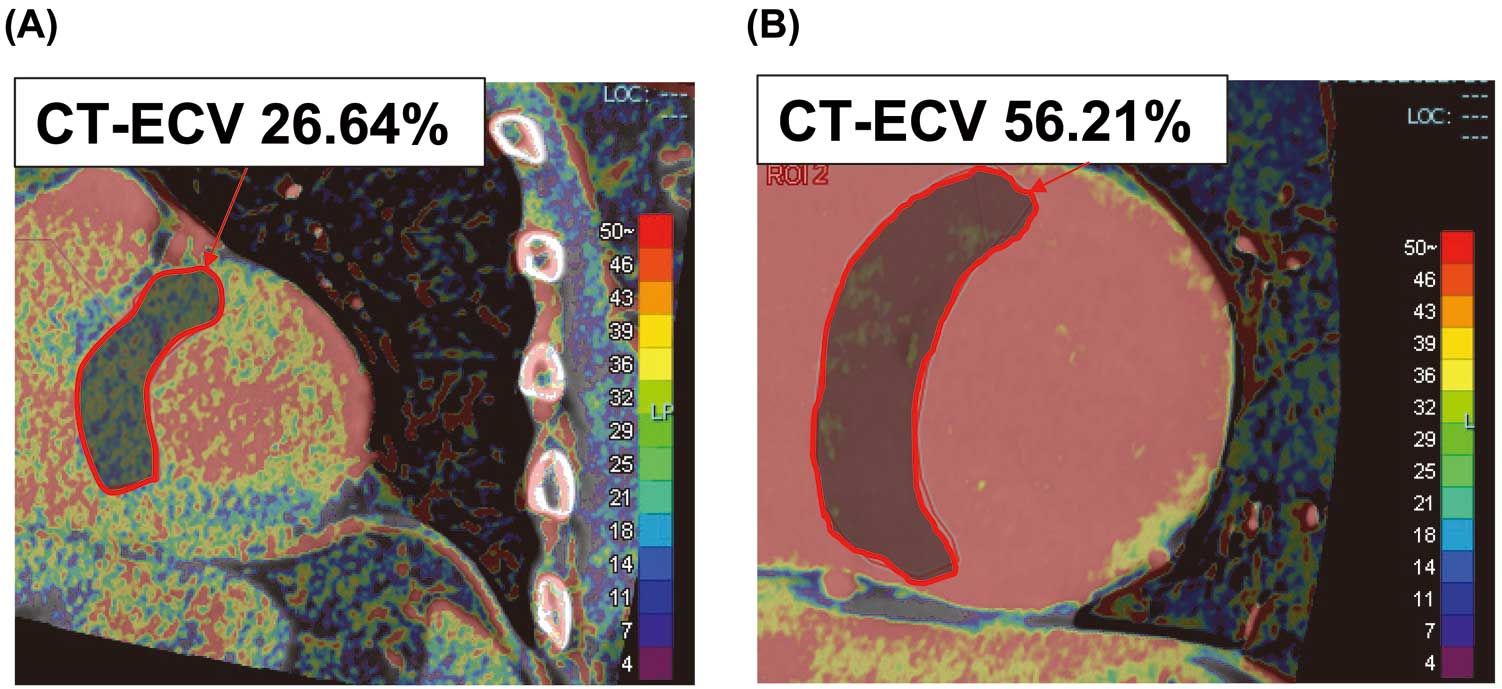
where Hct is hematocrit. Experienced board-certified cardiologists measured CT-ECV in the ventricular septum. Figure 1 shows representative images of CT-ECV-negative (Figure 1A) and -positive (Figure 1B) cases. The region of interest of the ventricular septum was outlined manually as extensively as possible to ensure that all relevant points were traced and to minimize the influence of in-plane partial volume due to blood and epicardial fat.9
99 mTc-PYP Scintigraphy
99 mTc-PYP scintigraphy was performed as described previously.10 Briefly, patients were scanned using SIEMENS Healthcare K.K. single-photon emission CT (SPECT; Symbia-Evo Excel) following intravenous injection of 740 MBq 99 mTc-PYP. Patients underwent a standardized imaging protocol via 99 mTc-PYP imaging at 1 and 3 h after injection to assess blood pool washout. The scans were evaluated by experienced board-certified nuclear radiologists and cardiologists. Myocardial 99 mTc-PYP uptake was assessed on a visual grading scale from 0 to 3 using anterior and lateral planar images as follows: Grade 0, no myocardial uptake; Grade 1, myocardial uptake smaller than that in the ribs; Grade 2, myocardial uptake equal to that in the ribs; and Grade 3, myocardial uptake greater than that in the ribs. The test was considered positive if there was moderate-to-severe 99 mTc-PYP uptake (Grade 2–3) in both ventricles. To rule out false positives, SPECT was performed in addition to the scanning protocol with planar imaging.
Endomyocardial Biopsy
An endomyocardial biopsy was performed at the completion of AF ablation via the internal jugular vein. At least 3 myocardial samples were obtained from the right ventricular septum using a Jawz endomyocardial bioptome (Argon Medical, Frisco, TX, USA).
Statistical Analysis
Normally distributed continuous variables are presented as the mean±SD, whereas non-normally distributed continuous variables are presented as the median with interquartile range (IQR). The normality of distribution was tested using the Shapiro-Wilk test. The significance of differences between groups was examined using Student’s t-test or the Mann-Whitney U test for unpaired data. Categorical values are presented as numbers and percentages, and were compared using the χ2
test or Fisher’s exact test. Correlations among variables were evaluated using Spearman’s rank correlation. Statistical significance was set at two-tailed P value <0.05. All statistical analyses were performed using EZR for R software.11 More precisely, EZR is a modified version of the R commander designed to add statistical functions frequently used in biostatistics.
Results
Screening Flowchart of CT-ECV Evaluation in Patients Referred for AF Ablation
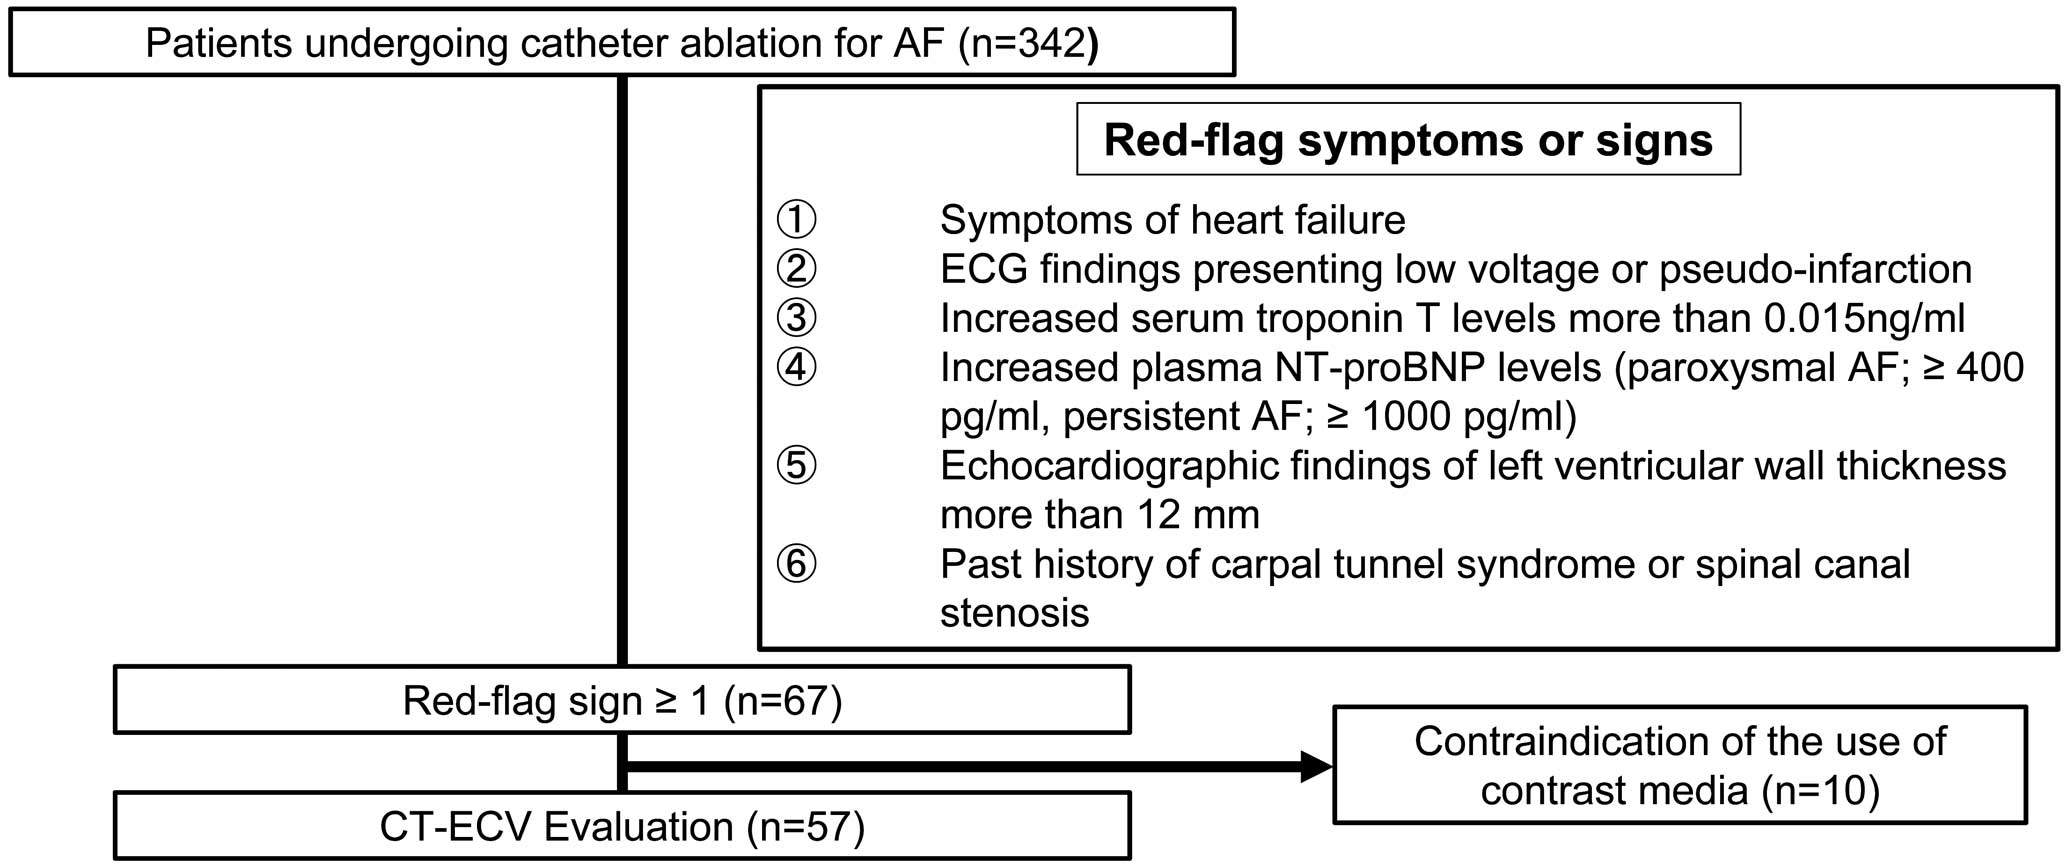
Figure 2 shows a screening flowchart for the selection of patients eligible for myocardial CT-ECV evaluation. This study enrolled a total of 342 patients who underwent catheter ablation for AF. Of these patients, 67 (19.6%) had at least one of the red-flag symptoms or signs. Ten patients were excluded because of contraindications to the use of contrast media, such as poorly controlled allergy, unstable asthma, and moderate or severe chronic kidney disease (estimated glomerular filtration rate <45 mL/min/1.73 m2). 99 mTc-PYP scintigraphy was performed, and the results were considered negative for these 10 patients. Finally, CT-ECV was evaluated in 57 (16.7%) patients. A monoclonal protein detection test or hematological consultation was performed in these 57 patients to exclude amyloid light chain amyloidosis.
Sequential ATTR-CM Diagnostic Algorithm
Figure 3 shows the sequential ATTR-CM diagnostic algorithm used in this study. The demographic characteristics of the 57 study participants evaluated for myocardial CT-ECV and CT-ECV-negative or -positive status are presented in Table 1. Of all the patients evaluated for myocardial CT-ECV, 16 (28%) had CT-ECV >35%. LV wall thickness was >12 mm in 34 (60%) patients, and this was the most frequently observed red-flag finding. Patients with a CT-ECV >35% (high CT-ECV patients) had a significantly higher number of red-flag findings (P<0.001). In addition, high CT-ECV patients had a significantly higher prevalence of troponin T-positive finding (81% vs. 41%; P=0.007), NT-proBNP-positive finding (75% vs. 44%; P=0.035), heart failure symptoms (50% vs. 17%; P=0.019), and LV wall thickness >12 mm (88% vs. 49%; P=0.007) than patients with a CT-ECV ≤35% (low CT-ECV patients). Consistent with these findings, significantly higher levels of troponin T (P<0.001) and NT-proBNP (P=0.006), and greater interventricular septum (IVS) thickness (P=0.008) and LV posterior wall thickness (P=0.002) were observed in high CT-ECV patients.
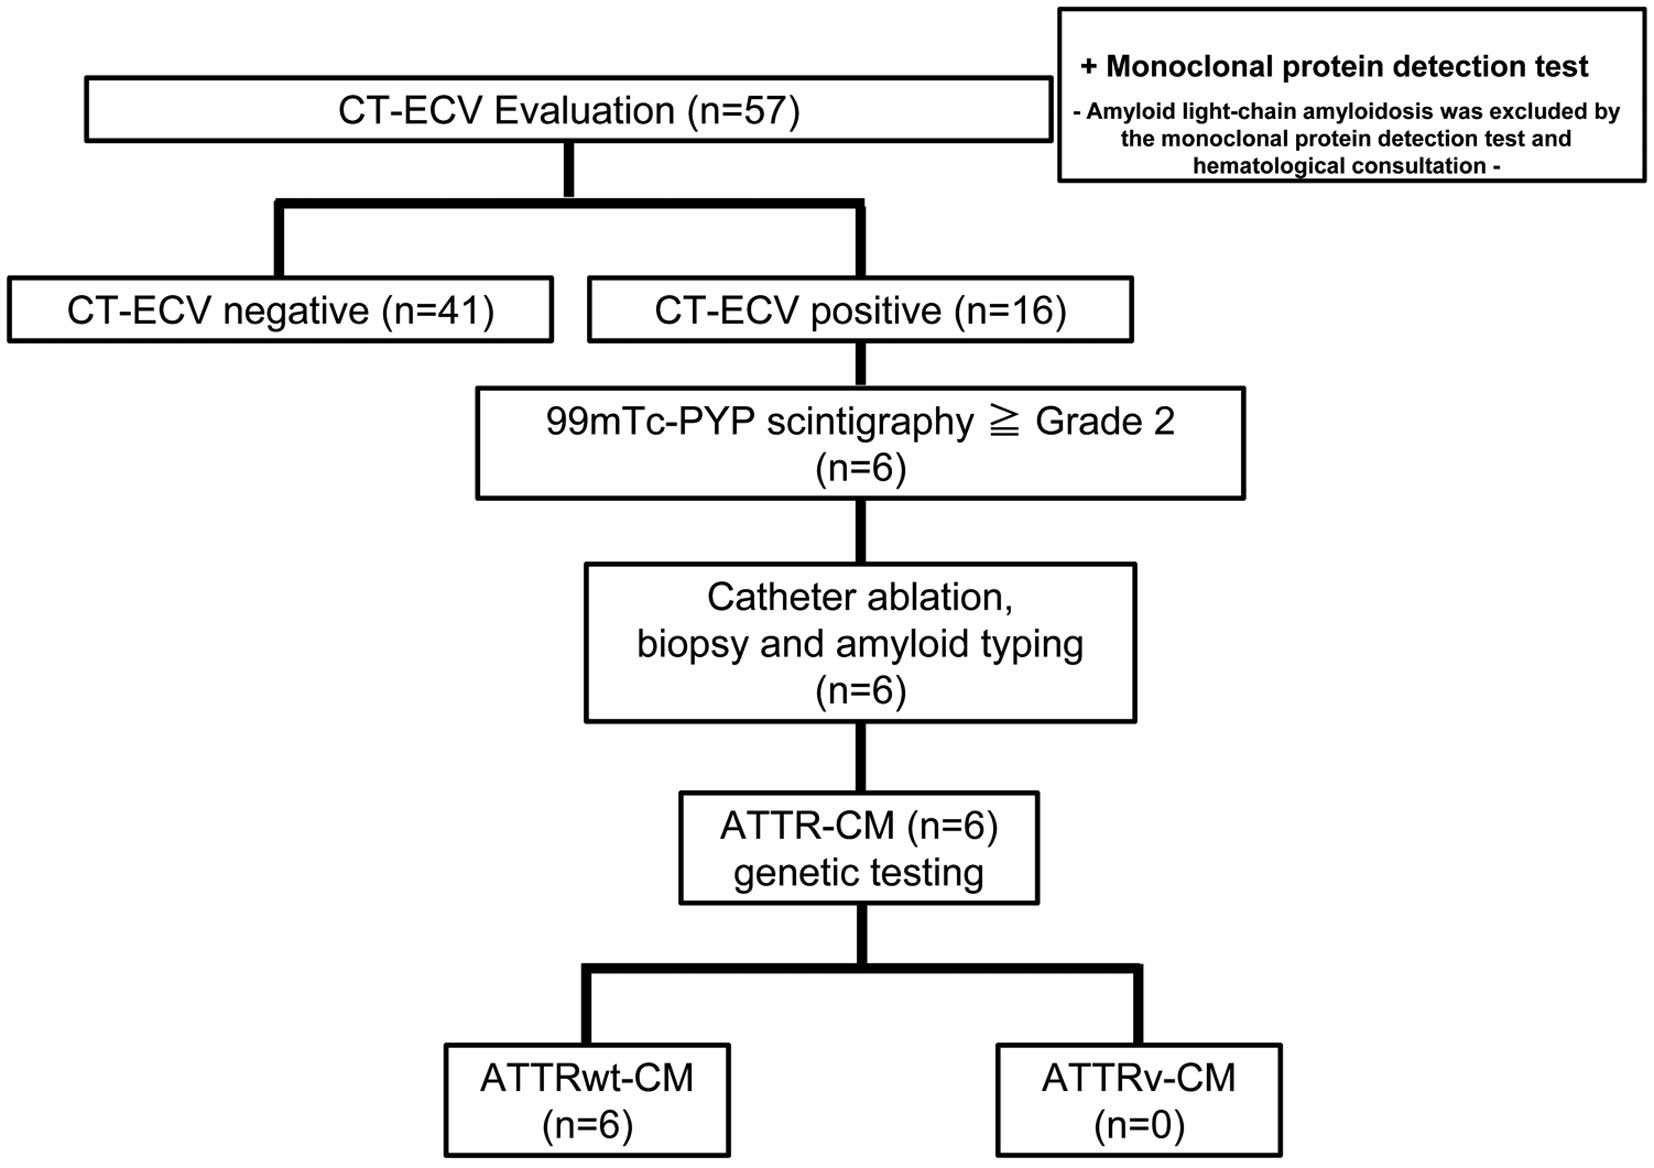
Table 1.
Demographic Characteristics of the Study Participants Evaluated for CT-ECV
| |
Overall
(n=57) |
CT-ECV negative
(≤35%; n=41) |
CT-ECV positive
(>35%; n=16) |
P value |
| CT-ECV (%) |
35.5±7.3 |
32.0±2.5 |
44.37±8.2 |
<0.001 |
| Age (years) |
72±8 |
72±9 |
72±5 |
0.908 |
| Male sex |
43 (75) |
29 (71) |
14 (88) |
0.306 |
| BMI (kg/m2) |
24.0±3.4 |
24.4±3.5 |
23.1±2.9 |
0.209 |
| No. red flags |
| 1 |
24 (42) |
22 (54) |
2 (13) |
|
| 2 |
10 (18) |
9 (22) |
1 (6.3) |
|
| 3 |
12 (21) |
7 (17) |
5 (31) |
|
| 4 |
5 (8.8) |
2 (4.9) |
3 (19) |
|
| 5 |
5 (8.8) |
1 (2.4) |
4 (25) |
|
| 6 |
1 (1.8) |
0 (0) |
1 (6.3) |
|
| Median no. red flags |
|
1.0 [1.0–2.0] |
3.5 [3.0–5.0] |
<0.001 |
| Troponin T positive |
30 (53) |
17 (41) |
13 (81) |
0.007 |
| NT-proBNP positive |
30 (53) |
18 (44) |
12 (75) |
0.035 |
| Positive ECG findings |
16 (28) |
9 (22) |
7 (44) |
0.115 |
| CTS or spinal canal stenosis |
6 (11) |
3 (7.3) |
3 (19) |
0.335 |
| HF symptoms |
15 (26) |
7 (17) |
8 (50) |
0.019 |
| LV wall thickness >12 mm |
34 (60) |
20 (49) |
14 (88) |
0.007 |
| NYHA functional class |
| I |
41 (72) |
34 (83) |
7 (44) |
|
| II |
15 (26) |
7 (17) |
8 (50) |
|
| III |
1 (1.8) |
0 (0) |
1 (6.3) |
|
| IV |
0 (0.0) |
0 (0.0) |
0 (0.0) |
|
| Persistent AF |
34 (60) |
24 (59) |
10 (63) |
0.786 |
| CHADS2 score |
| 0 |
7 (12) |
7 (17) |
0 (0) |
|
| 1 |
19 (33) |
15 (37) |
4 (25) |
|
| 2 |
18 (32) |
10 (24) |
8 (50) |
|
| 3 |
7 (12) |
5 (12) |
2 (13) |
|
| 4 |
4 (7.0) |
3 (7.3) |
1 (6.3) |
|
| 5 |
2 (3.5) |
1 (2.4) |
1 (6.3) |
|
| Troponin T (ng/mL) |
0.015 [0.008–0.025] |
0.011 [0.008–0.018] |
0.024 [0.018–0.043] |
<0.001 |
| NT-proBNP (pg/mL) |
694 [354–1,321] |
649 [231–1,105] |
1,270 [546–1,858] |
0.006 |
| BUN (mg/dL) |
18.5±4.3 |
18.6±4.6 |
18.4±3.8 |
0.880 |
| Cr (mg/dL) |
0.87±0.18 |
0.85±0.16 |
0.93±0.21 |
0.083 |
| eGFR (mL/min/1.73 m2) |
65±14 |
65±12 |
63±19 |
0.657 |
| HbA1c (%) |
6.12±0.71 |
6.14±0.75 |
6.09±0.60 |
0.817 |
| D-dimer (μg/mL) |
0.21 [0.16–0.35] |
0.19 [0.16–0.29] |
0.36 [0.15–0.60] |
0.052 |
| LVDd (mm) |
44.6±6.1 |
44.3±6.0 |
45.5±6.3 |
0.515 |
| LVDs (mm) |
29.9±6.0 |
29.1±5.6 |
32.2±6.5 |
0.083 |
| LVEF (%) |
62±10 |
63±9 |
59±14 |
0.130 |
| IVS thickness (mm) |
12.19±2.52 |
11.54±2.04 |
13.84±2.93 |
0.008 |
| LVPW thickness (mm) |
10.60±1.77 |
10.08±1.17 |
11.93±2.32 |
0.002 |
| LAD (mm) |
42.0±5.6 |
41.3±5.4 |
43.8±5.8 |
0.131 |
| E/e´ |
12.4±4.7 |
12.0±5.2 |
13.3±3.3 |
0.393 |
Unless indicated otherwise, data are presented as the median [interquartile range], mean±SD, or n (%). AF, atrial fibrillation; BMI, body mass index; BUN, blood urea nitrogen; Cr, creatinine; CT-ECV, computed tomography-based myocardial extracellular volume; CTS, carpal tunnel syndrome; ECG, electrocardiogram; eGFR, estimated glomerular filtration rate; HF, heart failure; IVS, interventricular septum; LV, left ventricle; LVDd, left ventricular diastolic diameter; LVDs, left ventricular systolic diameter; LVEF, left ventricular ejection fraction; LVPW, left ventricular posterior wall; NT-proBNP, N-terminal pro B-type natriuretic peptide; NYHA, New York Heart Association.
Next, 99 mTc-PYP scintigraphy was performed in 16 patients with high CT-ECV, revealing that 6 patients had a visual score of Grade 2 or 3 (Figure 3). These patients then underwent right ventricular myocardial biopsy at the time of catheter ablation for AF. All 6 patients were diagnosed with wild-type ATTR-CM (ATTRwt-CM) via pathological evaluation and genetic testing (Figure 3). The detailed characteristics of each of the 16 patients with high CT-ECV, including the 6 ATTRwt-CM patients, are presented in Table 2. Notably, serum troponin T concentrations in the 6 ATTRwt-CM patients were >0.030 ng/mL. All 6 patients received a prescription for tafamidis after applying for a medical expense subsidy. Overall, the probability of ATTR-CM in all the patients undergoing catheter ablation for AF was 1.8% (6/342). The positive predictive value of CT-ECV (cut-off value 35%) for the diagnosis of ATTR-CM in the present study was 37.5%.
Table 2.
Characteristics of CT-ECV-Positive Patients
Patient
no. |
ATTRwt-CM
diagnosis |
Age
(years) |
Sex |
NYHA
FC |
IVST
(mm) |
LVPW
(mm) |
LVEF
(%) |
CT-ECV
(%) |
H/CL
ratio |
Visual
score |
No. red
flags |
Troponin T
(ng/mL) |
NT-proBNP
(pg/mL) |
Past
historyA |
Pseudo
infarction |
Low
voltage |
HF
symptoms |
LVH |
AF
subtype |
| 1 |
+ |
70 |
M |
II |
15.1 |
15.0 |
65.1 |
56.2 |
1.74 |
3 |
6 |
0.084 |
2,043 |
1 |
1 |
1 |
1 |
1 |
PeAF |
| 2 |
+ |
71 |
M |
III |
11.1 |
15.1 |
50.4 |
55.3 |
1.78 |
3 |
5 |
0.068 |
2,886 |
0 |
1 |
0 |
1 |
1 |
PeAF |
| 3 |
+ |
73 |
M |
II |
11.8 |
10.8 |
64.1 |
36.0 |
1.45 |
2 |
5 |
0.031 |
2,018 |
1 |
1 |
0 |
1 |
0 |
PeAF |
| 4 |
+ |
76 |
M |
II |
17.0 |
16.3 |
40.4 |
61.4 |
2.27 |
3 |
4 |
0.071 |
2,033 |
0 |
0 |
0 |
1 |
1 |
PeAF |
| 5 |
+ |
79 |
M |
I |
20.1 |
15.1 |
61.3 |
45.5 |
1.70 |
3 |
5 |
0.037 |
1,183 |
1 |
1 |
1 |
0 |
1 |
PAF |
| 6 |
+ |
74 |
M |
II |
18.7 |
17.5 |
48.8 |
42.9 |
2.15 |
3 |
5 |
0.062 |
555 |
0 |
1 |
0 |
1 |
1 |
PAF |
| 7 |
− |
62 |
M |
II |
12.0 |
11.7 |
50.0 |
48.4 |
1.53 |
1 |
3 |
0.012 |
1,804 |
0 |
1 |
0 |
0 |
1 |
PeAF |
| 8 |
− |
74 |
M |
II |
12.0 |
11.3 |
45.3 |
42.2 |
1.35 |
1 |
4 |
0.015 |
724 |
0 |
0 |
1 |
1 |
1 |
PeAF |
| 9 |
− |
64 |
M |
II |
10.7 |
12.5 |
30.6 |
51.7 |
1.25 |
1 |
4 |
0.020 |
1,510 |
0 |
0 |
0 |
1 |
1 |
PeAF |
| 10 |
− |
66 |
M |
I |
14.1 |
10.2 |
67.0 |
36.8 |
1.33 |
1 |
3 |
0.021 |
1,321 |
0 |
0 |
0 |
0 |
1 |
PeAF |
| 11 |
− |
65 |
M |
I |
13.1 |
10.8 |
76.5 |
36.9 |
1.34 |
1 |
3 |
0.023 |
428 |
0 |
0 |
0 |
0 |
1 |
PAF |
| 12 |
− |
72 |
M |
I |
13.6 |
8.5 |
54.6 |
43.8 |
1.20 |
1 |
2 |
0.025 |
377 |
0 |
0 |
0 |
0 |
1 |
PAF |
| 13 |
− |
79 |
F |
I |
12.2 |
9.3 |
76.6 |
38.7 |
1.24 |
1 |
1 |
0.006 |
354 |
0 |
0 |
0 |
0 |
1 |
PAF |
| 14 |
− |
79 |
F |
I |
17.0 |
9.4 |
60.3 |
36.5 |
1.35 |
1 |
3 |
0.026 |
1,219 |
0 |
0 |
0 |
0 |
1 |
PAF |
| 15 |
− |
71 |
M |
II |
11.0 |
11.2 |
76.8 |
42.6 |
1.45 |
1 |
3 |
0.019 |
1,659 |
0 |
0 |
0 |
1 |
0 |
PeAF |
| 16 |
− |
74 |
M |
I |
12.7 |
11.8 |
70.3 |
35.0 |
1.40 |
1 |
1 |
0.011 |
517 |
0 |
0 |
0 |
0 |
1 |
PeAF |
APast history of carpal tunnel syndrome or spinal canal stenosis. ATTRwt-CM, wild-type transthyretin amyloid cardiomyopathy; F, female; H/CL, heart to contralateral ratio; LVH, left ventricular hypertrophy; M, male; PAF, paroxysmal atrial fibrillation; PeAF, persistent atrial fibrillation. Other abbreviations as in Table 1. 0 means negative and 1 means positive in Past history, Pseudo infarction, Low voltage, HF symptoms and LVH.
Efficacy of Combination Screening Using CT-ECV Evaluation and 99 mTc-PYP Scintigraphy
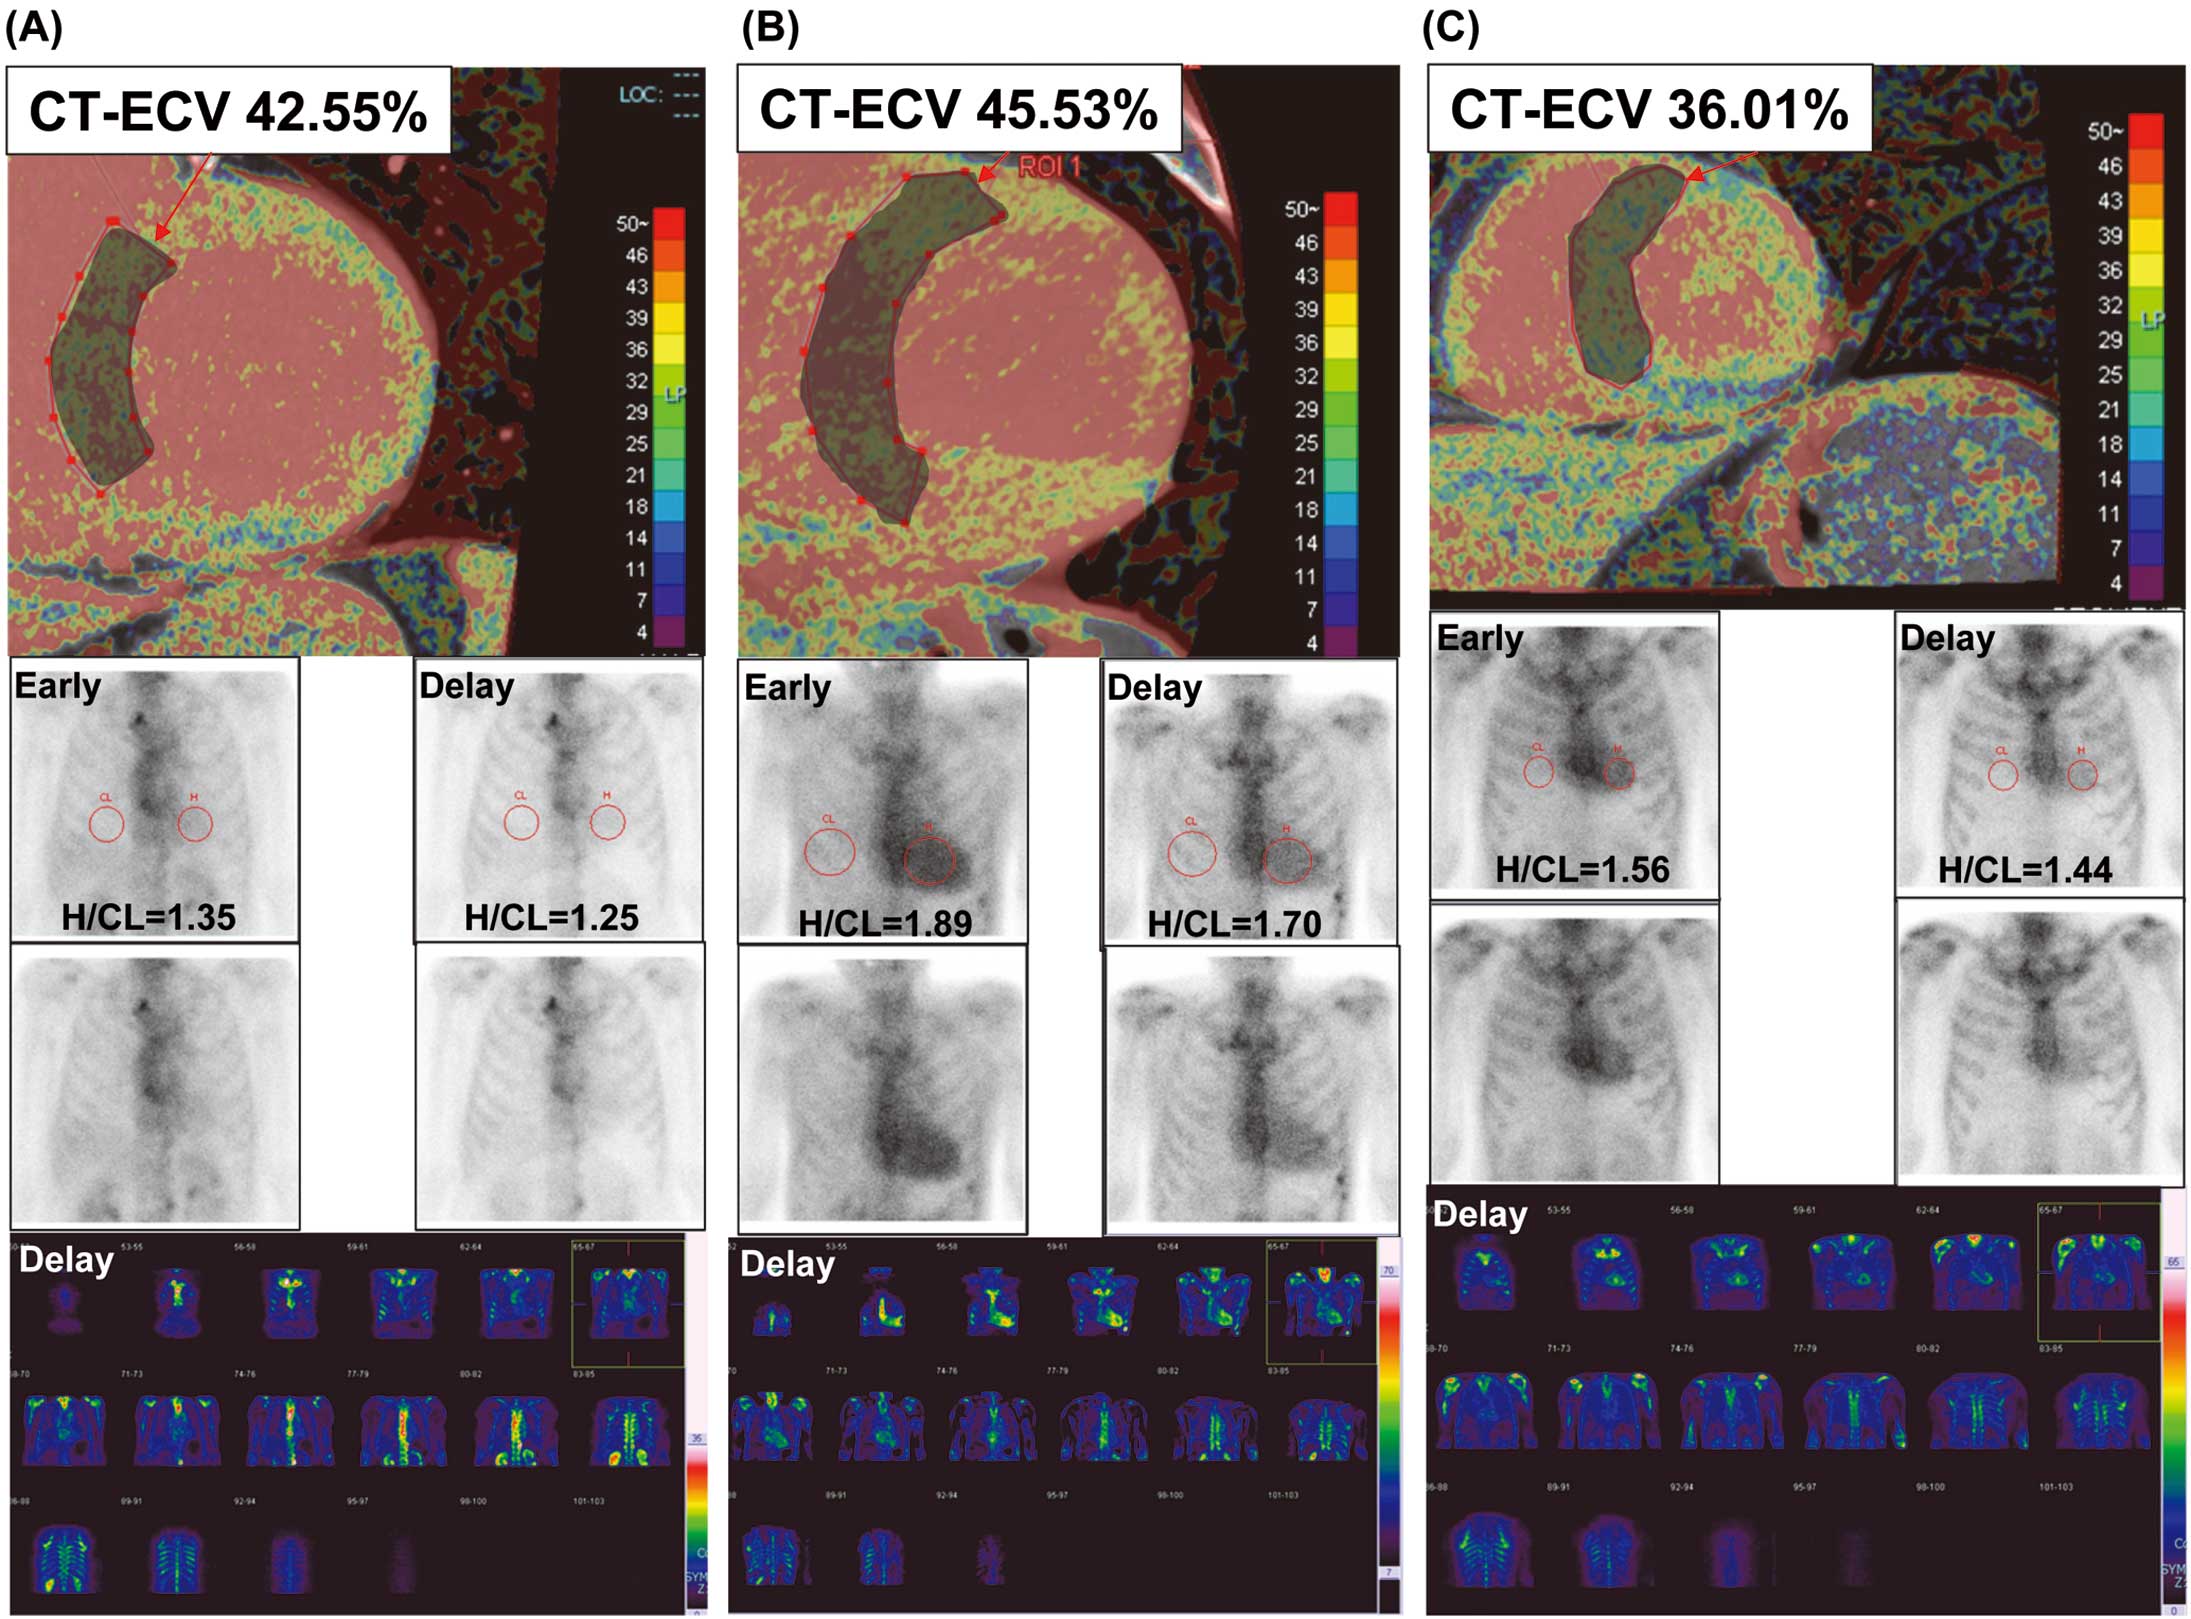
A representative case of CT-ECV positivity and 99 mTc-PYP scintigraphy negativity is shown in Figure 4A. This patient was diagnosed with hypertensive heart disease based on additional cardiac evaluation after AF ablation. A typical case of ATTR-CM with CT-ECV positivity and 99 mTc-PYP scintigraphy positivity is shown in Figure 4B. This patient was diagnosed with ATTRwt-CM based on the pathological evaluation and genetic testing after AF ablation. Notably, CT-ECV screening identified patients with relatively early stage ATTRwt-CM (Figure 4C).
Association Between the Value of CT-ECV and Other Cardiac Parameters
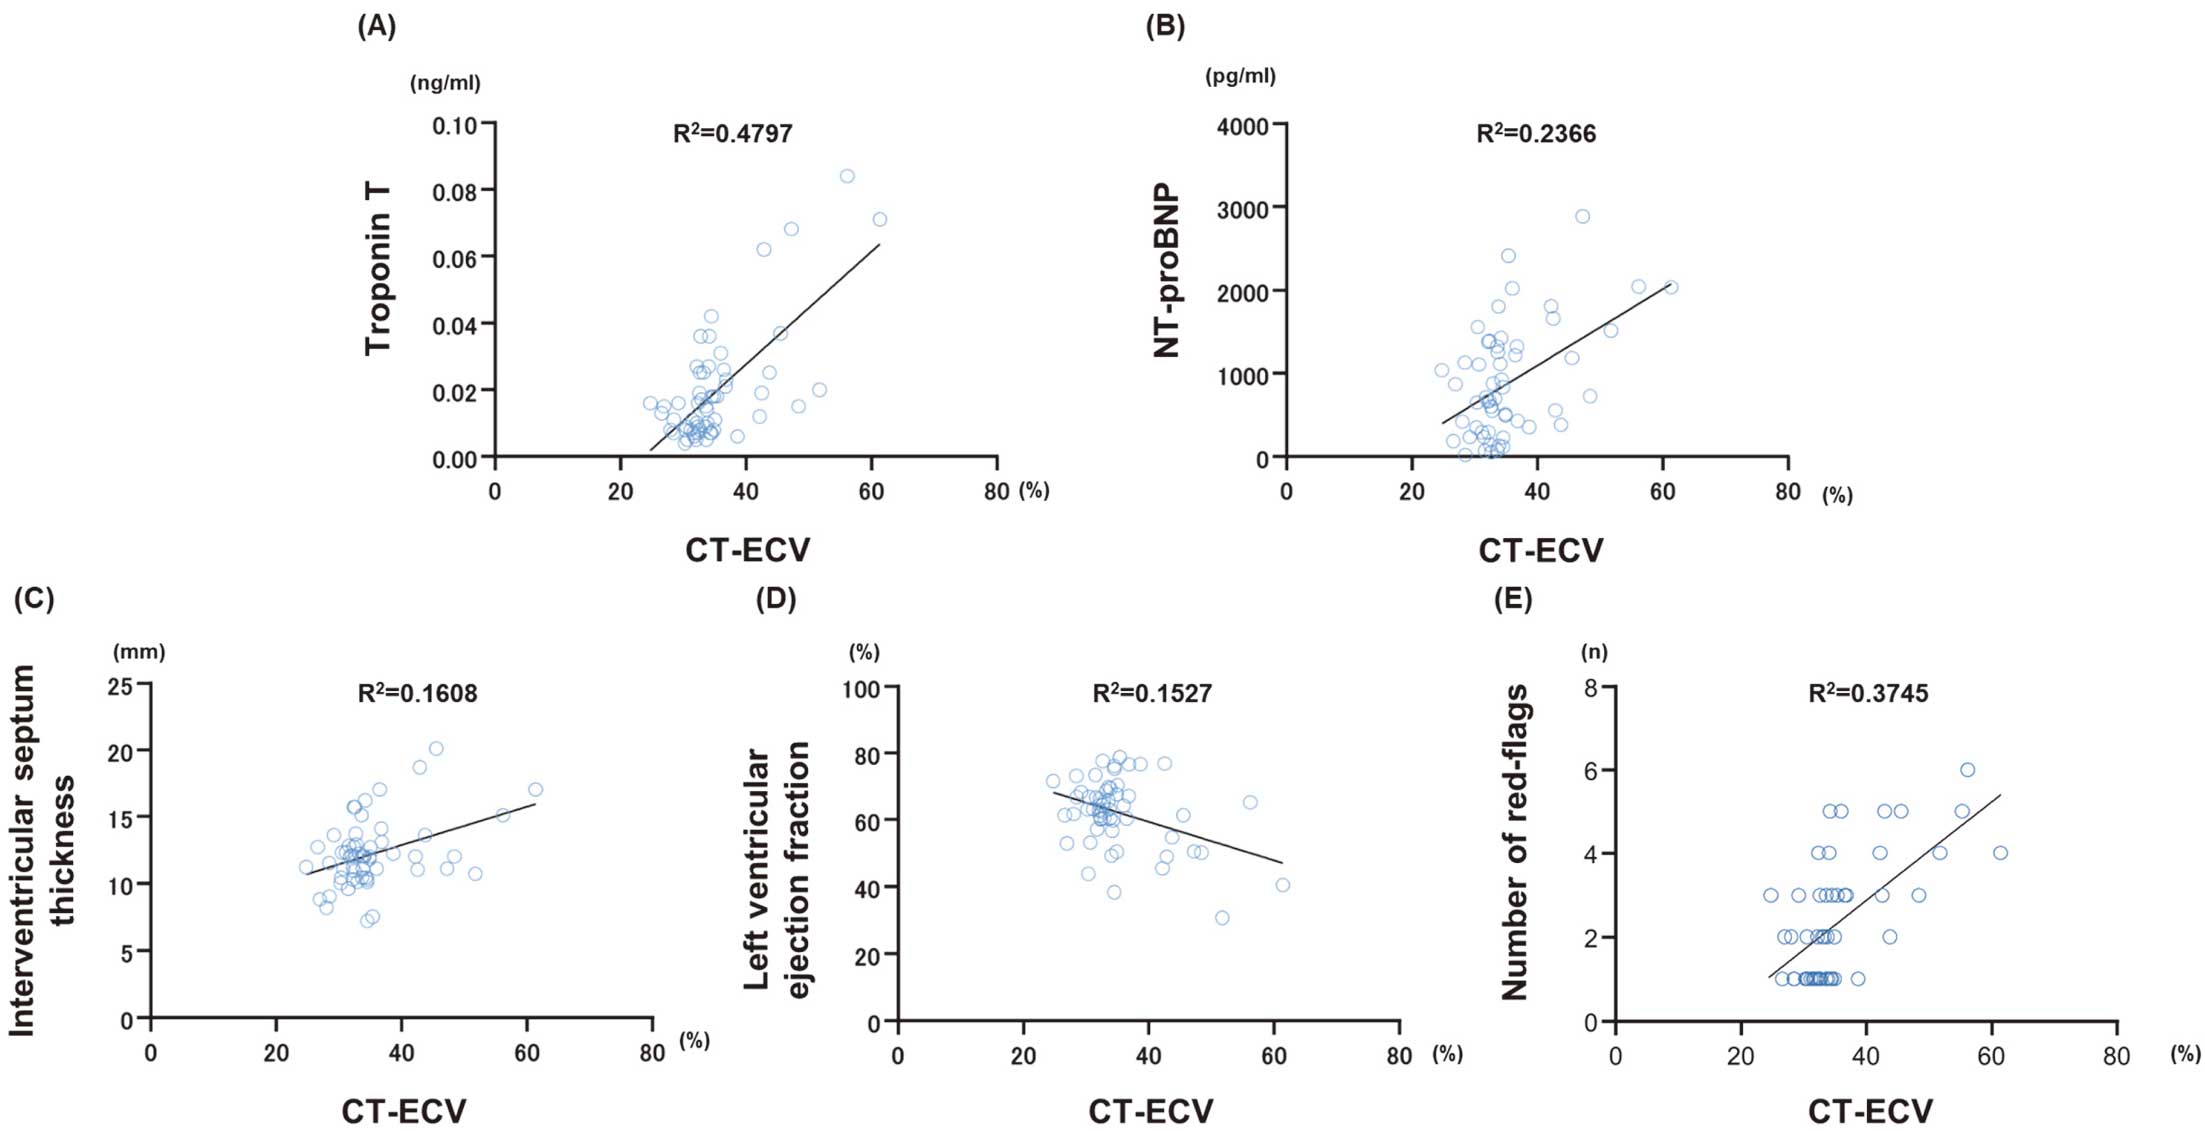
The mean value of CT-ECV in all 57 patients was 35.3±6.95%. There was a positive correlation between CT-ECV and the New York Heart Association functional classification (R2=0.2576, P=0.0003), troponin T (R2=0.4797, P<0.0001; Figure 5A), and NT-proBNP (R2=0.2366, P=0.0001; Figure 5B). Among the echocardiographic parameters, CT-ECV was positively correlated with interventricular septum thickness (R2=0.1608, P=0.0020; Figure 5C) and negatively correlated with LV ejection fraction (R2=0.1527, P=0.0027; Figure 5D). Importantly, CT-ECV was positively correlated with the number of red flags (R2=0.3745, P<0.0001; Figure 5E).
Discussion
In this study, we prospectively evaluated the utility of a screening strategy for cardiac amyloidosis, particularly ATTR-CM, using a combination of red-flag symptoms and signs, myocardial ECV evaluated using pre-ablation CT, and 99 mTc-PYP scintigraphy in patients scheduled for catheter ablation for AF. We found that 1.8% of AF patients undergoing catheter ablation at an ablation center in a provincial city with a capacity of 300–400 cases per year were diagnosed with ATTR-CM. Although performing 99 mTc-PYP scintigraphy in all patients undergoing AF ablation with at least one of the red-flag findings would be ideal for screening, there is a considerable lack of capacity to perform scintigraphy given the current situation of hospitals in Japan. Therefore, screening with myocardial ECV, which has a very high sensitivity for cardiac amyloidosis,12,13 using pre-ablation CT can reduce unnecessary 99 mTc-PYP scintigraphy evaluation.
In our screening flowchart, we selected patients eligible for the evaluation of myocardial CT-ECV using red-flag symptoms and signs. Based on the criteria reported by Inomata et al,8 we created a slightly modified version of the red-flag findings and symptoms. Our criteria do not necessarily require LV wall thickening >12 mm. LV wall thickening >12 mm is one of the red flags. In addition, our criteria do not include age. This modification means covering the detection of patients with hereditary ATTR-CM (ATTRv-CM), because patients with ATTRv-CM are occasionally diagnosed at age <60 years and some do not have severe LV wall thickening. Screening is important to reduce unnecessary radiation exposure and the time required for CT scans because evaluation of CT-ECV requires an additional CT scan 7 min after contrast administration. We believe that red-flag symptoms and signs are useful for identifying patients with AF who require CT-ECV evaluation.
Consistent with a previous study reporting the utility of the Kumamoto criteria,14 in the present study all 6 patients with ATTR-CM presented with high serum troponin T concentrations (>0.0308 ng/mL). Furthermore, all 10 patients who were CT-ECV positive/99 mTc-PYP scintigraphy negative had serum troponin T concentrations <0.0308 ng/mL. Serum troponin T concentrations were confirmed to be an extremely useful surrogate marker for the diagnosis of ATTR-CM.
Myocardial CT-ECV not only prevented missing patients with advanced ATTR-CM, but also detected patients with early stage ATTR-CM. Although a recent study recommends the use of the ATTR-CM risk score (ATTR-CM score ≥6) to guide the use of 99 mTc-PYP scintigraphy,15 the early stage ATTR-CM patient in the present study did not meet the criteria (ATTR-CM score=5), suggesting that CT-ECV may be useful for the diagnosis of cases of early stage ATTR-CM. Because an optimal CT-ECV cut-off value should be set for the early diagnosis of ATTR-CM, we set a cut-off value of 35% based on a previous study.7 Another recent study also suggested that a cut-off value of 37% would result in the best diagnostic performance of ECV for detecting cardiac amyloidosis,16 which is almost consistent with our cut-off value.
Recently, a retrospective study suggested that the use of tafamidis may lower the incidence of AF in patients with ATTR-CM.17 In that study, tafamidis use was found to be associated with a lower incidence of AF, with a hazard ratio of 0.43.17 That study was not a prospective randomized controlled trial and did not focus on patients who underwent AF ablation; however, early initiation of tafamidis treatment enabled by early diagnosis could reduce the recurrence of AF after catheter ablation and the subsequent morbidities associated with AF. Hopefully, screening with myocardial CT-ECV in patients with AF will become more widespread and help diagnose patients with ATTR-CM.
Study Limitations
This study had certain limitations. First, this was a single-center study with a relatively small number of patients. Second, of the patients with at least 1 red-flag sign, 10 could not be evaluated for CT-ECV because of allergy, uncontrolled asthma, or moderate/severe chronic kidney disease. Finally, not all patients who participated in this study underwent 99 mTc-PYP scintigraphy. Therefore, we cannot rule out the possibility that some of the patients with CT-ECV <35% may be diagnosed with cardiac amyloidosis.
Conclusions
The results of the present study suggest that myocardial CT-ECV could be a useful tool for the systematic screening for silent ATTR-CM in patients undergoing catheter ablation for AF.
Acknowledgment
The authors thank Masae Hayashi for administrative assistance.
Sources of Funding
This study did not receive any specific funding.
Disclosures
N.T. is a member of Circulation Journal’s Editorial Team. The remaining authors declare that there are no conflicts of interest.
IRB Information
This study was conducted in accordance with the Ethics Review Board of Oita University (Approval no. 2539). Informed consent was obtained from all subjects.
References
- 1.
Kittleson MM, Maurer MS, Ambardekar AV, Bullock-Palmer RP, Chang PP, Eisen HJ, et al. Cardiac amyloidosis: Evolving diagnosis and management: A scientific statement from the American Heart Association. Circulation 2020; 142: e7–e22.
- 2.
Kitaoka H, Izumi C, Izumiya Y, Inomata T, Ueda M, Kubo T, et al. The JCS 2020 guidelines for the diagnosis and treatment of cardiac amyloidosis. Circ J 2020; 84: 1610–1671.
- 3.
Porcari A, Razvi Y, Masi A, Patel R, Ioannou A, Rauf MU, et al. Prevalence, characteristics and outcomes of older patients with hereditary versus wild-type transthyretin amyloid cardiomyopathy. Eur J Heart Fail 2023; 25: 515–524.
- 4.
Prasad P, Howell S, Sanghai S, Stecker E, Henrikson CA, Masri A, et al. Targeted screening for transthyretin amyloid cardiomyopathy in patients with atrial fibrillation. Circulation 2022; 146: 1730–1732.
- 5.
Martinez-Naharro A, Kotecha T, Norrington K, Boldrini M, Rezk T, Quarta C, et al. Native T1 and extracellular volume in transthyretin amyloidosis. JACC Cardiovasc Imaging 2019; 12: 810–819.
- 6.
Oda S, Emoto T, Nakaura T, Kidoh M, Utsunomiya D, Funama Y, et al. Myocardial late iodine enhancement and extracellular volume quantification with dual-layer spectral detector dual-energy cardiac CT. Radiol Cardiothorac Imaging 2019; 1: e180003.
- 7.
Gama F, Rosmini S, Bandula S, Patel KP, Massa P, Tobon-Gomez C, et al. Extracellular volume fraction by computed tomography predicts long-term prognosis among patients with cardiac amyloidosis. JACC Cardiovasc Imaging 2022; 15: 2082–2094.
- 8.
Inomata T, Tahara N, Nakamura K, Endo J, Ueda M, Ishii T, et al. Diagnosis of wild-type transthyretin amyloid cardiomyopathy in Japan: Red-flag symptom clusters and diagnostic algorithm. ESC Heart Fail 2021; 8: 2647–2659.
- 9.
Hayashi H, Oda S, Kidoh M, Yamaguchi S, Yoshimura F, Takashio S, et al. Myocardial extracellular volume quantification in cardiac amyloidosis: A comparative study between cardiac computed tomography and magnetic resonance imaging. Eur Radiol 2024; 34: 1016–1025.
- 10.
Takashio S, Kato T, Tashima H, Irie H, Komohara Y, Oguni T, et al. Prevalence of cardiac amyloidosis in patients undergoing carpal tunnel release with amyloid deposition. Circ J 2023; 87: 1047–1055.
- 11.
Kanda Y. Investigation of the freely available easy-to-use software ‘EZR’ for medical statistics. Bone Marrow Transplant 2013; 48: 452–458.
- 12.
Chevance V, Damy T, Tacher V, Legou F, Ridouani F, Luciani A, et al. Myocardial iodine concentration measurement using dual-energy computed tomography for the diagnosis of cardiac amyloidosis: A pilot study. Eur Radiol 2018; 28: 816–823.
- 13.
Treibel TA, Bandula S, Fontana M, White SK, Gilbertson JA, Herrey AS, et al. Extracellular volume quantification by dynamic equilibrium cardiac computed tomography in cardiac amyloidosis. J Cardiovasc Comput Tomogr 2015; 9: 585–592.
- 14.
Marume K, Takashio S, Nishi M, Hirakawa K, Yamamoto M, Hanatani S, et al. Combination of commonly examined parameters is a useful predictor of positive 99 mTc-labeled pyrophosphate scintigraphy findings in elderly patients with suspected transthyretin cardiac amyloidosis. Circ J 2019; 83: 1698–1708.
- 15.
Davies DR, Redfield MM, Scott CG, Minamisawa M, Grogan M, Dispenzieri A, et al. A simple score to identify increased risk of transthyretin amyloid cardiomyopathy in heart failure with preserved ejection fraction. JAMA Cardiol 2022; 7: 1036–1044.
- 16.
Kidoh M, Oda S, Takashio S, Hirakawa K, Kawano Y, Shiraishi S, et al. CT extracellular volume fraction versus myocardium-to-lumen signal ratio for cardiac amyloidosis. Radiology 2023; 306: e220542.
- 17.
Girvin ZP, Sweat AO, Kochav SM, Maurer MS, Dizon J, Wan EY, et al. Tafamidis and incidence of atrial fibrillation in transthyretin amyloid cardiomyopathy. JACC Clin Electrophysiol 2023; 9: 586–587.