Abstract
Background: In the present study, we aimed to investigate whether early cardiac biomarker alterations and echocardiographic parameters, including left atrial (LA) strain, can predict anthracycline-induced cardiotoxicity (AIC) and thus develop a predictive risk score.
Methods and Results: The AIC registry is a prospective, observational cohort study designed to gather serial echocardiographic and biomarker data before and after anthracycline chemotherapy. Cardiotoxicity was defined as a reduction in left ventricular ejection fraction (LVEF) ≥10 percentage points from baseline and <55%. In total, 383 patients (93% women; median age, 57 [46–66] years) completed the 2-year follow-up; 42 (11.0%) patients developed cardiotoxicity (median time to onset, 292 [175–440] days). Increases in cardiac troponin T (TnT) and B-type natriuretic peptide (BNP) and relative reductions in the left ventricular global longitudinal strain (LV GLS) and LA reservoir strain [LASr] at 3 months after anthracycline administration were independently associated with subsequent cardiotoxicity. A risk score containing 2 clinical variables (smoking and prior cardiovascular disease), 2 cardiac biomarkers at 3 months (TnT ≥0.019 ng/mL and BNP ≥31.1 pg/mL), 2 echocardiographic variables at 3 months (relative declines in LV GLS [≥6.5%], and LASr [≥7.5%]) was generated.
Conclusions: Early decline in LASr was independently associated with subsequent cardiotoxicity. The AIC risk score may provide useful prognostication in patients receiving anthracyclines.
Anthracyclines are among the most commonly used chemotherapeutic agents in treating hematologic malignancies and solid tumors.1 However, their effectiveness is impaired by the development of myocardial dysfunction and heart failure (HF), termed cardiotoxicity or cancer therapy-related cardiac dysfunction (CTRCD). Cardinale et al reported that in patients with anthracycline-induced cardiotoxicity (AIC), cardiac function improved more when HF treatment was started earlier.2 Therefore, the early detection of subclinical myocardial injury is vital in reducing cardiovascular complications and enabling early initiation of cardioprotective agents.
Many studies have been conducted to identify early markers of AIC.3–6 Among them, cardiac biomarkers, cardiac troponins, natriuretic peptides, and left ventricular global longitudinal strain (LV GLS) measured using speckle-tracking echocardiography have reportedly predicted a future decline in left ventricular ejection fraction (LVEF) and significant cardiotoxicity.7,8 Accordingly, the European Society of Cardiology (ESC) cardio-oncology guideline recommends cardiac surveillance with these markers before and during anthracycline chemotherapy and in the first 12 months after chemotherapy.9 Ideally, cardiotoxicity risk assessment should be performed using a stratification method that determines patient-specific risk using cardiac biomarkers, echocardiographic markers, and clinical characteristics. However, no such risk score exists.
Notably, a few studies have recently reported the effects of cardiotoxic anticancer drugs on left atrial (LA) strain.10–12 LA strain analysis is used to measure LA phasic function and give early identification of LA dysfunction.13 Laufer-Perl et al reported that reductions of LA strain during the reservoir phase (LASr) and during the contraction phase (LASct) were observed in approximately half of the patients treated with anthracyclines and these changes occurred early during anthracycline therapy.12 However, it is unclear whether LA strain reduction predicts future cardiotoxicity.
Thus, in this prospective cohort study we aimed to (1) assess changes in cardiac biomarkers and echocardiographic parameters, including LA strain, after initiating anthracycline therapy, (2) assess their capacity to predict cardiotoxicity, and (3) create an AIC risk score to predict cardiotoxicity.
Methods
Design
The study cohort included patients with cancer who were receiving anthracycline chemotherapy and prospectively enrolled in the AIC registry between July 2016 and October 2021. The complete eligibility criteria have been previously described and are listed in Supplementary Table 1.14 The study was approved by the Institutional Review Board of the University of Tsukuba Hospital (H28-06), and all patients provided written informed consent. The study was in compliance with the principles outlined in the Declaration of Helsinki and approved by the Institutional Review Board of the University of Tsukuba Hospital (H28-06).
Study Protocol
The study’s protocol has been published.14 Patients were evaluated before initiating anthracycline therapy, every 3 months during the first year of anthracycline treatment and every 6 months during the second year, giving a total assessment >2 years (Supplementary Figure 1).
Echocardiography
Comprehensive echocardiographic examination was performed using a Vivid E9 or E95 ultrasound machine (GE Healthcare, Horten, Norway) equipped with an M5S-D or M5Sc-D transducer following the guidelines and a consensus document.15,16 Two-dimensional LVEF was computed from the left ventricular (LV) end-diastolic and end-systolic volumes calculated based on the biplane disk summation method in the 4- and 2-chamber apical views. As previously reported, longitudinal LV and LA strains were analyzed using commercially available software (automated function imaging [AFI] LV and LA; EchoPAC 204; GE Vingmed Ultrasound).16,17 Each image’s frame rate was maintained at ≥50 Hz/s to ensure reliable analysis. After identifying the endocardial border in each view, the software automatically identified the region of interest and tracked the speckle motion in subsequent frames. Three standard apical views of the LV were used. The peak systolic longitudinal strain values from all segments were averaged to obtain an LV GLS.17 LA-focused 4- and 2-chamber views were used for LA strain analysis, and the average of each strain value was calculated. The LASr, LA strain during conduit phase (LAScd), and LASct phase were recorded. Based on recommendations, zero strain reference was set at LV end-diastole in all LA strain analyses. We calculated the percent changes in LV GLS and LA strain values using the following equation: ([strain value at baseline − strain value at 3 months] / [strain value at baseline] × 100). The percentage variation (relative change) in strain values meant the absolute value of strain parameters, with negative and positive variations indicating worsening and improved deformations, respectively.
Biomarkers
High-sensitivity cardiac troponin T (TnT) and B-type natriuretic peptide (BNP) levels were measured at baseline and every visit during the follow-up period. The TnT levels were determined using a Cobas 8000 (Roche, Basel, Switzerland), and BNP levels were evaluated using a Lumipulse Presto II (Fujirebio Inc., Tokyo, Japan). All measurements were performed at the Tsukuba i-laboratory Limited Liability Partnership, Tsukuba, Japan.
Outcome
Cardiotoxicity that developed during the 2-year follow-up period was the primary outcome and defined as a reduction in LVEF ≥10 percentage points from baseline and <55%, following the Cardiac Review and Evaluation Committee criteria.18
Sensitivity Analysis
Post hoc sensitivity analysis was performed using the CTRCD definition (reduction in LVEF ≥10 percentage points from baseline and <50%) in the Japanese Society of Medical Oncology (JSMO) and the Japanese Onco-Cardiology Society (JOCS)’s Onco-cardiology guideline.19
Formula for Doxorubicin Equivalent Dose
We used the following formulas from the JSMO and JOCS’s Onco-cardiology guideline19 to convert our results to the doxorubicin isotoxic equivalent dose before calculating the total cumulative anthracycline dose: for doxorubicin, we used the total dose; we multiplied the total dose by 0.6 for daunorubicin and epirubicin; and we multiplied the total dose by 4 for idarubicin.
Statistical Analysis
Continuous measures are expressed as the mean value±standard deviation (SD) or median and interquartile range (IQR) for normally or skewed distributed variables. Continuous variables from 2 data sets were compared using Student’s t-test or the Mann-Whitney U test for non-normal distributions. Categorical variables are presented as percentages and were compared using the χ2
or Fisher’s exact test. Inter- and intraobserver variability for LV GLS and LA strain indices were evaluated by estimating intraclass correlation coefficients based on 30 randomly chosen studies.
For TnT, BNP, relative reduction ([strain value at baseline − strain value at 3 months] / [strain value at baseline] × 100 [%]) in LV GLS, LASr, LAScd, and LASct (∆LV GLS, ∆LASr, ∆LAScd, and ∆LASct, respectively), and the optimal cutoffs with the strongest associations with the primary outcome were identified using the Youden index (sensitivity + specificity-1). The variance inflation factor (VIF) was used to assess for multicollinearity, and for individual variables VIF >5 was considered multicollinearity and they were eliminated from the multiple linear regression analysis.
Missingness was overall low (<10%) for all the variables, with the exception of preference for ∆LV GLS (11%), ∆LASct (21%), and ∆LASr (21%) (Supplementary Figure 2); the levels of missingness for which multiple imputation with 20 replications has been shown to perform well.20–22 In total, 106 of 383 cases (28%) were incomplete. Incomplete variables were imputed under fully conditional specification, using the default settings of the mice 3.0 package.23 The parameters of substantive interest were estimated in each imputed dataset separately and combined using Rubin’s rules. We also performed the analysis on the subset of complete cases for comparison. Logistic regression analysis was performed to estimate odds ratios (ORs) and 95% coincidence intervals (CIs). The AIC risk score for predicting 2-year cardiotoxicity was generated using the primary outcome predictors with P value <0.20 in the multivariate regression model with backward elimination methods. Previous studies have described the generation of risk scores using complex survey data;24 each variable is assigned a numeric risk score calculated using a simple mathematic formula that identifies the β coefficient from the regression model and divides the value with the lowest of all β coefficients and rounds it up to the nearest integer. The reference category of each variable was assigned a score of 0. The risk score of incident cardiotoxicity was calculated as the sum of the individual scores. The risk score was calculated for each patient, and the accuracy in predicting cardiotoxicity was evaluated using receiver operating characteristic (ROC) analysis and area under the curve (AUC), showing the cutoff point with the highest Youden index. The population was divided into 3 categories based on the risk score: low (0–2), intermediate (3–5), and high (≥6) risk. Kaplan-Meier analyses were performed to evaluate survival probabilities in the different risk groups.
Statistical significance was set at two-sided P values <0.05. Statistical analyses were performed using R version 4.0.3 (The R Foundation for Statistical Computing, Vienna, Austria) and EZR for R (The R Foundation for Statistical Computing), a modified version of R commander designed to include statistical functions frequently used in biostatistics.25
Results
Patients
In total, 500 adult patients receiving anthracycline-containing chemotherapy were prospectively included in the registry. Of them, 39 were excluded at baseline for the following reasons: no anthracycline administration (n=20), anthracycline administration initiated before registration (n=7), pregnant or lactating (n=5), and withdrawal after registration (n=7); a further 78 patients discontinued the study before the end of the 2-year follow-up period due to primary disease progression or death (n=38), low anthracycline dosage (n=14), follow-up at other hospitals (n=8), clinical trial participation (n=3), or other reasons (n=15) (Supplementary Figure 3). The final cohort included 383 patients (93% women; median age, 57 years [46–66 years]).
Table 1 describes the cohort’s clinical and echocardiographic parameters. All patients were in sinus rhythm for at least 3 months before enrollment and had preserved LV contractility (LVEF >55%). During the 2-year follow-up, 42 patients (11.0%) developed cardiotoxicity (reduction of LVEF ≥10% to <55%). The median time to onset of cardiotoxicity was 292 days (175–440 days) after anthracycline administration. In addition, 22 patients (5.7%) met the JSMO and JOCS Onco-cardiology guideline criteria (reduction of LVEF ≥10% to <50%).
Table 1.
Summary of Baseline Characteristics of All Patients and of Those With and Without Cardiotoxicity
| |
All
(n=383) |
No cardiotoxicity
(n=341) |
Cardiotoxicity
(n=42) |
P value |
| Age, years |
57 (46~66) |
56 (45~66) |
59 (53~68) |
0.035 |
| Women |
356 (93.0) |
319 (93.5) |
37 (88.1) |
0.20 |
| Body surface areas, m2 |
1.56 (1.47~1.67) |
1.57 (1.47~1.68) |
1.54 (1.45~1.62) |
0.083 |
| Systolic blood pressure, mmHg |
128 (115~141) |
128 (115~142) |
123 (114~139) |
0.29 |
| Diastolic blood pressure, mmHg |
72 (65~82) |
72 (65~82) |
70 (67~82) |
0.80 |
| Heart rate, beats/min |
74 (66~85) |
74 (67~84) |
79 (64~92) |
0.34 |
| Diabetes |
29 (7.6) |
25 (7.3) |
4 (9.5) |
0.54 |
| Hypertension |
104 (27.2) |
93 (27.3) |
11 (26.2) |
1.00 |
| Obesity (BMI ≥25 kg/m2) |
115 (30.3) |
108 (31.7) |
7 (17.9) |
0.097 |
| Smoking |
89 (23.2) |
72 (21.1) |
17 (40.5) |
0.011 |
| Prior CVD |
21 (5.5) |
13 (3.8) |
8 (19.0) |
0.001 |
| Atrial fibrillation |
7 (1.8) |
6 (1.8) |
1 (2.4) |
0.56 |
| Coronary artery disease |
2 (0.52) |
1 (0.29) |
1 (2.4) |
0.21 |
| Heart failure |
6 (1.6) |
4 (1.2) |
2 (4.8) |
0.21 |
| Previous anthracycline treatment |
6 (1.6) |
6 (1.8) |
0 (0) |
1.00 |
| Baseline medications |
| ACEI/ARB |
52 (13.6) |
44 (12.9) |
8 (19.0) |
0.34 |
| β-blocker |
16 (4.2) |
10 (2.9) |
6 (14.3) |
0.004 |
| Statin |
53 (13.8) |
43 (12.6) |
10 (23.8) |
0.060 |
| Oncological disease |
|
|
|
0.075 |
| Breast cancer |
308 (80.4) |
278 (81.5) |
30 (71.4) |
|
| Malignant lymphoma |
43 (11.2) |
34 (10.0) |
9 (21.4) |
|
| Ovarian cancer |
22 (5.7) |
21 (6.2) |
1 (2.4) |
|
| Leukemia |
5 (1.3) |
3 (0.9) |
2 (4.8) |
|
| Other |
3 (0.8) |
3 (0.9) |
0 (0.0) |
|
| Cumulative doxorubicin equivalent dose, mg/m2 |
237 (234~240) |
237 (234~240) |
236 (194~240) |
0.084 |
| HER2-targeted therapy |
97 (25.3) |
13 (31.0) |
84 (24.6) |
0.36 |
| TnT, ng/mL |
0.004 (0.003~0.007) |
0.004 (0.003~0.007) |
0.006 (0.003~0.010) |
0.020 |
| BNP, pg/mL |
19.3 (10.6~32.8) |
19.2 (10.4~32.3) |
24.6 (14.3~38.4) |
0.14 |
| eGFR, mL/min/1.73 m2 |
103 (90~119) |
103 (91~120) |
93 (77~110) |
0.004 |
| <60 mL/min/1.73 m2 |
11 (2.9) |
5 (1.5) |
6 (14.6) |
<0.001 |
| Baseline echocardiography |
| LVEDV, mL |
81.6 (70.6~96.9) |
82.0 (70.1~96.6) |
80.6 (72.0~98.9) |
0.85 |
| LVESV, mL |
27.8 (23.3~33.8) |
27.7 (23.2~33.6) |
28.8 (26.0~38.8) |
0.11 |
| LVEF, % |
65 (63~68) |
66 (63~68) |
64 (62~66) |
0.002 |
| LV GLS,a % |
−19.7 (−21.6~−17.9) |
−19.9 (−21.6~−18.0) |
−18.6 (−20.1~−17.7) |
0.053 |
| E/A |
0.89 (0.74~1.31) |
0.91 (0.75~1.33) |
0.76 (0.68~1.12) |
0.018 |
| Septal e´, cm/s |
8.2 (6.1~10.2) |
8.3 (6.3~10.3) |
7.00 (5.20~9.20) |
0.024 |
| Lateral e´, cm/s |
10.0 (8.0~12.6) |
10.2 (8.2~12.8) |
9.5 (7.1~10.4) |
0.036 |
| Average E/e´ |
7.4 (6.2~9.0) |
7.4 (6.2~9.0) |
7.3 (5.9~9.0) |
0.65 |
| LAVI, mL/m2 |
26.0 (22.0~31.0) |
26.0 (21.0~31.0) |
27.0 (24.0~32.0) |
0.22 |
| LAScd,b % |
−15.0 (−19.2~−11.4) |
−15.4 (−19.3~−11.5) |
−12.7 (−16.3~−9.2) |
0.040 |
| LASct,b % |
−13.8 (−16.7~−11.3) |
−13.8 (−16.8~−11.3) |
−14.3 (−16.1~−11.7) |
0.78 |
| LASr,b % |
−29.3 (−34.2~−25.8) |
−29.6 (−34.2~−25.9) |
−27.8 (−33.9~−22.6) |
0.25 |
Data are expressed as n (%), mean±SD, or median (interquartile range). aLV GLS had 34 missing values. bLA strains had 51 missing values. ACEI/ARB, angiotensin-converting enzyme inhibitor/angiotensin II receptor blocker; BMI, body mass index; BNP, B-type natriuretic peptide; CVD, cardiovascular disease; eGFR, estimated glomerular filtration rate; HER2, human epidermal growth factor receptor 2; LAScd, left atrial strain during conduit phase; LASct, left atrial strain during contraction phase; LASr, left atrial strain during reservoir phase; LAVI, left atrial volume index; LVEDV, left ventricular end-diastolic volume; LVEF, left ventricular ejection fraction; LVESV, left ventricular end-systolic volume; LV GLS, left ventricular global longitudinal strain; TnT, troponin T.
Baseline Characteristics
Patients who developed cardiotoxicity were older and more likely to be using β-blockers, and they had higher prevalences of a smoking habit, prior cardiovascular disease (CVD), and estimated glomerular filtration rate (eGFR) <60 mL/min/1.73 m2. Patients with and without cardiotoxicity showed no difference in anthracycline dose. Higher baseline TnT levels were observed among the patients with cardiotoxicity. There were no differences in baseline BNP levels. Of the echocardiographic variables evaluated, patients with cardiotoxicity had lower LVEF, lower E/A ratio, lower septal and lateral e´ velocities, and LAScd (Table 1).
Biomarkers and Echocardiographic Parameters at 3 Months
Table 2 shows the medications, biomarkers, and echocardiographic parameters 3 months after initiating anthracycline therapy. The TnT and BNP levels were higher in patients with cardiotoxicity. Of the echocardiographic parameters, LVEF, LV GLS, septal e´, LASct, and LASr were more significantly reduced in patients with cardiotoxicity. Relative reductions in LV GLS, LASct, and LASr were more pronounced in patients with cardiotoxicity than in those without cardiotoxicity.
Table 2.
Summary of Biomarkers and Echocardiographic Parameters at 3 Months
| |
All
(n=383) |
No cardiotoxicity
(n=341) |
Cardiotoxicity
(n=42) |
P value |
| Medications |
| ACEI/ARB |
50 (13.1) |
45 (13.2) |
5 (11.9) |
1.00 |
| β-blocker |
13 (3.4) |
11 (3.2) |
2 (4.8) |
0.64 |
| Statin |
51 (13.3) |
45 (13.2) |
6 (14.3) |
0.81 |
| Biomarkers |
| TnT, ng/mL |
0.015 (0.011~0.023) |
0.015 (0.010~0.022) |
0.021 (0.014~0.032) |
<0.001 |
| BNP, pg/mL |
21.3 (12.0~40.23) |
20.3 (11.8~35.9) |
32.9 (16.3~58.9) |
0.016 |
| Echocardiography |
| LVEDV, mL |
86.3 (73.6~100.2) |
86.3 (74.0~99.6) |
89.6 (70.6~103.7) |
0.67 |
| LVESV, mL |
30.4 (25.6~36.8) |
30.3 (25.2~36.2) |
32.8 (26.8~43.7) |
0.100 |
| LVEF, % |
64 (62~67) |
64 (62~67) |
62 (57~64) |
<0.001 |
| LV GLS,a % |
−18.9 (−20.9~17.0) |
−19.0 (−21.0~−17.2) |
−17.4 (−18.7~−15.7) |
<0.001 |
| ΔLV GLS,b % |
3.6 (−92.7~62.4) |
3.3 (−92.7~45.6) |
7.7 (−33.6~62.4) |
0.018 |
| E/A |
0.88 (0.74~1.26) |
0.89 (0.74~1.26) |
0.84 (0.68~1.15) |
0.13 |
| Septal e´, cm/s |
8.0 (6.4~10.0) |
8.1 (6.4~10.2) |
6.9 (5.6~8.7) |
0.020 |
| Lateral e´, cm/s |
10.2 (8.00~12.7) |
10.3 (8.0~12.8) |
9.6 (6.8~11.9) |
0.13 |
| E/e´ |
7.30 (6.00~9.00) |
7.20 (6.00~9.00) |
7.40 (6.03~8.90) |
0.695 |
| LAVI, mL/m2 |
27.0 (23.0~32.0) |
27.0 (22.0~32.0) |
28.0 (24.0~32.8) |
0.61 |
| LAScd,c % |
−14.6 (−19.0~−10.9) |
−15.0 (−19.2~−10.9) |
−13.0 (−15.8~−10.1) |
0.13 |
| ΔLAScd,d % |
1.3 (−23.6~24.7) |
0.7 (−24.3~23.8) |
8.0 (−14.3~28.0) |
0.57 |
| LASct,c % |
−13.1 (−16.3~−10.6) |
−13.3 (−16.5~−11.0) |
−11.5 (−14.8~−9.0) |
0.029 |
| ΔLASct,d % |
6.7 (−12.7~25.5) |
5.1 (−13.6~22.9) |
18.0 (−0.5~29.6) |
0.020 |
| LASr,c % |
−28.6 (−34.1~−23.3) |
−28.9 (−34.6~−23.6) |
−26.7 (−30.7~−21.0) |
0.008 |
| ΔLASr,d % |
4.4 (−12.3~19.9) |
2.9 (−13.9~18.8) |
13.5 (−0.8~27.2) |
0.013 |
Data are expressed as n (%), mean±SD, or median (interquartile range). Δ is the relative reduction between baseline measurement and measurement at 3 months after anthracycline administration. aLV GLS had 20 missing values. bΔLV GLS had 43 missing values. cLA strains had 46 missing values. dΔLV GLS had 79 missing values. Abbreviations as in Table 1.
Cardiotoxicity Predictors
Next, we evaluated the prognostic value of TnT, BNP, LV GLS, and LA strains. TnT and BNP levels at 3 months and the relative reductions in LV GLS, LASct, and LASr at 3 months were univariably associated with the outcome (Table 3). ROC analysis identified that TnT ≥0.019 ng/mL, BNP ≥31.1 pg/mL, ∆LV GLS ≥6.5%, ∆LASct ≥12.9%, and ∆LASr ≥7.5% at 3 months provided the best discriminatory values for the primary outcome (Supplementary Table 2). The univariate and multivariate logistic regression analyses using multiple imputation or complete cases (cases with no missing values for the predictors selected from the univariable analysis) are shown in Table 4 and Supplementary Table 3, respectively. Smoking, CVD history, TnT ≥0.019 ng/mL, BNP ≥31.1 pg/mL, ∆LV GLS ≥6.5%, and ∆LASr ≥7.5% at 3 months were independently associated with a significantly higher cardiotoxicity incidence in both analyses.
Table 3.
Univariate Analysis of Cardiotoxicity Predictors
| Variable |
OR (95% CI) |
P value |
| TnT at 3 months per 0.01 ng/mL higher |
1.05 (1.02~1.08) |
<0.001 |
| BNP at 3 months per 1 pg/mL higher |
1.01 (1.01~1.02) |
<0.001 |
| ΔLV GLS |
1.03 (1.00~1.05) |
0.020 |
| ΔLAScd |
1.00 (0.99~1.01) |
0.64 |
| ΔLASct |
1.01 (1.00~1.02) |
0.029 |
| ΔLASr |
1.02 (1.01~1.04) |
0.009 |
Δ is the relative reduction between baseline measurement and measurement at 3 months after anthracycline administration. CI, confidence interval; OR, odds ratio. Other abbreviations as in Table 1.
Table 4.
Univariate and Multivariate Analyses of Potential Cardiotoxicity Predictors Using Multiple Imputation
| Characteristic |
Unadjusted OR
(95% CI) |
Unadjusted
P value |
Model 1 |
Model 2 |
Adjusted OR
(95% CI) |
Adjusted
P value |
Adjusted OR
(95% CI) |
Adjusted
P value |
| Age >60 years |
1.5 (0.8~2.8) |
0.25 |
– |
– |
– |
– |
| Male |
2.0 (0.7~5.6) |
0.19 |
– |
– |
– |
– |
| Smoking |
2.6 (1.3~5.1) |
0.006 |
3.1 (1.4~6.6) |
0.004 |
3.3 (1.5~6.9) |
0.002 |
| Prior CVD |
6.0 (2.3~15.7) |
<0.001 |
9.0 (2.8~28.9) |
<0.001 |
9.6 (3.0~31.1) |
<0.001 |
| eGFR <60 mL/min/1.73 m2 |
11.4 (3.3~39.4) |
<0.001 |
– |
– |
– |
– |
| HER2-targeted therapy |
1.2 (0.6~2.6) |
0.55 |
– |
– |
– |
– |
| TnT ≥0.019 ng/mL at 3 months |
3.3 (1.6~6.5) |
0.001 |
4.1 (1.9~8.9) |
<0.001 |
3.8 (1.8~8.2) |
0.001 |
| BNP ≥31.1 pg/mL at 3 months |
3.3 (1.7~6.5) |
<0.001 |
3.3 (1.5~7.0) |
0.004 |
2.7 (1.3~5.7) |
0.009 |
| ΔLV GLS ≥6.5% at 3 months |
2.3 (1.2~4.5) |
0.016 |
3.2 (1.5~6.9) |
0.017 |
– |
– |
| ΔLASct ≥12.9% at 3 months |
2.0 (1.0~4.3) |
0.061 |
– |
– |
– |
– |
| ΔLASr ≥7.5% at 3 months |
2.2 (1.0~4.7) |
0.039 |
– |
– |
2.6 (1.1~6.0) |
0.029 |
Δ is the relative reduction between baseline measurement and measurement at 3 months after anthracycline administration. Abbreviations as in Tables 1,3.
AIC Risk Score Derivation
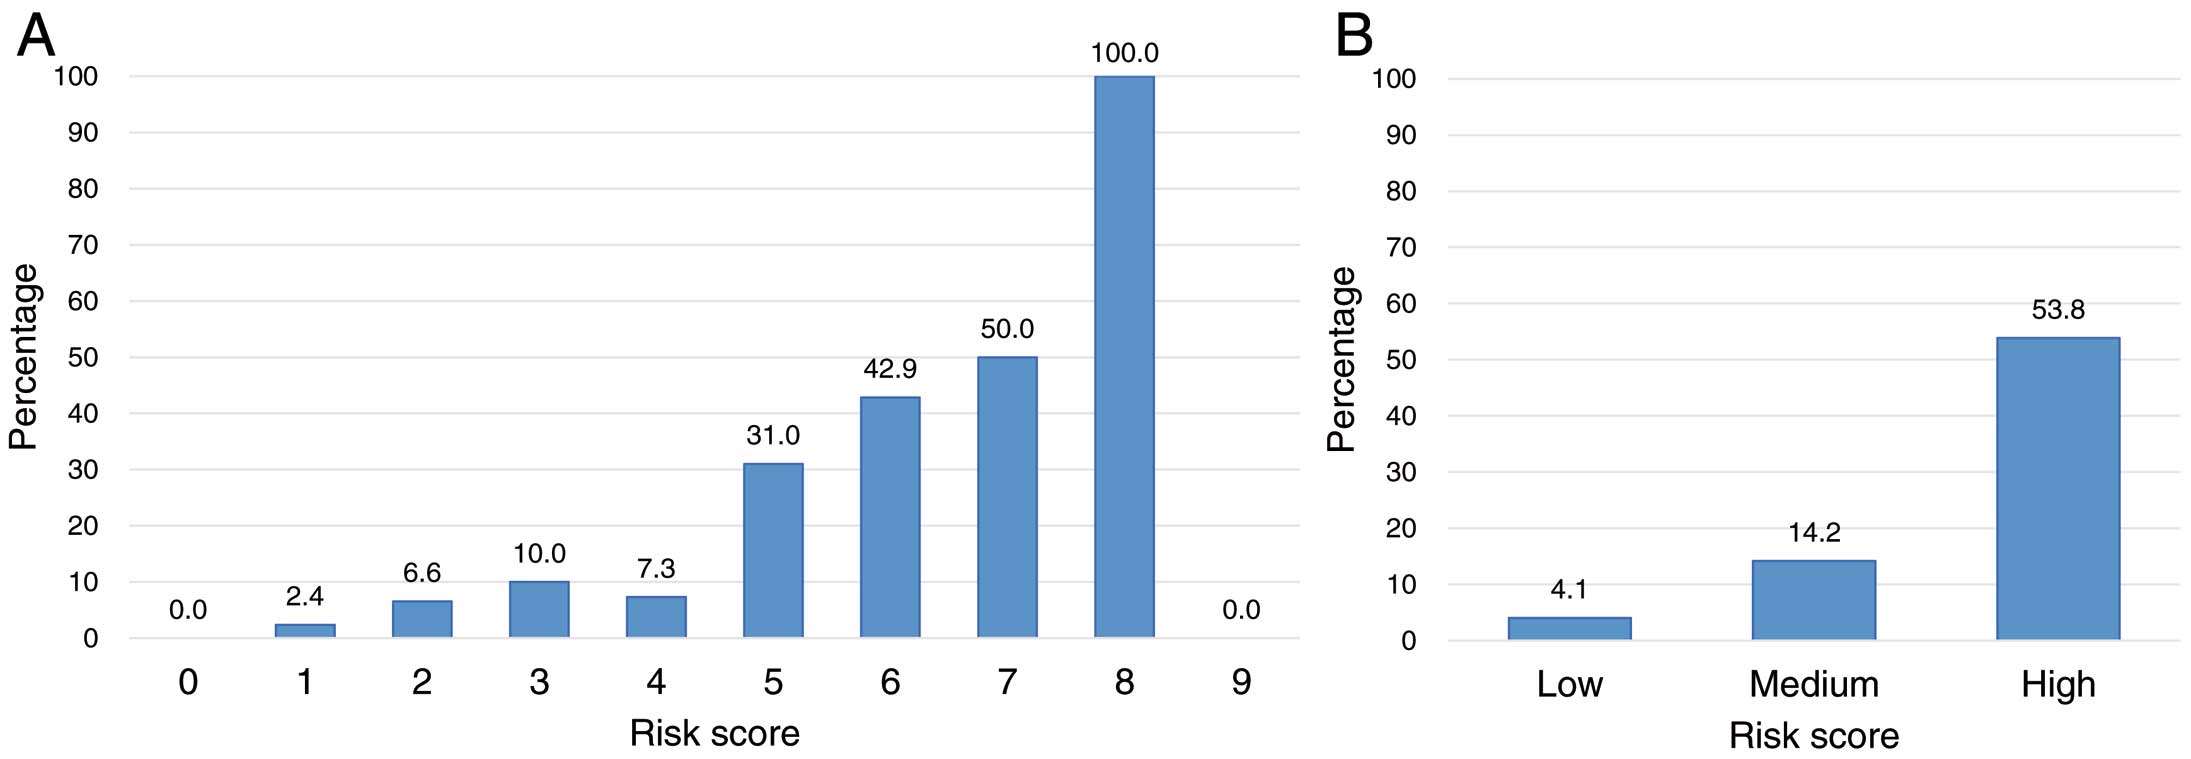
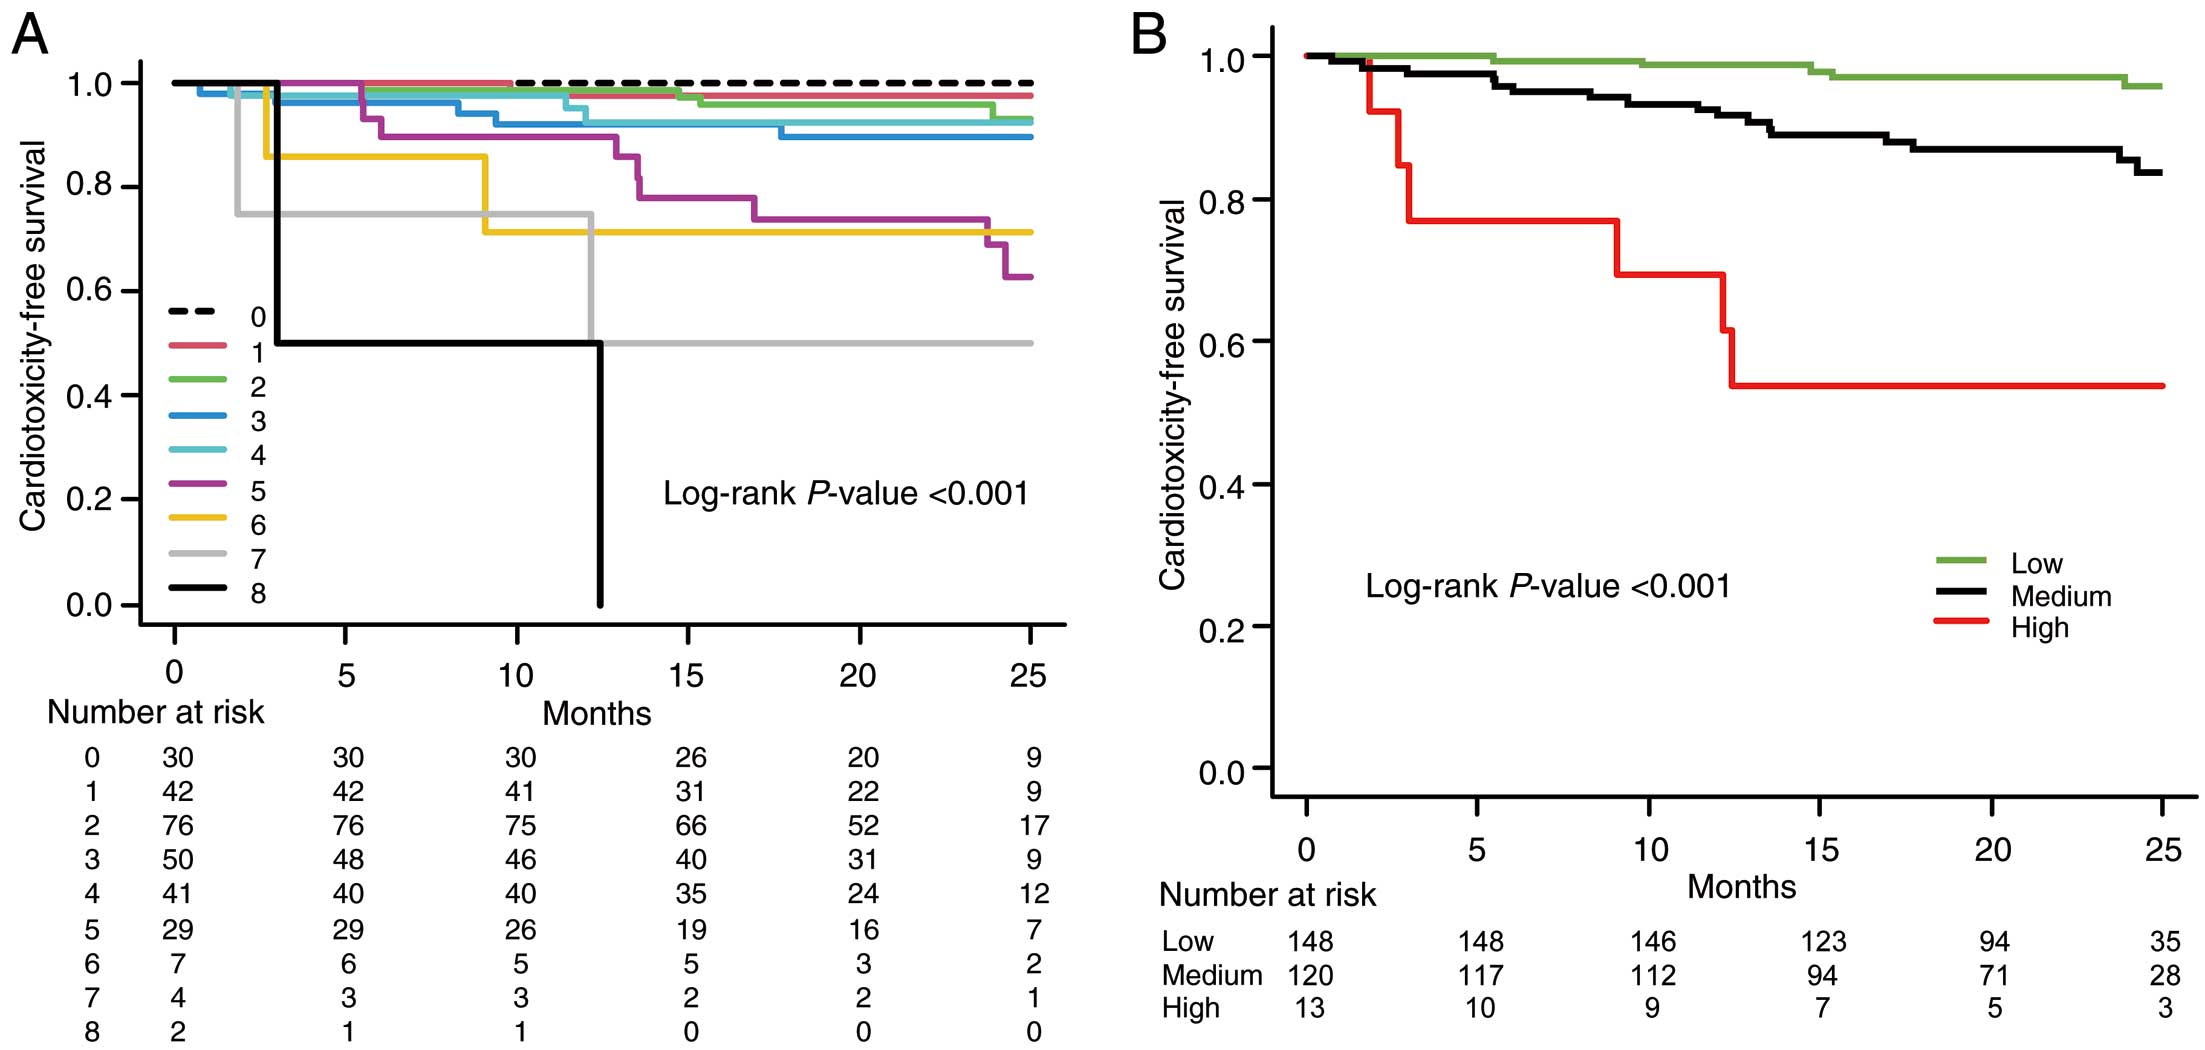
The AIC risk score was generated using the primary outcome predictors with P<0.20 in the multivariate analysis using multiple imputation. Table 5 shows that point values were assigned for the following variables: smoking (+1 point), prior CVD (+2 points), TnT ≥0.019 ng/mL (+2 points), BNP ≥31.1 pg/mL (+2 points), ∆LV GLS ≥6.5% (+1 point), and ∆LASr ≥7.5% (+1 point) at 3 months. Combining these values, the AIC risk score could range from 0 to 9 points and level of risk was further defined as low (0–2 points), medium (3–5 points), and high (≥6 points). Supplementary Figure 4 shows the frequency of the risk scores across the cohort. Observed cardiotoxicity increased with higher risk scores (Figure 1). The corresponding observed cardiotoxicity in the low-risk group was 4.1%, increasing to 14.2% and 53.8% in the medium- and high-risk groups, respectively. A similar relationship of increasing risk score correlating with an increased risk of cardiotoxicity was observed when the AIC risk score was applied to predict CTRCD defined in the JSMO and JOCS Onco-cardiology guideline (reduction of LVEF ≥10% to <50%) (Supplementary Figure 5). Figure 2 and Supplementary Figure 6 present the Kaplan-Meier curves for the 2-year rates of cardiotoxicity. A steady decrease in the 2-year cardiotoxicity-free survival rate was observed with increasing risk. In both patients with breast cancer and those with hematological malignancy in this cohort, the incidence of cardiotoxicity also increased as the risk score increased (Supplementary Figures 7A,7B,8A,8B). Similarly, among patients with breast cancer in our cohort, the incidence of cardiotoxicity increased with increasing risk score, with and without anti-HER2 therapy (Supplementary Figures 7C,7D,8C,8D).
Table 5.
AIC Risk Score Derivation
| Predictor |
Adjusted coefficient |
Risk score |
| Smoking |
0.142 |
1 |
| Prior CVD |
0.217 |
2 |
| TnT ≥0.019 ng/mL at 3 months |
0.183 |
2 |
| BNP ≥31.1 pg/mL at 3 months |
0.161 |
2 |
| ΔLV GLS ≥6.5% at 3 months |
0.124 |
1 |
| ΔLASr ≥7.5% at 3 months |
0.101 |
1 |
Δ is the relative reduction between baseline measurement and measurement at 3 months after anthracycline administration. AIC, anthracycline-induced cardiotoxicity. Other abbreviations as in Table 1.
Reproducibility
The inter- and intraobserver interclass correlations for LV GLS, LASr, LAScd, and LASct were 0.91 and 0.89, 0.96 and 0.95, 0.96 and 0.93, and 0.94 and 0.89, respectively.
Discussion
This study’s major findings can be summarized as: 1) During the 2-year follow-up, 11.0% of patients developed cardiotoxicity; 2) LASct and LASr were significantly lower in the patients with cardiotoxicity at the 3-month follow-up than in those without cardiotoxicity; 3) TnT at 3 months, BNP at 3 months, ΔLV GLS, and ΔLASr, were independently associated with cardiotoxicity development; 4) A risk score containing two clinical variables (smoking and prior CVD), two cardiac biomarkers at 3 months (TnT ≥0.019 ng/mL and BNP ≥31.1 pg/mL), and two echocardiographic variables at 3 months (ΔLV GLS [≥6.5%], and ΔLASr [≥7.5%]) was generated.
Recently, a few studies have reported the effects of cardiotoxic anticancer drugs on LA strain values. Emerson et al10 reported that LASct and LASr decreased significantly in patients who received bone marrow transplants with prior anthracycline exposure, and Laufer-Perl et al12 reported LASct and LASr reductions in patients with breast cancer receiving anthracyclines. However, the association between decreased LA strain and AIC remains unclear. In the present study, LASct and LASr at 3 months were significantly declined in patients who developed cardiotoxicity, despite baseline values being similar to those in patients without cardiotoxicity. In addition, the relative reductions in LASct and LASr were more pronounced in patients with cardiotoxicity and were associated with future development of cardiotoxicity. After adjusting for clinically relevant parameters, ∆LASr ≥7.5% at 3 months independently predicted cardiotoxicity. The AIC risk score, which included ∆LASr ≥7.5% as a variable, showed relatively high predictive ability. The following are possible mechanisms that quantify why a decline in LA function during the initial stage of anthracycline-containing chemotherapy helps predict future AIC development. Histopathologic abnormalities (myofibrillar disorganization, vacuolar degeneration, myocardial desquamation, and necrosis) due to anthracycline use have been demonstrated in ventricular muscle but are not evident in atrial muscle.26 The present study presented the finding of LV GLS and LASct decline at 3 months, reflecting contractile LV and LA function, respectively. This finding suggests that myocardial damage may occur concurrently in the LA and LV,16,17 which is consistent with the findings of previous studies.10–12 The LASr reflects the comprehensive LA reservoir function, including the LA wall’s active relaxation and passive extension.16,27 Anthracycline-induced degeneration or loss of atrial cardiomyocytes may lead to impaired active relaxation of the LA, followed by fibrosis and worsened passive stretch, with decreased LA strain as a consequence. Strain analysis detects subtle changes in LA deformation properties more directly and accurately than conventional LA functional parameters (i.e., mitral A velocity, pulmonary venous flow patterns, and LA emptying fraction by volumetric analysis).27 Furthermore, the characteristics of LA strain being load dependent and influenced by LV function27,28 might enhance the sensitivity for detection of AIC and consequent HF.
Clinical Implications
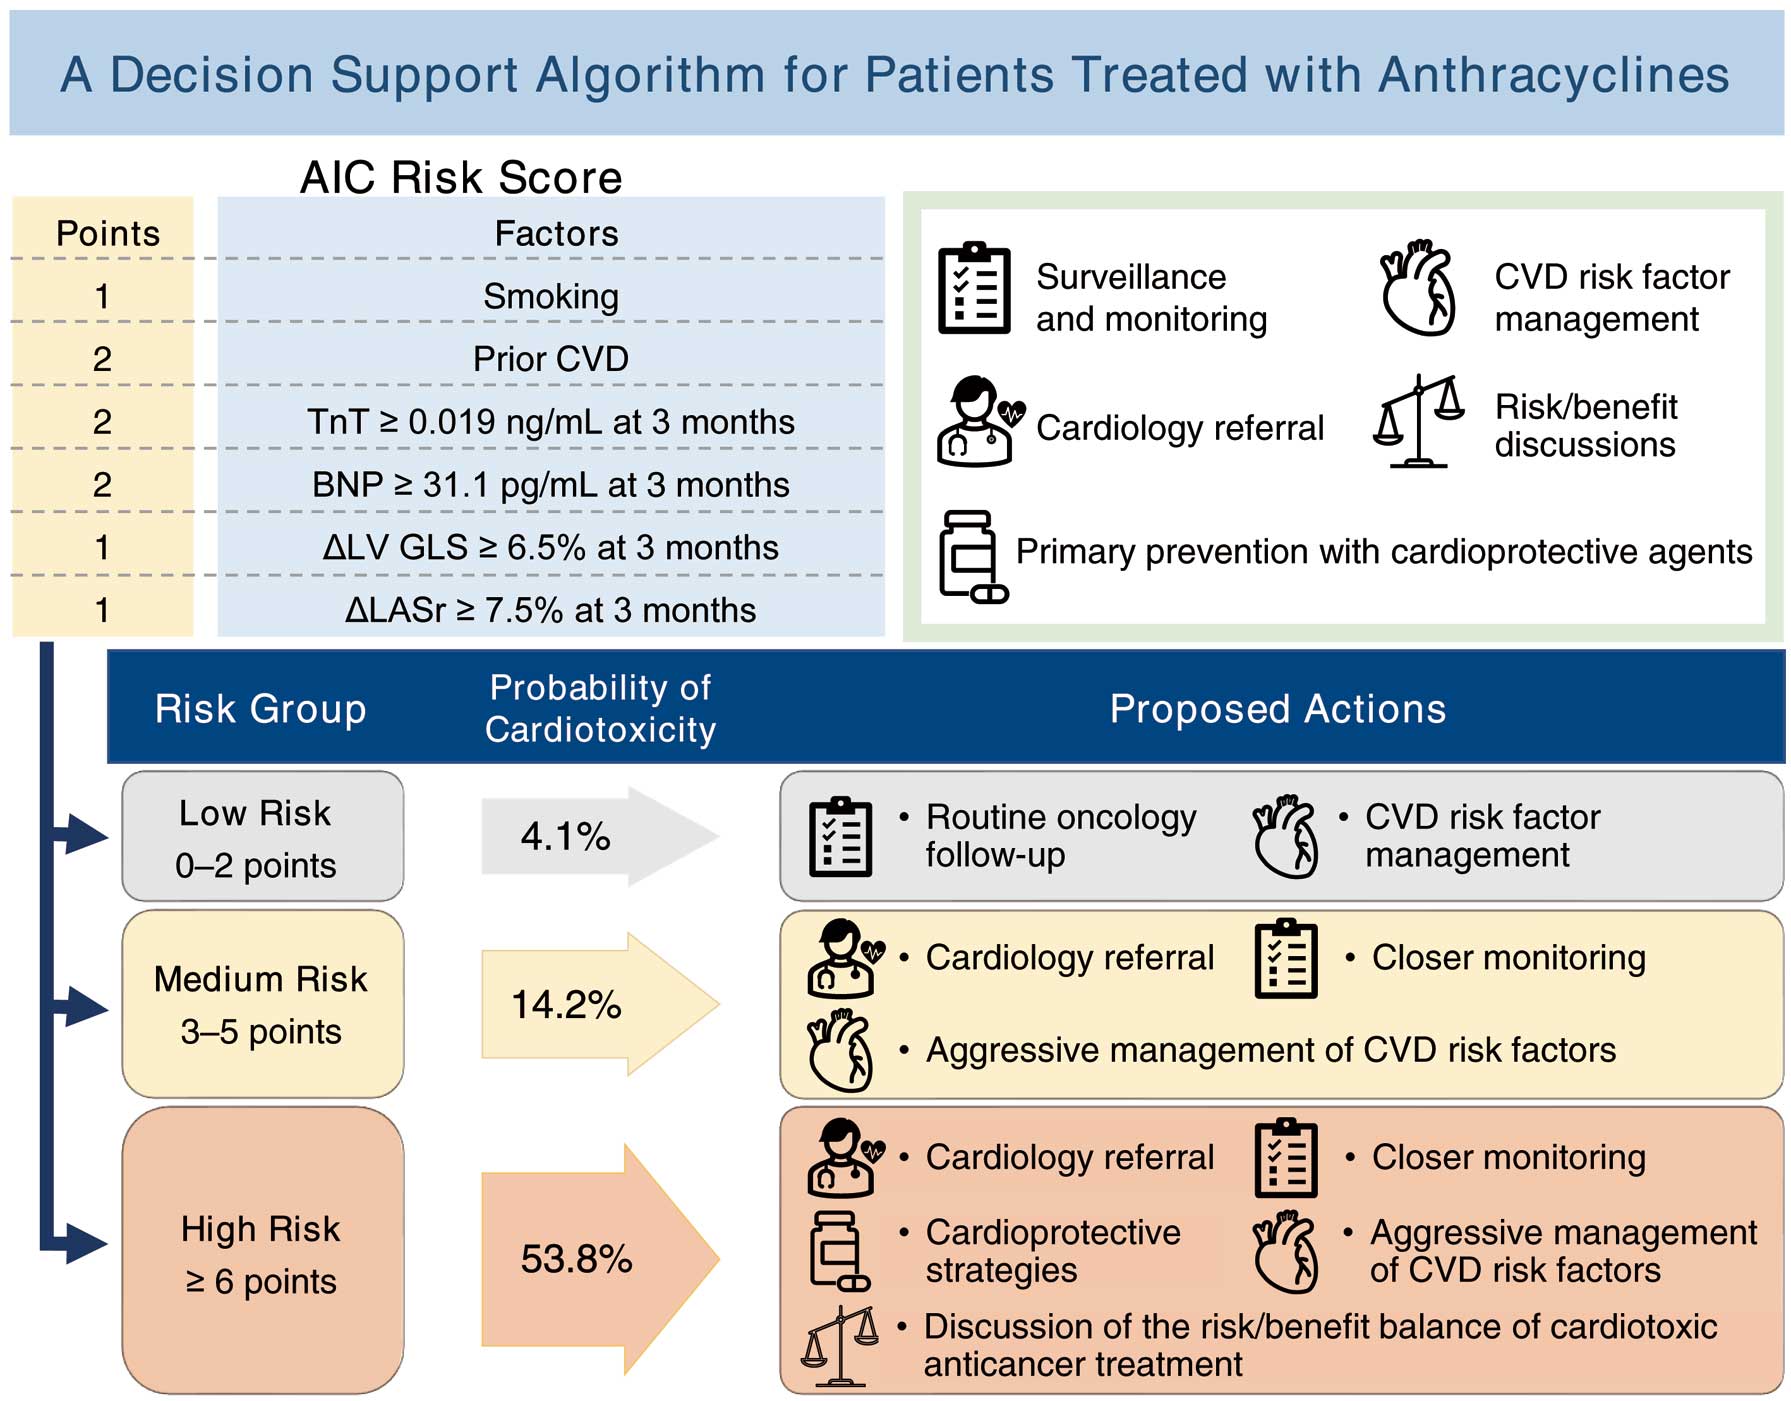
Patients with cancer treated with anthracyclines are at a high risk of cardiotoxicity, but currently there are no decision-making risk scores to help clinicians determine the patients at high risk for cardiotoxicity early after initiating anthracyclines. Our study had an integrated approach, using cardiac biomarkers and echocardiographically measured LV GLS and LASr as factors that can identify patients at high risk for cardiotoxicity. However, further studies are needed to validate our risk score. If validated, this risk score would allow selection of patients requiring more intensive monitoring and management in cancer treatment settings where resources for onco-cardiologic testing (echocardiography equipment, sonographers, and onco-cardiology specialists) are often scarce. In addition, although the JSMO and JOCS guidelines suggest measuring GLS in routine echocardiographic examinations of patients on cancer drug therapy,19 accurate prediction of the subsequent development of cardiotoxicity may increase by also measuring LASr at the same time. Figure 3 shows our proposed decision support algorithm for patients treated with anthracyclines. For low-risk patients, routine follow-up by an oncologist and general management of cardiovascular risk factors are recommended. As the incidence of cardiotoxicity in patients with a score of 0 was 0%, cessation of cardiac follow-up of such patients might be considered. For medium-risk patients, we recommend cardiology referral, more frequent cardiovascular monitoring, and aggressive management of cardiovascular risk factors. Patients with a high risk of cardiotoxicity should undergo close monitoring by a cardiologist, aggressive management of cardiovascular risk factors, primary prevention with cardioprotective agents, and long-term cardiovascular follow-up in an onco-cardiology program. As the ESC Cardio-oncology guideline highlights the importance of primary prevention of cardiotoxicity with cardioprotective drugs, especially angiotensin-converting enzyme inhibitors, angiotensin receptor blockers, and β-blockers,9 cardioprotective drugs should be actively considered in patients with a high AIC risk score. If the patient is subsequently destined to be treated with cardiotoxic anticancer drugs, discussion of the risk/benefit balance of cardiotoxic anticancer treatment under a multidisciplinary approach is recommended.
Study Limitations
We studied a cohort of patients with preserved LVEF at baseline, limiting the extrapolation of our results to patients with reduced LVEF. In addition, the study’s sample size was relatively small. Furthermore, long-term follow-up beyond 2 years after anthracycline administration was not performed. This cohort had many patients with breast cancer, resulting in a large female population. Sex was not a significant predictor of cardiotoxicity in the univariate analysis; however, it remains unclear whether this risk score applies to a male-dominated cohort. As we previously reported,29 a significant number of patients did not have images suitable for strain analysis due to left-sided mammotomy, breast reconstruction, obesity, or other reasons. The focus of this study was primarily on the occurrence of cardiotoxicity as defined by LVEF decline; thus, the absence of a comprehensive investigation into patient-reported outcomes represents a notable limitation. Future research endeavors may benefit from incorporating a more thorough examination of patient-reported outcomes to provide a more holistic understanding of the AIC. Furthermore, our analysis lacked external validation. External validation studies are required to examine the reproducibility of the AIC risk score and the extent of its generalizability to cohorts not eligible for the AIC registry.
Conclusions
Patients who developed cardiotoxicity had greater reductions in LASr and LASct 3 months after initiating anthracyclines, and a relative decline in LASr was independently associated with the future development of cardiotoxicity. The AIC risk score, which includes ∆LASr at 3 months ≥7.5% as a variable, showed relatively high predictive ability. External validation is needed, but our data suggest LASr is a useful index for predicting subsequent cardiotoxicity.
Acknowledgment
We thank Editage (www.editage.jp) for English language editing.
Disclosures
Shigeru Chiba received a research grant from Pfizer. The funder had no role in the study’s design, data collection, analyses, interpretation, manuscript writing, or decision to publish the results. The other authors declare no conflicts of interest.
Sources of Funding
This work was supported by grants from the Daiwa Securities Health Foundation and the National Cancer Center Research and Development Fund (2023-A-12).
IRB Information
The study was approved by the Institutional Review Board of the University of Tsukuba Hospital (reference number: H28-06).
Data Availability
The deidentified participant data will not be shared.
Supplementary Files
Please find supplementary file(s);
https://doi.org/10.1253/circj.CJ-24-0065
References
- 1.
Smith LA, Cornelius VR, Plummer CJ, Levitt G, Verrill M, Canney P, et al. Cardiotoxicity of anthracycline agents for the treatment of cancer: systematic review and meta-analysis of randomised controlled trials. BMC Cancer 2010; 10: 337, doi:10.1186/1471-2407-10-337.
- 2.
Cardinale D, Colombo A, Bacchiani G, Tedeschi I, Meroni CA, Veglia F, et al. Early detection of anthracycline cardiotoxicity and improvement with heart failure therapy. Circulation 2015; 131: 1981–1988, doi:10.1161/CIRCULATIONAHA.114.013777.
- 3.
Sawaya H, Sebag IA, Plana JC, Januzzi JL, Ky B, Tan TC, et al. Assessment of echocardiography and biomarkers for the extended prediction of cardiotoxicity in patients treated with anthracyclines, taxanes, and trastuzumab. Circ Cardiovasc Imaging 2012; 5: 596–603, doi:10.1161/CIRCIMAGING.112.973321.
- 4.
Kang Y, Xu X, Cheng L, Li L, Sun M, Chen H, et al. Two-dimensional speckle tracking echocardiography combined with high-sensitive cardiac troponin T in early detection and prediction of cardiotoxicity during epirubicine-based chemotherapy. Eur J Heart Fail 2014; 16: 300–308, doi:10.1002/ejhf.8.
- 5.
Santoro C, Arpino G, Esposito R, Lembo M, Paciolla I, Cardalesi C, et al. 2D and 3D strain for detection of subclinical anthracycline cardiotoxicity in breast cancer patients: A balance with feasibility. Eur Heart J Cardiovasc Imaging 2017; 18: 930–936, doi:10.1093/ehjci/jex033.
- 6.
Sawaya H, Sebag IA, Plana JC, Januzzi JL, Ky B, Cohen V, et al. Early detection and prediction of cardiotoxicity in chemotherapy-treated patients. Am J Cardiol 2011; 107: 1375–1380, doi:10.1016/j.amjcard.2011.01.006.
- 7.
Čelutkienė J, Pudil R, López-Fernández T, Grapsa J, Nihoyannopoulos P, Bergler-Klein J, et al. Role of cardiovascular imaging in cancer patients receiving cardiotoxic therapies: A Position Statement on behalf of the Heart Failure Association (HFA), the European Association of Cardiovascular Imaging (EACVI) and the Cardio-Oncology Council of the European Society of Cardiology (ESC). Eur J Heart Fail 2020; 22: 1504–1524, doi:10.1002/ejhf.1957.
- 8.
Pudil R, Mueller C, Čelutkienė J, Henriksen PA, Lenihan D, Dent S, et al. Role of serum biomarkers in cancer patients receiving cardiotoxic cancer therapies: A Position Statement from the Cardio-Oncology Study Group of the Heart Failure Association and the Cardio-Oncology Council of the European Society of Cardiology. Eur J Heart Fail 2020; 22: 1966–1983, doi:10.1002/ejhf.2017.
- 9.
Lyon AR, López-Fernánde T, Couch LS, Asteggiano R, Aznar MC, Bergler-Klei J, et al. 2022 ESC Guidelines on cardio-oncology developed in collaboration with the European Hematology Association (EHA), the European Society for Therapeutic Radiology and Oncology (ESTRO) and the International Cardio-Oncology Society (IC-OS). Eur Heart J 2022; 43: 4229–4361, doi:10.1093/eurheartj/ehac244.
- 10.
Emerson P, Deshmukh T, Stefani L, Mahendran S, Hogg M, Brown P, et al. Left atrial strain in cardiac surveillance of bone marrow transplant patients with prior anthracycline exposure. Int J Cardiol 2022; 354: 68–74, doi:10.1016/J.IJCARD.2022.02.024.
- 11.
Timóteo AT, Moura Branco L, Filipe F, Galrinho A, Rio P, Portugal G, et al. Cardiotoxicity in breast cancer treatment: What about left ventricular diastolic function and left atrial function? Echocardiography 2019; 36: 1806–1813, doi:10.1111/ECHO.14487.
- 12.
Laufer-Perl M, Arias O, Dorfman SS, Baruch G, Rothschild E, Beer G, et al. Left atrial strain changes in patients with breast cancer during anthracycline therapy. Int J Cardiol 2021; 330: 238–244, doi:10.1016/J.IJCARD.2021.02.013.
- 13.
Ferkh A, Clark A, Thomas L. Left atrial phasic function: Physiology, clinical assessment and prognostic value. Heart 2023; 109: 1661–1669, doi:10.1136/HEARTJNL-2022-321609.
- 14.
Inoue K, Iida N, Tajiri K, Bando H, Chiba S, Tasaka N, et al. Rationale, design, and feasibility of a prospective multicenter registry study of anthracycline-induced cardiotoxicity (AIC Registry). J Clin Med 2021; 10: 1370, doi:10.3390/JCM10071370.
- 15.
Lang RM, Badano LP, Victor MA, Afilalo J, Armstrong A, Ernande L, et al. Recommendations for cardiac chamber quantification by echocardiography in adults: An update from the American Society of Echocardiography and the European Association of Cardiovascular Imaging. J Am Soc Echocardiogr 2015; 28: 1–39.e14, doi:10.1016/j.echo.2014.10.003.
- 16.
Badano LP, Kolias TJ, Muraru D, Abraham TP, Aurigemma G, Edvardsen T, et al. Standardization of left atrial, right ventricular, and right atrial deformation imaging using two-dimensional speckle tracking echocardiography: A Consensus Document of the EACVI/ASE/Industry Task Force to standardize deformation imaging. Eur Heart J Cardiovasc Imaging 2018; 19: 591–600, doi:10.1093/EHJCI/JEY042.
- 17.
Voigt JU, Pedrizzetti G, Lysyansky P, Marwick TH, Houle H, Baumann R, et al. Definitions for a common standard for 2D speckle tracking echocardiography: Consensus Document of the EACVI/ASE/Industry Task Force to standardize deformation imaging. Eur Heart J Cardiovasc Imaging 2015; 16: 1–11, doi:10.1093/EHJCI/JEU184.
- 18.
Seidman A, Hudis C, Pierri MK, Shak S, Paton V, Ashby M, et al. Cardiac dysfunction in the trastuzumab clinical trials experience. J Clin Oncol 2002; 20: 1215–1221, doi:10.1200/JCO.2002.20.5.1215.
- 19.
The Japanese Society of Medical Oncology and the Japanese Onco-Cardiology Society. Onco-cardiology guideline 2023.
- 20.
Millsap RE, Maydeu-Olivares A. The SAGE handbook of quantitative methods in psychology. SAGE Publications, 2009.
- 21.
Graham JW, Olchowski AE, Gilreath TD. How many imputations are really needed? Some practical clarifications of multiple imputation theory. Prev Sci 2007; 8: 206–213, doi:10.1007/S11121-007-0070-9.
- 22.
Pedersen AB, Mikkelsen EM, Cronin-Fenton D, Kristensen NR, Pham TM, Pedersen L, et al. Missing data and multiple imputation in clinical epidemiological research. Clin Epidemiol 2017; 9: 157–166, doi:10.2147/CLEP.S129785.
- 23.
van Buuren S, Groothuis-Oudshoorn K. Mice: Multivariate imputation by chained equations in R. J Stat Software 2011; 45, doi:10.18637/jss.v045.i03.
- 24.
Gunda S, Padala SK, Saini A, Kang L, Ellenbogen KA, Koneru JN. Risk score model for predicting complications in patients undergoing ventricular tachycardia ablation: Insights from the National Inpatient Sample database. Europace 2019; 21: 475–483, doi:10.1093/EUROPACE/EUY213.
- 25.
Kanda Y. Investigation of the freely available easy-to-use software “EZR” for medical statistics. Bone Marrow Transplant 2013; 48: 452–458, doi:10.1038/bmt.2012.244.
- 26.
Chong EG, Lee EH, Sail R, Denham L, Nagaraj G, Hsueh CT. Anthracycline-induced cardiotoxicity: A case report and review of literature. World J Cardiol 2021; 13: 28–37, doi:10.4330/WJC.V13.I1.28.
- 27.
Thomas L, Marwick TH, Popescu BA, Donal E, Badano LP. Left atrial structure and function, and left ventricular diastolic dysfunction: JACC State-of-the-Art Review. J Am Coll Cardiol 2019; 73: 1961–1977, doi:10.1016/J.JACC.2019.01.059.
- 28.
Genovese D, Singh A, Volpato V, Kruse E, Weinert L, Yamat M, et al. Load dependency of left atrial strain in normal subjects. J Am Soc Echocardiogr 2018; 31: 1221–1228, doi:10.1016/J.ECHO.2018.07.016.
- 29.
Iida N, Tajiri K, Ishizu T, Sasamura-Koshizuka R, Nakajima H, Kawamatsu N, et al. Echocardiography image quality of global longitudinal strain in cardio-oncology: A prospective real-world investigation. J Echocardiogr 2022; 20: 159–165, doi:10.1007/S12574-022-00567-8.