Integrative Analysis of Lactylation-Associated Features in Abdominal Aortic Aneurysm and Its Immune Microenvironment Utilizing scRNA-seq and Bulk RNA Sequencing
Article ID: CJ-24-0892
Details
Article ID: CJ-24-0892
Background: Abdominal aortic aneurysm (AAA) is a vascular disease strongly associated with immune dysregulation and metabolic disturbances. Although lactate metabolism and its associated process, lactylation, have been implicated in various diseases, their specific role in AAA pathogenesis remains poorly understood.
Methods and Results: In this study, we used a multi-faceted approach, integrating single-cell and bulk RNA data analyses, with the objective of elucidating the interrelationship between lactylation and immune response in AAA patients. The result revealed significant heterogeneity in lactylation levels across different immune cell types. Cells with higher lactylation activity exhibited markedly elevated immune response scores. Differential expression and correlation analyses identified 65 lactylation-associated genes, which were further evaluated in the bulk RNA sequencing data to assess their relationship with the immune microenvironment in patients with AAA. Using 113 combinations of machine-learning algorithms, we identified 8 lactylation-related hub genes. The immune infiltration analysis demonstrated that these genes were linked to a multitude of immune cells. The animal experiments corroborated that Tnfsf8, Hist1 h2ag, Cd79b, Cd69, and Bank1 were upregulated in the AAA group, while Rpl36a and Rps29 were downregulated in the AAA group.
Conclusions: This study highlighted a potentially critical link between lactylation and immune dysregulation in AAA, thereby advancing our comprehension of the function of lactylation in AAA.
Abdominal aortic aneurysm (AAA) is a chronic disorder characterized by continuous enlargement of the abdominal aorta, typically defined as an aortic diameter ≥30 mm.1 When an AAA ruptures, the mortality rate exceeds 80%.2 Although most patients are asymptomatic in the early stages, AAA poses a significant threat due to the high risk of rupture.3,4 Epidemiological studies report that approximately 170,000 deaths worldwide are attributed to aortic aneurysms annually, with an age-standardized death rate of 2.19 per 100,000 individuals.5 Older adults and males are particularly susceptible. Currently, the primary treatment options for AAA are surgical intervention and endovascular repair,1,6–8 because no effective pharmacological therapies have been established. Therefore, understanding the underlying mechanisms driving AAA progression is of critical importance.
Recent evidence suggests that immune dysregulation plays a pivotal role in AAA pathogenesis. Immune cells contribute to apoptosis of aortic wall cells and promote the phenotypic transition of vascular smooth muscle cells through the release of various inflammatory cytokines.9,10 Moreover, these immune cells facilitate the degradation of the extracellular matrix by secreting proteases, ultimately leading to aortic dilation and rupture.10,11 Concurrent studies have revealed a close association between lactate metabolism and the immune microenvironment. Lactate, produced during glycolysis, can modulate immune cell function via multiple pathways, thereby reshaping the immune landscape.12,13 For example, during inflammatory activation, neutrophils in the bone marrow produce significant amounts of lactate, which enhances vascular permeability and promotes neutrophil migration to the inflamed tissues.13,14 In various inflammatory diseases, elevated glycolysis in immune cells results in rapid lactate accumulation at sites of inflammation. This accumulation, through the pyruvate kinase M2 (PKM2) and signal transducer and activator of transcription 3 (STAT3) pathways, induces the production of interleukin-17 (IL-17), facilitating T cell recruitment.15 Furthermore, the role of lactate metabolism in the tumor immune microenvironment is well documented. The Warburg effect, a hallmark of cancer metabolism, leads to increased glucose uptake and excessive lactate production by tumor cells, even under normoxic conditions. The lactate secreted into the extracellular space establishes a metabolic niche that supports tumor development and progression, playing a critical role in cancer pathology.16,17 These findings collectively highlight the significant interplay between lactate metabolism and immune dysregulation. Lactylation, a novel post-translational protein modification modality driven by lactic acid, was first found to transform proinflammatory M1 macrophages into anti-inflammatory M2 macrophages.18 In recent years, an increasing number of studies have confirmed that lactylation exerts a regulatory effect on the immune microenvironment.12,19–21 For instance, AARS2 has been demonstrated to facilitate congenital immune evasion by lactylation of cyclic GMP–AMP synthase (cGAS),22 and lactylation has been shown to induce an immunosuppressive function in tumor-infiltrating bone marrow cells via the METTL3-JAK1-STAT3 regulatory axis.23 However, despite this growing body of research, the specific role of lactate metabolism and lactylation in AAA remains poorly characterized, and comprehensive studies investigating the expression and function of lactylation-related genes in AAA are lacking.
In this study, we used a comprehensive analytical approach integrating scRNA-seq data, bulk RNA sequencing (RNA-seq), and animal experiments to identify the central genes associated with lactylation in AAA patients. Additionally, we conducted preliminary investigations into the relationship between the immune microenvironment of AAA and lactylation levels. Our expectation was that the study would provide insights into potential clinical targets for AAA and guide future investigations into its pathogenesis.
We used data obtained from the Gene Expression Omnibus (GEO) database (https://www.ncbi.nlm.nih.gov/geo/), comprising scRNA-seq and bulk RNA sequencing data related to AAA. The scRNA-seq data were sourced from GSE166676, which included 4 AAA samples and 2 control samples. The bulk RNA sequencing data were derived from multiple datasets: GSE269845 (4 AAA samples, 5 controls), GSE183464 (7 AAA samples, 7 controls), GSE57691 (49 AAA samples, 10 controls), GSE47472 (14 AAA samples, 8 controls), and GSE7084 (6 AAA samples, 7 controls). Based on previous studies,24,25 a series of lactylation-associated genes were selected for analysis, comprising 332 genes in total.
Single-Cell RNA Sequencing AnalysisThe scRNA-seq data were analyzed using the ‘Seurat’ R package. Quality control procedures included the following: (1) excision of genes expressed in <3 cells; (2) exclusion of cells with <200 or >2,500 total genes; and (3) elimination of cells with ≥25% of genes expressed in mitochondria. Following the quality control process, 8,350 cells were identified. The data were subsequently normalized, highly variable genes (HVGs) were identified, and principal component analysis (PCA) was performed, with data integration facilitated by the ‘harmony’ R package. Cell clusters were established using the ‘FindClusters’ and ‘FindNeighbors’ functions, and marker genes for each cluster were identified using the ‘FindAllMarkers’ function, as shown in the Supplementary Files. Annotation of cells was performed on the basis of marker genes and the ACT database (http://xteam.xbio.top/ACT/).26 Visualization was achieved through Uniform Manifold Approximation and Projection (UMAP) algorithms.
Assessment of Lactylation LevelsLactylation activity in the single-cell dataset was evaluated using the irGSEA algorithm (https://github.com/chuiqin/irGSEA) in conjunction with 10 different methods, including AUCEll, singscore, ssgsea, UCell, JASMINE, viper, AddModuleScore, scSE, zscore, and GSVA. The cells were classified into 2 distinct groups, namely high and low lactylation activity groups, according to the median values of the aforementioned scores. Differential expression genes (DEGs) were identified between the high and low lactylation groups using the ‘FindMarkers’ function, resulting in 389 upregulated genes selected for further analysis. Additionally, correlation analyses were conducted to determine genes significantly associated with lactylation activity. Subsequent analyses were performed based on shared gene results from correlation and DEGs identification. For the bulk RNA sequencing data, we calculated the lactylation score using the GSVA algorithm.
Animal ExperimentsWe sourced 8-week-old male C57BL/6 background Apoe−/− mice from Guangdong Yaokang Biotechnology Co., Ltd., and maintained them in a dedicated pathogen-free facility at 25℃ with a 12-h light/dark cycle. A randomized design was used for blind sampling. To establish the AAA mouse model, a mini pump (Alzet, model 2004) was implanted subcutaneously in Apoe−/− mice to administer Ang II (1,000 ng/kg/min) for 4 weeks. At the end of the experiment, the mice were euthanased, and vascular tissues were collected.
As demonstrated in earlier research, heightened glycolysis within the aortic wall represents a pivotal factor in the genesis of abdominal aneurysms,27 with the potential to culminate in augmented lactate production and lactylation. To validate this hypothesis, we conducted a comparative analysis of lactylation levels in samples of the abdominal aorta extracted from mice with induced AAA. The results indicated that the AAA group had a marked increase in overall lactylation levels when compared with the control group (Figure 1A). In order to elucidate the potential involvement of lactylation in AAA, we reanalyzed a previously published scRNA-seq dataset (GSE166676), consisting of 2 normal and 4 AAA samples. After stringent quality control, 8,350 cells and 19,823 unique genes were retained for analysis. Unsupervised clustering (based on PCA-reduced data) identified 20 distinct cell clusters, which were visualized via UMAP and classified into B cells, T cells, natural killer (NK) cells, smooth muscle cells, fibroblasts, stem cells, macrophages, and endothelial cells (Figure 1B,C).The expression patterns of characteristic marker genes for each cell type are shown in Figure 1D,E, indicating that these markers were effective in distinguishing the various cell subpopulations.

Analysis of lactylation-related features in AAA using scRNA-seq data. (A) Western blotting analysis of lactylation levels in AAA group and control group. (B) UMAP plot illustrates the comprehensive annotation of eight distinct cell types, with each color representing a specific cell type. (C) The cell counts and percentages of various cell types across different samples. (D,E) Violin plot and heatmap displaying marker gene expression across cell types. (F,G) Stacked violin plot and bubble plot revealing lactylation scores for different cell types. (H) UMAP representation of lactylation scores, differentiating between high and low lactylation groups based on median values. (I) Cell counts and percentages for each cell type in high and low lactylation groups. AAA, abdominal aortic aneurysm; UMAP, Uniform Manifold Approximation and Projection.
To systematically evaluate lactylation activity in the AAA samples, we computed the lactylation scores using 10 distinct single-cell scoring methods, revealing significant heterogeneity across cell populations. Specifically, smooth muscle cells, NK cells, and B cells exhibited elevated lactylation activity, while endothelial cells, stem cells, T cells, macrophages, and fibroblasts demonstrated comparatively lower activity (Figure 1F,G). On the basis of the median lactylation score, cells were subsequently stratified into high and low lactylation activity groups (Figure 1H,I).
Functional Analysis of Lactylation in scRNA-seq DataTo explore the functional consequences of lactylation within the context of AAA, we used single-sample gene set enrichment analysis (ssGSEA) to quantify the immune response scores at the single-cell level, and assessed the correlation between lactylation scores and immune response across all immune cells. The results indicated that the immune cells in the high lactylation group exhibited elevated immune response scores (Figure 2A). Concurrently, the degree of lactylation in all immune cells was found to positively correlate with immune response scores (Figure 2B). Given that immune dysregulation plays a pivotal role in AAA progression, this finding supported the hypothesis that lactylation has a role in disease pathology. To further investigate the functional implications of lactylation, we conducted GSVA to compare pathway activity between the high and low lactylation groups. The analysis identified significant associations between lactylation and several key signaling pathways, including Kras signaling, Hedgehog signaling, MYC targets, the G2M checkpoint, E2F targets, and DNA repair pathways (Figure 2C).

Functional analysis of lactylation in scRNA-seq data. (A) Violin plot depicting differences in immune response scores between high and low lactylation groups across various cell types. (B) Correlation between lactylation scores and immune response scores in different cell types. (C) GSVA bar plot highlighting differential signaling pathways between high and low lactylation groups, sorted by t-value. (D) Interaction network, where dot sizes represent cell quantities and line thickness indicates the frequency of cell interactions. (E,F) Bar graph illustrating the number of interactions between immune cells and other cell types in high and low lactylation groups. Statistical significance: ****P<0.0001. AAA, abdominal aortic aneurysm.
Furthermore, we utilized the CellChat algorithm to assess intercellular communication among different cell types, revealing extensive signaling interactions across 8 major cell types (Figure 2D). A detailed analysis of immune cells showed that, with the exception of macrophages, cells in the high lactylation group conveyed more signals to other cells compared with those in the low lactylation group (Figure 2E). Notably, immune cells in the high lactylation group received more signals from other cell types than those in the low lactylation group (Figure 2F).
Identification of LactylationRelated Genes (LRGs) in AAATo delineate genes that were predominantly reflective of lactylation, we performed correlation and differential analysis of the scRNA-seq data. Correlation analysis identified 595 genes that were significantly associated with lactylation levels (Figure 3A); 386 genes were upregulated in the high lactylation group compared with the low lactylation group (Figure 3B). By intersecting these 595 genes with the 386 DEGs, we identified 65 LRGs (Figure 3C).

Identification of lactylation-related genes (LRGs) in AAA. (A) Correlation analysis of lactylation scores with genes, presenting the top 100 correlated genes based on the correlation coefficient (r). (B) Differential gene analysis results for high and low lactylation groups. (C) Venn diagram depicting the intersection of correlated genes and differentially expressed genes. (D) Chord diagram illustrating the KEGG pathway enrichment results for lactylation-related genes. Functional enrichment analysis (GO analysis) highlighting molecular functions (E), cellular components (F), and biological processes (G) associated with lactylation-related genes. AAA, abdominal aortic aneurysm.
To further elucidate the biological roles of these 65 LRGs, we performed KEGG pathway and GO analyses. KEGG analysis revealed that these genes were predominantly enriched in pathways such as “Primary immunodeficiency”, “B cell receptor signaling pathway”, “Alcoholism”, “Intestinal immune network for IgA production” and “Systemic lupus erythematosus” (Figure 3D). In terms of molecular function (MF), the genes were significantly associated with “signaling receptor activity” and “double-stranded DNA binding” (Figure 3E). For cellular component (CC), there were strong associations with “side of membrane” and “cell surface” (Figure 3F). In the biological process (BP) category, the genes were predominantly enriched in terms such as “immune system process” and “immune response” (Figure 3G), highlighting their potential involvement in immune regulation.
Subtype Analysis of AAA Based on Lactylation-Related GenesTo further explore the relationship between lactylation and the immune microenvironment in AAA patients, we used the expression profiles of the 65 lactylation-related genes to classify the 49 AAA samples from the GSE57691 dataset using the ConsensusClusterPlus algorithm. This analysis stratified the samples into 2 subgroups: C1 (n=23) and C2 (n=26) (Figure 4A). PCA confirmed that unsupervised clustering effectively distinguished the 2 subgroups (Figure 4B). Subsequent analysis using the GSVA algorithm revealed that lactylation scores were significantly higher in the C2 subgroup compared with the C1 subgroup (Figure 4C), suggesting that the expression profile of lactation-related genes may serve as a potential tool for differentiating lactylation levels in patients with AAA. Moreover, immune response quantification showed that the C2 subgroup had significantly higher immune scores than the C1 subgroup (Figure 4D), indicating distinct immune response patterns between the subtypes. A positive correlation was also discerned between lactylation scores and immune response scores (Figure 4E). In order to validate our findings in the single-cell data analysis, we used the CIBERSORTX package for deconvolution analysis. The results demonstrated that AAA patients in the C2 group exhibited higher levels of T and B cells, in addition to reduced levels of stem cells and smooth muscle cells (Figure 4F,G). Given the association between lactylation and inflammatory responses, we performed immune infiltration analyses to compare immune cell profiles between the 2 subgroups. As shown in Figure 4H,I, the C1 subgroup demonstrated higher proportions of eosinophils, monocytes, Tregs, and activated mast cells, while the C2 subgroup displayed increased levels of M1 macrophages, resting mast cells, CD4 memory resting T cells, gamma delta T cells, activated CD4 memory T cells, naïve B cells, plasma cells, and memory B cells. These findings indicate that the 2 subgroups had distinct immune cell compositions.

Subtype analysis of AAA based on lactylation-related genes. (A) Consistency clustering matrix at k=2. (B) Venn diagram visualizing the distribution of the two clusters. (C,D) Boxplots showing differences in lactylation scores and immune response scores between the two clusters. (E) Correlation between lactylation scores and immune response scores in AAA patients. (F,G) CIBERSORTX deconvolution analysis shows the relative abundance and differences of different cell types between the two clusters. (H) Relative abundance of 23 immune cell types between the two clusters. (I) Boxplots illustrating differences in immune cell populations between the two clusters. (J) Heatmap displaying the expression of immune regulatory molecules between the two distinct subgroups. Statistical significance: ****P<0.0001. AAA, abdominal aortic aneurysm.
Additionally, differential expression patterns of various immune regulatory genes further supported the distinctions in the immune microenvironment between the C1 and C2 subgroups (Figure 4J). These results suggested that lactylation potentially plays a role in the remodeling of the immune microenvironment in patients with AAA, further confirming the findings at the single-cell level.
Machine Learning Exploration of Lactylation Hub GenesTo further identify characteristic lactylation regulatory factors associated with AAA, we fitted the 65 lactylation-related genes discovered in the single-cell dataset into a machine learning-based integrative model. We conducted 10-fold cross-validation across 113 predictive models from the GSE57691 dataset, calculating the area under the receiver operating characteristic curve (AUC) values for each model across all validation datasets, including GSE269845, GSE47472, GSE7084, and GSE183464. Notably, the combination of glmboost and NaiveBayes was found to be the best model, achieving the highest mean AUC value of 0.903 (Figure 5A). This combined model also demonstrated consistently high AUC values across all validation datasets.

Machine-learning exploration of lactylation hub genes. (A) Evaluation of 113 predictive models through a 10-fold cross-validation framework, calculating AUC values for each model across all validation datasets. (B) The final eight lactylation hub genes identified in the glmboost model. (C–J) ROC curves illustrating the performance of the eight lactylation hub genes in predicting AAA occurrence across five representative validation datasets. AAA, abdominal aortic aneurysm.
Utilizing the 65 lactylation-related genes, the glmboost algorithm identified 8 critical lactylation hub genes (Figure 5B). Subsequently, we assessed the diagnostic value of these genes using receiver-operating characteristic curves (Figure 5C–J). The curves displayed for the hub genes across 5 datasets indicated that TNFSF8, CD69, RPL17, BANK1, HIST1H2AG, and RPL36A each achieved an average AUC >0.7, suggesting that these lactylation hub genes possess reasonable discriminatory capability between AAA patients and healthy individuals.
Validation of Lactylation Hub Gene Expression Patterns and Functional AnalysisTo gain further insight into the distribution of these lactylation hub genes within the immune microenvironment of AAA, we conducted a re-analysis of the scRNA-seq data. The results indicated that BANK1 and CD79B were predominantly expressed in B cells, while RPL17, CD69, RPL36A, and RPS29 were primarily expressed in B cells, T cells, and NK cells. Additionally, TNFSF8 and HIST1H2AG exhibited low-level expression across all cell clusters (Figure 6A,B).

Validation of lactylation hub gene expression patterns and functional analysis. (A) UMAP plot displaying the expression patterns of lactylation-related genes across different cell types based on single-cell RNA sequencing. (B) Violin plot displaying lactylation hub genes expression across cell types. (C–J) GSEA analysis of KEGG pathways based on the correlation results of lactylation hub genes. AAA, abdominal aortic aneurysm.
To further explore the functional implications of the hub genes, we conducted correlation analyses between the 8 hub genes and all other genes, followed by GSEA based on the correlation results. The expression of TNFSF8 positively correlated with pathways such as ‘Hematopoietic cell lineage’, ‘Viral protein interaction with cytokine and cytokine receptor’ and ‘Intestinal immune network for IgA production’ (Figure 6C). In contrast, HIST1H2AG expression showed negative correlations with pathways including ‘Protein export’, ‘Proteasome’ and ‘Ribosome’ (Figure 6D). CD79B demonstrated positive correlations with pathways such as ‘Allograft rejection’, ‘Intestinal immune network for IgA production’ and ‘Primary immunodeficiency’ (Figure 6E). CD69 was positively associated with ‘Spliceosome’, ‘NF-κB signaling pathway’ and ‘RNA degradation’ (Figure 6F). BANK1 expression positively correlated with the ‘B cell receptor signaling pathway’ and ‘Oxidative phosphorylation’ (Figure 6G). RPL17 expression was positively associated with ‘Ribosome’, ‘Oxidative phosphorylation’ and ‘Spliceosome’ (Figure 6H). Conversely, RPL36A showed negative correlations with pathways such as ‘Mitophagy’, ‘Nucleocytoplasmic transport’ and ‘Protein export’ (Figure 6I). On the other hand, RPS29 exhibited positive correlations with ‘Ribosome’, ‘Spliceosome’ and ‘Oxidative phosphorylation’ (Figure 6J).
Relationship Between Lactylation Hub Genes and Immune Microenvironment in AAATo further explore the relationship between the lactylation hub genes and immune characteristics in patients with AAA, we calculated the correlations between the hub genes and immune response scores, as well as immune-infiltrating cells in AAA patients. The correlation analysis indicated that 7 hub genes were significantly associated with the immune response in AAA patients (Figure 7A). Specifically, TNFSF8, CD69, BANK1, RPL17, and CD79B showed positive correlations with immune responses, while HIST1H2AG and RPL36A exhibited negative correlations. RPS29 did not demonstrate a significant correlation.
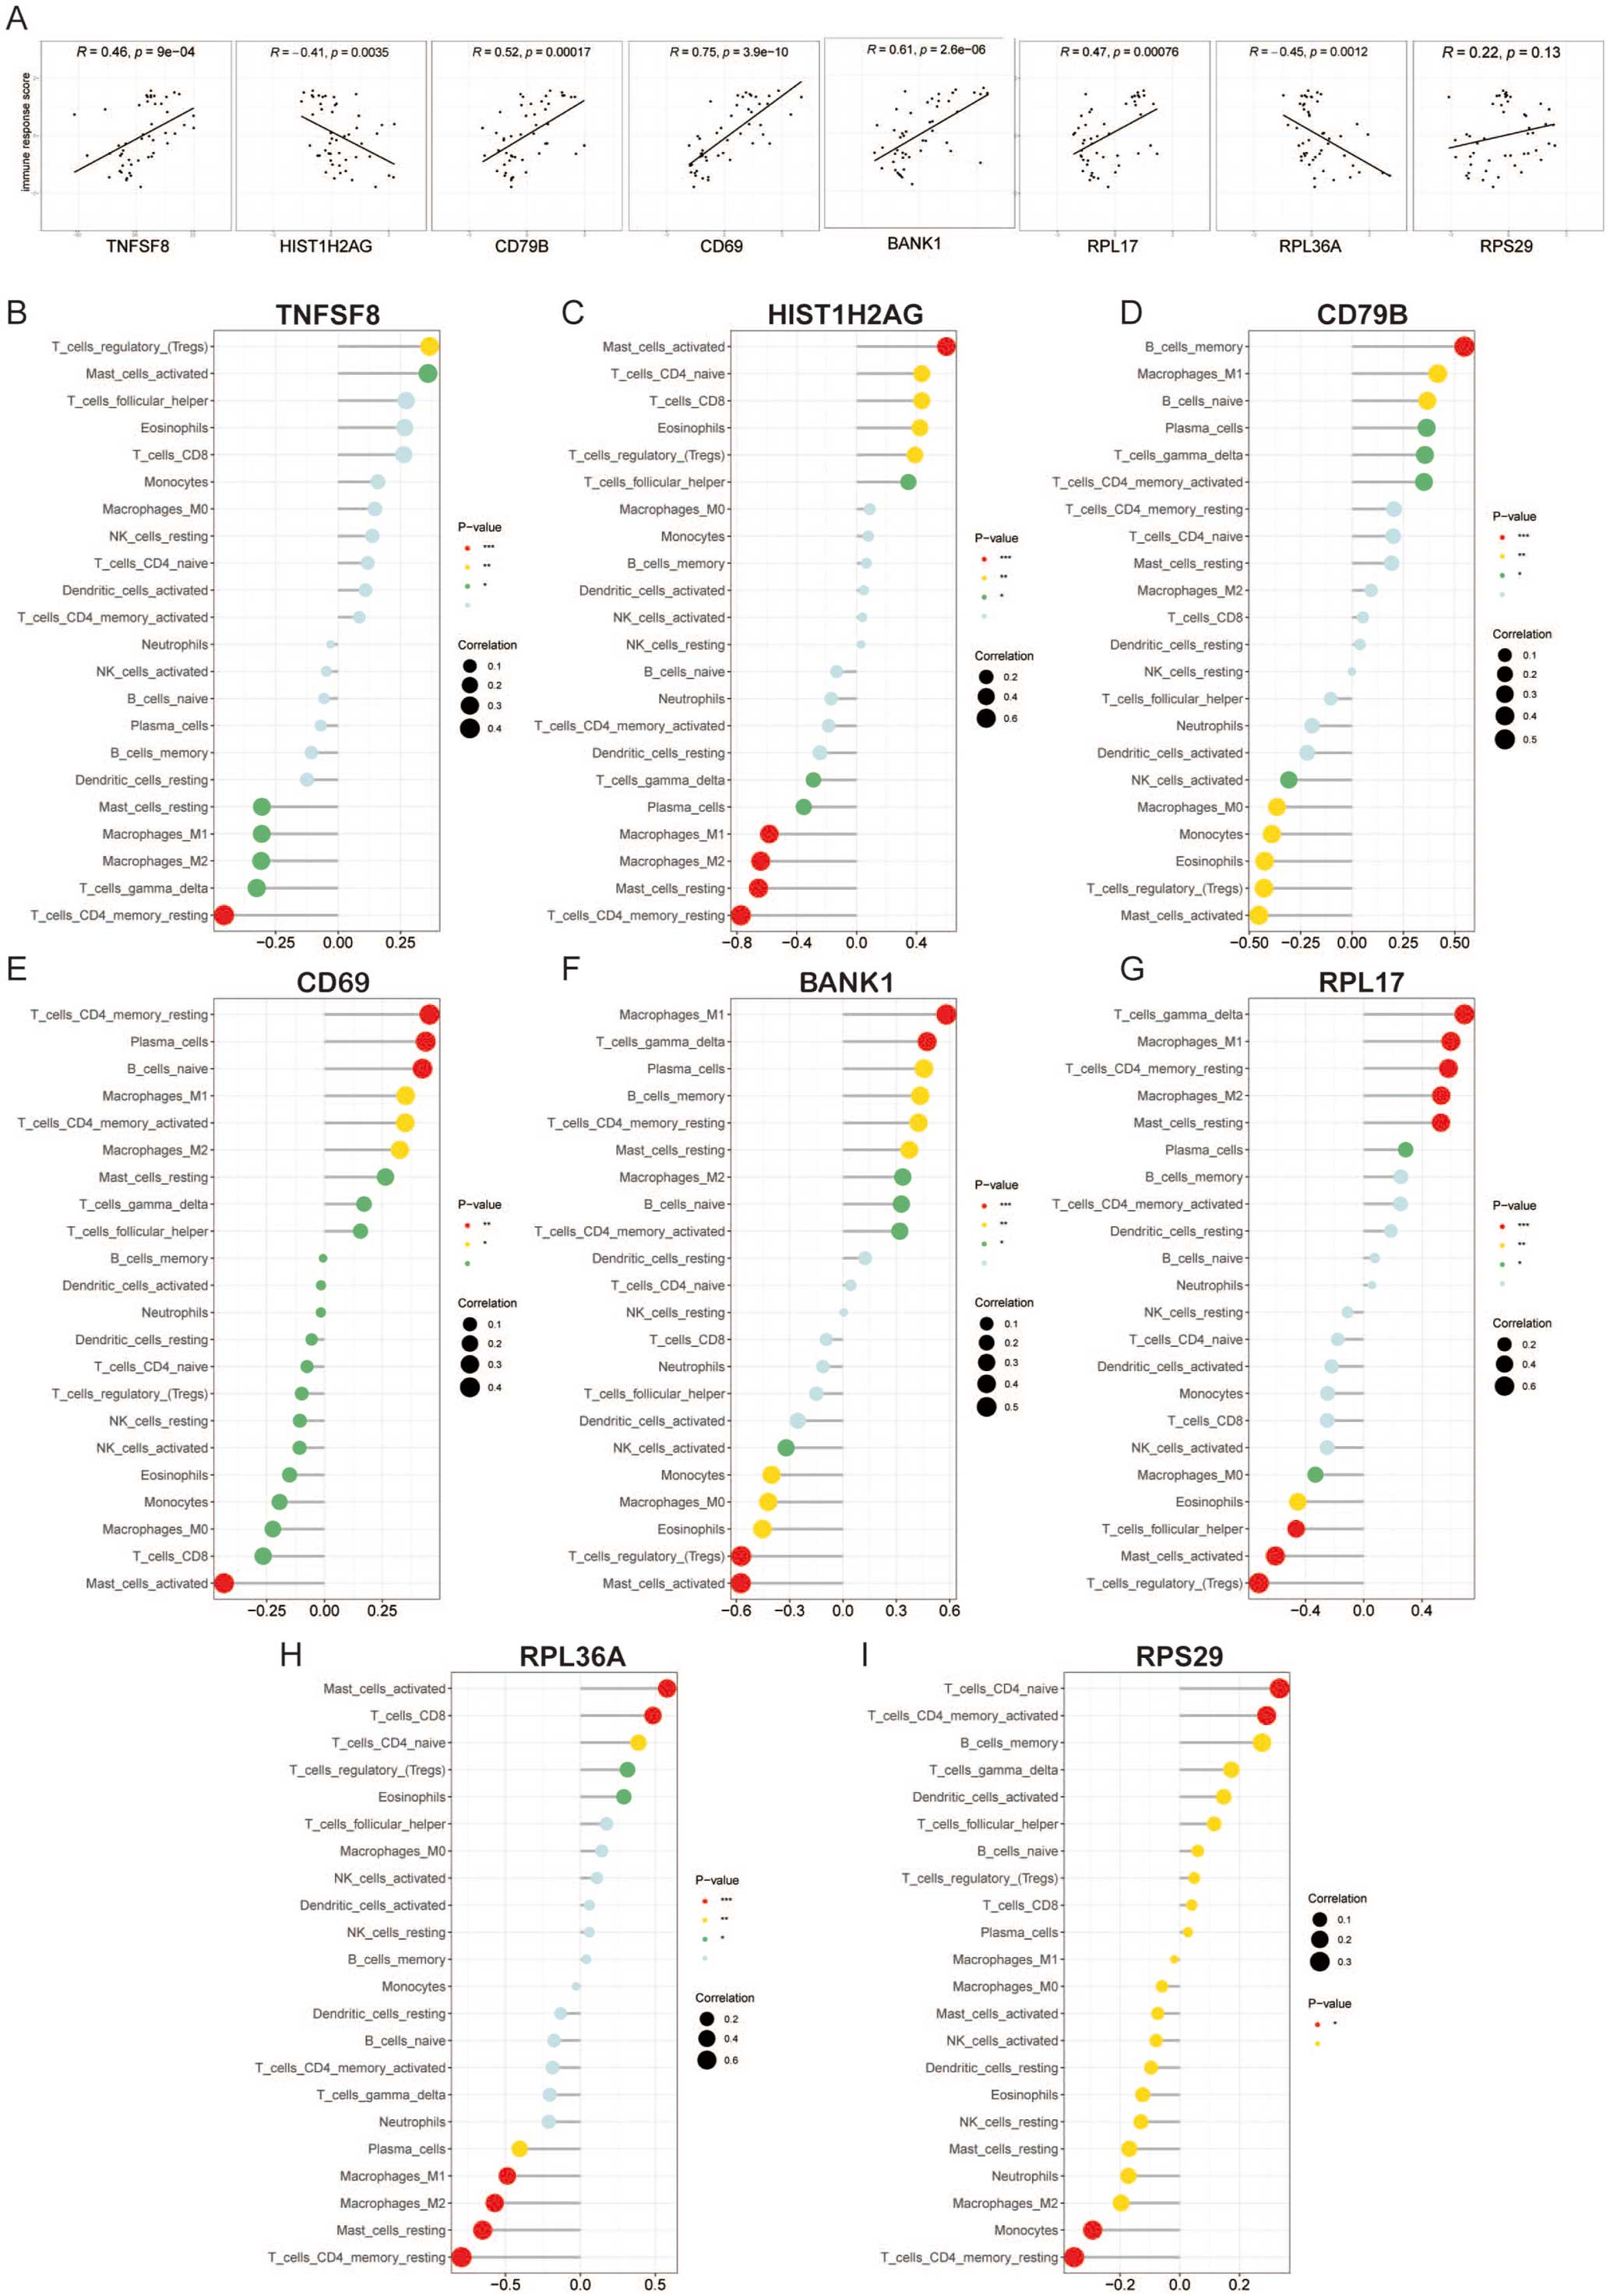
Relationship between lactylation hub genes and immune microenvironment in AAA. (A) Correlation between lactylation hub genes and immune response scores in AAA patients. (B–I) Correlation analysis between lactylation hub genes and immune cells in AAA patients. AAA, abdominal aortic aneurysm.
Immune infiltration analysis indicated that TNFSF8 negatively correlated with ‘memory resting CD4 T cells’, ‘gamma delta T cells’, ‘resting mast cells’, ‘M1 macrophages’ and ‘M2 macrophages’, while positively correlating with ‘Treg cells’ and ‘activated mast cells’ (Figure 7B). HIST1H2AG showed negative correlations with ‘memory resting CD4 T cells’, ‘resting mast cells’, ‘M2 macrophages’ and ‘M1 macrophages’ ,while positively correlating with ‘follicular helper T cell’, ‘Treg cells’ ,‘eosinophils’,‘CD8 T cells’, ‘naïve CD4 T cells’ and ‘activated mast cells’ (Figure 7C). CD79B demonstrated a negative correlation with ‘activated mast cells’, ‘Treg cells’, ‘eosinophils’, ‘monocytes’, ‘M0 macrophages’, ‘activated NK cells’ and a positive correlation with ‘memory resting CD4 T cells’, ‘plasma cells’, ‘naïve B cells’, ‘M1 macrophages’ and ‘memory B cells’ (Figure 7D). CD69 exhibited a negative correlation with ‘activated mast cells’ and a positive correlation with ‘memory resting CD4 T cells’, ‘plasma cells’, ‘naïve B cells’, ‘M1 macrophages’, ‘memory activated CD4 T cells’ and ‘M2 macrophages’ (Figure 7E). BANK1 was negatively associated with ‘activated NK cells’, ‘monocytes’, ‘M0 macrophages’, ‘eosinophils’, ‘Treg cells’ and ‘activated mast cells’ while positively correlating with ‘M1 macrophages’, ‘gamma delta T cells’, ‘plasma cells’, ‘memory B cells’, ‘memory resting CD4 T cells’, ‘resting mast cells’ ‘M2 macrophages’, ‘naïve B cells’ and ‘activated memory CD4 T cells’ (Figure 7F). Additionally, RPL17 showed significant correlations with 11 of 22 immune cell types (Figure 7G), RPL36A correlated with 10 of 22 immune cell types (Figure 7H), while RPS29 was correlated with only 4 immune cell types (Figure 7I).
Validation of Lactylation Hub Gene Expression in Animal ModelTo validate the significance of these central genes, we established an AAA animal model for the purpose of evaluating the expression levels of these characteristic genes. Representative photographs of aortic specimens from 2 groups of mice are shown in Figure 8A. The abdominal aortic diameter was observed to increase significantly in Apoe−/− mice following angiotensin II perfusion (Figure 8B), which suggested that the AAA modeling process was successfully completed. Subsequently, aortic tissue was harvested from mice for quantitative real-time polymerase chain reaction analysis. The results demonstrated that the expression levels of Tnfsf8, Hist1 h2ag, Cd79b, Cd69, and Bank1 in the AAA group were significantly higher than those in the control group (Figure 8C–G). Notably, under our experimental conditions, the expression level of Rpl17 did not show a significant difference between the AAA and control groups (Figure 8H). Conversely, the expression levels of Rpl36a and Rps29 in the AAA group were significantly lower than those in the control group (Figure 8I,J).

Validation of lactylation hub gene expression in animal models. (A) Representative photographs of the abdominal aortic specimens in Apoe−/− mice receiving saline and AngII treatment. (B) The abdominal aortic diameters in Apoe−/− mice receiving saline and AngII treatment. (C–J) qPCR analysis demonstrated differences in the expression of lactylation hub genes between the AAA and control groups. Statistical significance: *P<0.05, **P<0.01, ***P<0.001, ****P<0.0001. AAA, abdominal aortic aneurysm. qPCR, quantitative polymerase chain reaction.
AAA is a complicated vascular disease marked by the focal enlargement of the abdominal aorta, often leading to life-threatening complications such as rupture if left untreated.10 Current research highlights the critical role of the immune microenvironment in AAA, with monocytes and other immune cells, including T lymphocytes, B cells, macrophages, and NK cells, being prominently infiltrated in the vascular adventitia and media during disease progression.28 Although metabolic reprogramming and gut microbiota-derived metabolites have been implicated in AAA pathophysiology,29–31 the specific effect of lactate and its associated metabolic alterations on immune responses in AAA remains underexplored. Clinical studies have demonstrated that elevated postoperative serum lactate levels are predictive of death following AAA repair,32 underscoring the potential significance of lactylation as a modifiable therapeutic target.
In this study, we conducted a comprehensive scRNA-seq analysis of AAA patient samples and discovered a significant correlation between intracellular lactylation levels and immune dysregulation. Our findings revealed that lactylation levels were markedly elevated in B cells and NK cells compared with T cells and macrophages, suggesting cell type-specific variations in lactylation activity. We identified 65 LRGs that effectively distinguished AAA patients with high vs. low lactylation activity. Among these, we identified 8 key lactylation hub genes: TNFSF8, HIST1H2AG, CD79B, CD69, BANK1, RPL17, RPL36A and RPS29.
Prospects for Therapeutic InterventionIn conclusion, this study conducted a systematic examination of lactylation in AAA patients, leveraging scRNA-seq data to explore the relationship between lactylation and immune responses. By integrating multiple omics datasets, we offer a detailed perspective on lactylation within the context of AAA, revealing insights into the complex molecular landscape shaped by this post-translational modification. Our key contribution lies in identifying 65 LRGs and uncovering their associations with immune regulation in AAA. This catalog of LRGs serves as a valuable resource for researchers and clinicians, offering new avenues for investigating the molecular mechanisms of lactylation and identifying potential therapeutic targets. Overall, this study not only expands our understanding of lactylation in the pathogenesis of AAA, but also lays the foundation for future research that could lead to advancements in both basic science and clinical applications. By highlighting the importance of lactylation in immune regulation, we open new possibilities for therapeutic interventions aimed at modulating lactylation to improve outcomes in AAA patients.
Study LimitationsThis study has several limitations. Despite our findings indicating a potential correlation between lactylation levels in patients with AAA and immune dysregulation, no interventions were made to manipulate lactylation levels in vivo or in vitro to confirm the causal relationship between lactylation and immune dysregulation in AAA patients. Further research is required to ascertain the relationship between lactylation levels and immune dysfunction in patients with AAA. Although integrated multi-omics analysis successfully pinpointed lactylation-associated hub genes in this study, the validation of these candidates remains circumscribed to preclinical animal models. As a result, the relevance of these findings in human subjects remains to be fully established. Additionally, we did not explore the underlying molecular mechanisms or signaling pathways that mediate the effects of lactylation in AAA. The absence of mechanistic insights limits our ability to draw definitive conclusions about how lactylation influences AAA pathogenesis. Furthermore, we were unable to account for other potential factors, such as metabolic or environmental influences, that may regulate lactylation levels in AAA patients. Future research should address these gaps by investigating the mechanisms underlying lactylation in AAA and exploring its potential as a therapeutic target in clinical settings. It is important to note that, due to the varying data types from disparate sources, deviation may emerge following integrated analysis. Such deviations may be attributable to differences in sample size, sample processing and detection methods, and gene profiles covered. Consequently, further experimentation is required in the future to verify our findings in bioinformatics.
This study was an in-depth exploration of the potential links between lactylation and the immune microenvironment in AAA at the single-cell level. By integrating gene sets with large-scale RNA sequencing data, we were able to apply machine-learning algorithms to identify 8 characteristic genes. The dysregulation patterns of these genes provided novel mechanistic insights into lactylation-mediated pathways in AAA pathogenesis, establishing a framework for further investigation of epigenetic-metabolic crosstalk in vascular remodeling. This research lays the groundwork for further exploration of the molecular mechanisms underlying AAA and its clinical applications.
This project was supported by grants from the NSFC (U23A20397, 82271609), the Natural Science Foundation of Guangdong Province (2023B1515120088), the Science and Technology Program of Guangzhou City (2023B01J1011) and the SYSU 5010 Clinical Project (SJB-SQ-2022058) to Y.C.; the Science and Technology Program of Guangzhou City (2023A04J2077) to Y.Y.
All the authors declare that they have no competing interests.
J.L., Z.H., and Y.C. designed the research. J.L., Z.H., and Y.Y. performed the experiments. J.L., Z.H., and J.H. analyzed the data. J.L., and Z.H., J.H. drafted the manuscript. Y.C. revised the manuscript. J.L., Z.H., J.H., and Y.C. determined the final version of the manuscript. All authors approved the final manuscript.
The study was approved by the Ethical and Welfare Committee of Sun Yat-sen Memorial Hospital, protocol number AP20230120. The study adhered to the guidelines for the care and use of laboratory animals set by the committee.
The datasets used and/or analyzed during the current study are available from the corresponding authors upon reasonable request.
Please find supplementary file(s);
https://doi.org/10.1253/circj.CJ-24-0892