Abstract
Background: Preoperative risk assessment is very important to ensure surgical safety and predict postoperative complications. However, no large-scale studies have evaluated the risk of perioperative cardiovascular events in Japan. This study evaluated perioperative cardiovascular events using real-world data. In addition, the applicability of machine learning to risk stratification was examined to develop a predictive model for perioperative cardiovascular events.
Methods and Results: This was an observational cohort study using the Japan Medical Data Center database, which includes claim and health examination data in Japan, between January 2005 and April 2021. In all, 133,634 gastrointestinal surgeries were included in the analysis. The primary outcome was 30-day risk of major adverse cardiovascular events (MACE). The 30-day MACE incidence rate following surgery was 3.8%. Machine learning was used to perform a binary classification task to predict MACE occurrence within 30 days after surgery. A clustering algorithm was developed based on the Shapley additive explanation values obtained from training data, and generalizability was evaluated using test data. Of the variables, age, history of ischemic heart disease or heart failure, history of stroke, diabetes, hypertension, atrial fibrillation, cases of malignancy, and pancreatic biliary surgery were identified as factors associated with MACE occurrence.
Conclusions: A machine learning model built from basic clinical information, comorbidities, and surgical information demonstrated the capacity to stratify MACE risk in patients undergoing gastrointestinal surgery.
Preoperative risk assessment is very important to ensure surgical safety and predict postoperative complications. A recent cohort study reported that approximately 3.0% of non-cardiac surgery patients experienced a major cardiac or cerebrovascular complication in the perioperative period.1 Perioperative complications are determined by the prevalence of comorbidities, the clinical condition of patients, the invasiveness of the procedure, and the surgical technique.2 Several scoring systems have been developed to assess perioperative complications from clinical information, such as the Revised Cardiac Risk Index (RCRI),3 the American College of Surgery National Surgical Quality Improvement Program surgical risk calculator,4 and the Cardiovascular Risk Index.5 The RCRI has long been used as an algorithm for perioperative risk assessment and has been validated in many cohorts.6–8 Unfortunately, no validation studies using large-scale data have been conducted in Japan, except for 1 single-center study with a relatively small sample size.9
The aim of this study was to clarify the incidence of perioperative cardiovascular events in patients undergoing gastrointestinal surgery using real-world data from Japan. Using machine learning algorithms, the aim was also to develop a predictive model for perioperative cardiovascular events. Using the constructed predictive model, risk stratification of patients was performed and its utility verified. Once validated and implemented, this predictive tool will enable surgeons or cardiologists to more accurately assess perioperative risk.
Methods
This research report followed the TRIPOD+AI statement10 on reporting clinical prediction models that use machine learning methods.
Data
The Japan Medical Data Center (JMDC) Claims Database was used for the analysis. This database contains medical claims and health examination data in Japan.11–16 This database, available for purchase from the JMDC, contains data of approximately 11.6 million individuals from January 2005 through April 2021. It includes diagnostic information based on the International Classification of Diseases, Tenth Revision (ICD-10), prescription data based on the Anatomical Therapeutic Chemical classification system, medical practice details based on electronic claims processing codes, and results of certain medical examinations.
Participants
From the dataset, only codes recorded during hospitalization were selected. K codes were used to extract surgical cases in which general anesthesia or epidural anesthesia were used. Only patients aged ≥18 years were included in the study. Patients who underwent any of the following thoracic or abdominal surgeries were excluded: non-gastrointestinal surgery, exploratory laparotomy, endoscopic surgery, gastrostomy and enterostomy, colostomy, and transplantation surgery. Surgeries that were performed in fewer than 5 patients were also excluded. Patients for whom the observation period was ≤30 days were excluded.
Data Preparation
The ICD-10 codes presented in Supplementary Table 1 were used to identify complications and comorbidities. The RCRI was calculated using serum creatinine levels from physical examination data performed within 180 days before surgery (serum creatinine data were available for only 31.0% of patients in the dataset). Emergency surgery was defined as any admission identified as “after hours,” “holiday,” or “urgent.”
Surgical procedures were classified as follows. Because K codes are unique to Japan, internationally used ICD-10 Procedure Coding System (PCS) codes17 were assigned. To improve the clinical interpretability and relevance of the individual features, the Agency for Healthcare Research and Quality/Healthcare Cost and Utilization Project’s Clinical Classifications Software Refined (CCSR)18,19 was used. The ICD-10-PCS codes were classified into CCSR categories using the list provided.20 This resulted in all gastrointestinal surgical procedures being grouped into 27 categories (Supplementary Table 2).
Outcome
The primary endpoint was a major adverse cardiovascular event (MACE) within 30 days of surgery, defined as the rate of the composite of cardiovascular death, myocardial infarction, stroke, and heart failure. Previous reviews have shown that there is inconsistency in the definition of MACE across studies.21 In the present study, the MACE composite endpoint was defined based on ICD-10 codes, in accordance with the approach taken in previous studies (Supplementary Table 3).22–25
Predictions
In this study, machine learning was used to perform a binary classification task to predict MACE occurrence within 30 days after surgery. The variables used for machine learning models were age, sex, 10 comorbidities, 3 surgical information categories (open/laparoscopic, malignancy surgery, emergency surgery), and 27 surgical methods (CCSR categories). Of the variables used, age was a continuous variable and the others were categorical.
Sample Size
The sample size required to minimize the problem of overfitting26 was calculated, and this size was found to be sufficient to answer the research questions.
Missing Data
There were no missing values for any of the variables.
Analytical Methods
The dataset was split randomly into a 7 : 3 ratio of training set to test set. Models were trained on the training data using logistic regression, random forest,27 extreme gradient boosting (XGBoost),28 category boosting (CatBoost),29 and light gradient boosting machine (LightGBM)30 algorithms.
Optuna, an automatic hyperparameter optimization software framework, was used to optimize the hyperparameters of each model.31 The objective function was set to maximize the Matthews correlation coefficient (MCC) and the number of trials was 100. Details of the hyperparameters optimized in each model are presented in Supplementary Table 4. The model was divided into 5 sections of training data, and cross-validation was used to assess the model’s performance. Confidence intervals were generated using block bootstrapping of the predictions in the test set. The model’s prediction performance was internally validated with 2,500 bootstrap resamples. The machine learning model was developed in Python 3.8.8 using the scikit-learn library. The versions of the XGBoost, CatBoost, and LightGBM libraries were 2.1.0, 1.2.5, and 4.0.0, respectively.
Class Imbalance
The number of patients in the postoperative MACE group was much smaller than the number of patients in the group without postoperative MACE, leading to extreme class imbalance. For logistic regression, random forest, and LightGBM, the hyperparameter “class_weight” was set to “balanced” to automatically correct for imbalances. In XGBoost and CatBoost, “pos_weight” was set to 1 to adjust the imbalance between positive and negative samples.
Fairness
Ideally, the data should include information from individuals of different ages, sexes, races/ethnicities, health status and comorbidities, and geographic locations.10 However, due to the nature of the database, the main limitations of this study in terms of fairness were that the dataset included patients aged less than 75 years, and the data were primarily from Japanese patients.
Model Output
To evaluate model performance, each model was applied to the test dataset to predict MACE occurrence within 30 days after surgery. Receiver operating characteristic (ROC) and precision recall (PR) curves were generated for each model. In addition, isotonic regression was used to perform probability calibration, and the Brier score was calculated. The performance of each model was compared using the bootstrap method, but no statistically significant differences were observed. In this study, the area under the PR curve (PR-AUC) was selected as the primary metric for model comparison and selection.
Training Versus Evaluation
The Shapley additive explanation (SHAP)32 values of the training data were calculated using the optimal model, and the data were clustered into 3 clusters using the K-means method27 based on the SHAP values. The elbow method was used to determine the optimal number of clusters in the K-means algorithm. For the test data, the same model and method were used to cluster the data into 3 clusters. The clustered training and test data were compared and evaluated for MACE incidence. Kaplan-Meier curves were used to assess the cumulative incidence of MACE within each cluster.33
Statistical Analysis
Continuous variables with a normal distribution are expressed as the mean±SD. Categorical variables are expressed as percentages (%), unless indicated otherwise. Baseline characteristics were compared using the Chi-squared or Fisher’s exact test for categorical variables, and Student’s or Welch’s t-test after testing that the continuous variables were normally distributed. Significance was defined as P<0.05, and statistical analyses were performed using R version 4.3.3 (R Foundation for Statistical Computing, Vienna, Austria).
Ethical Considerations
This study was conducted in accordance with the Declaration of Helsinki. Although this study used anonymized data and was outside the scope of the guidelines for research involving human subjects in Japan, the study was conducted after approval was obtained from the Ethics Committee of The University of Tokyo Hospital (Approval no. 2024105NIe).
Results
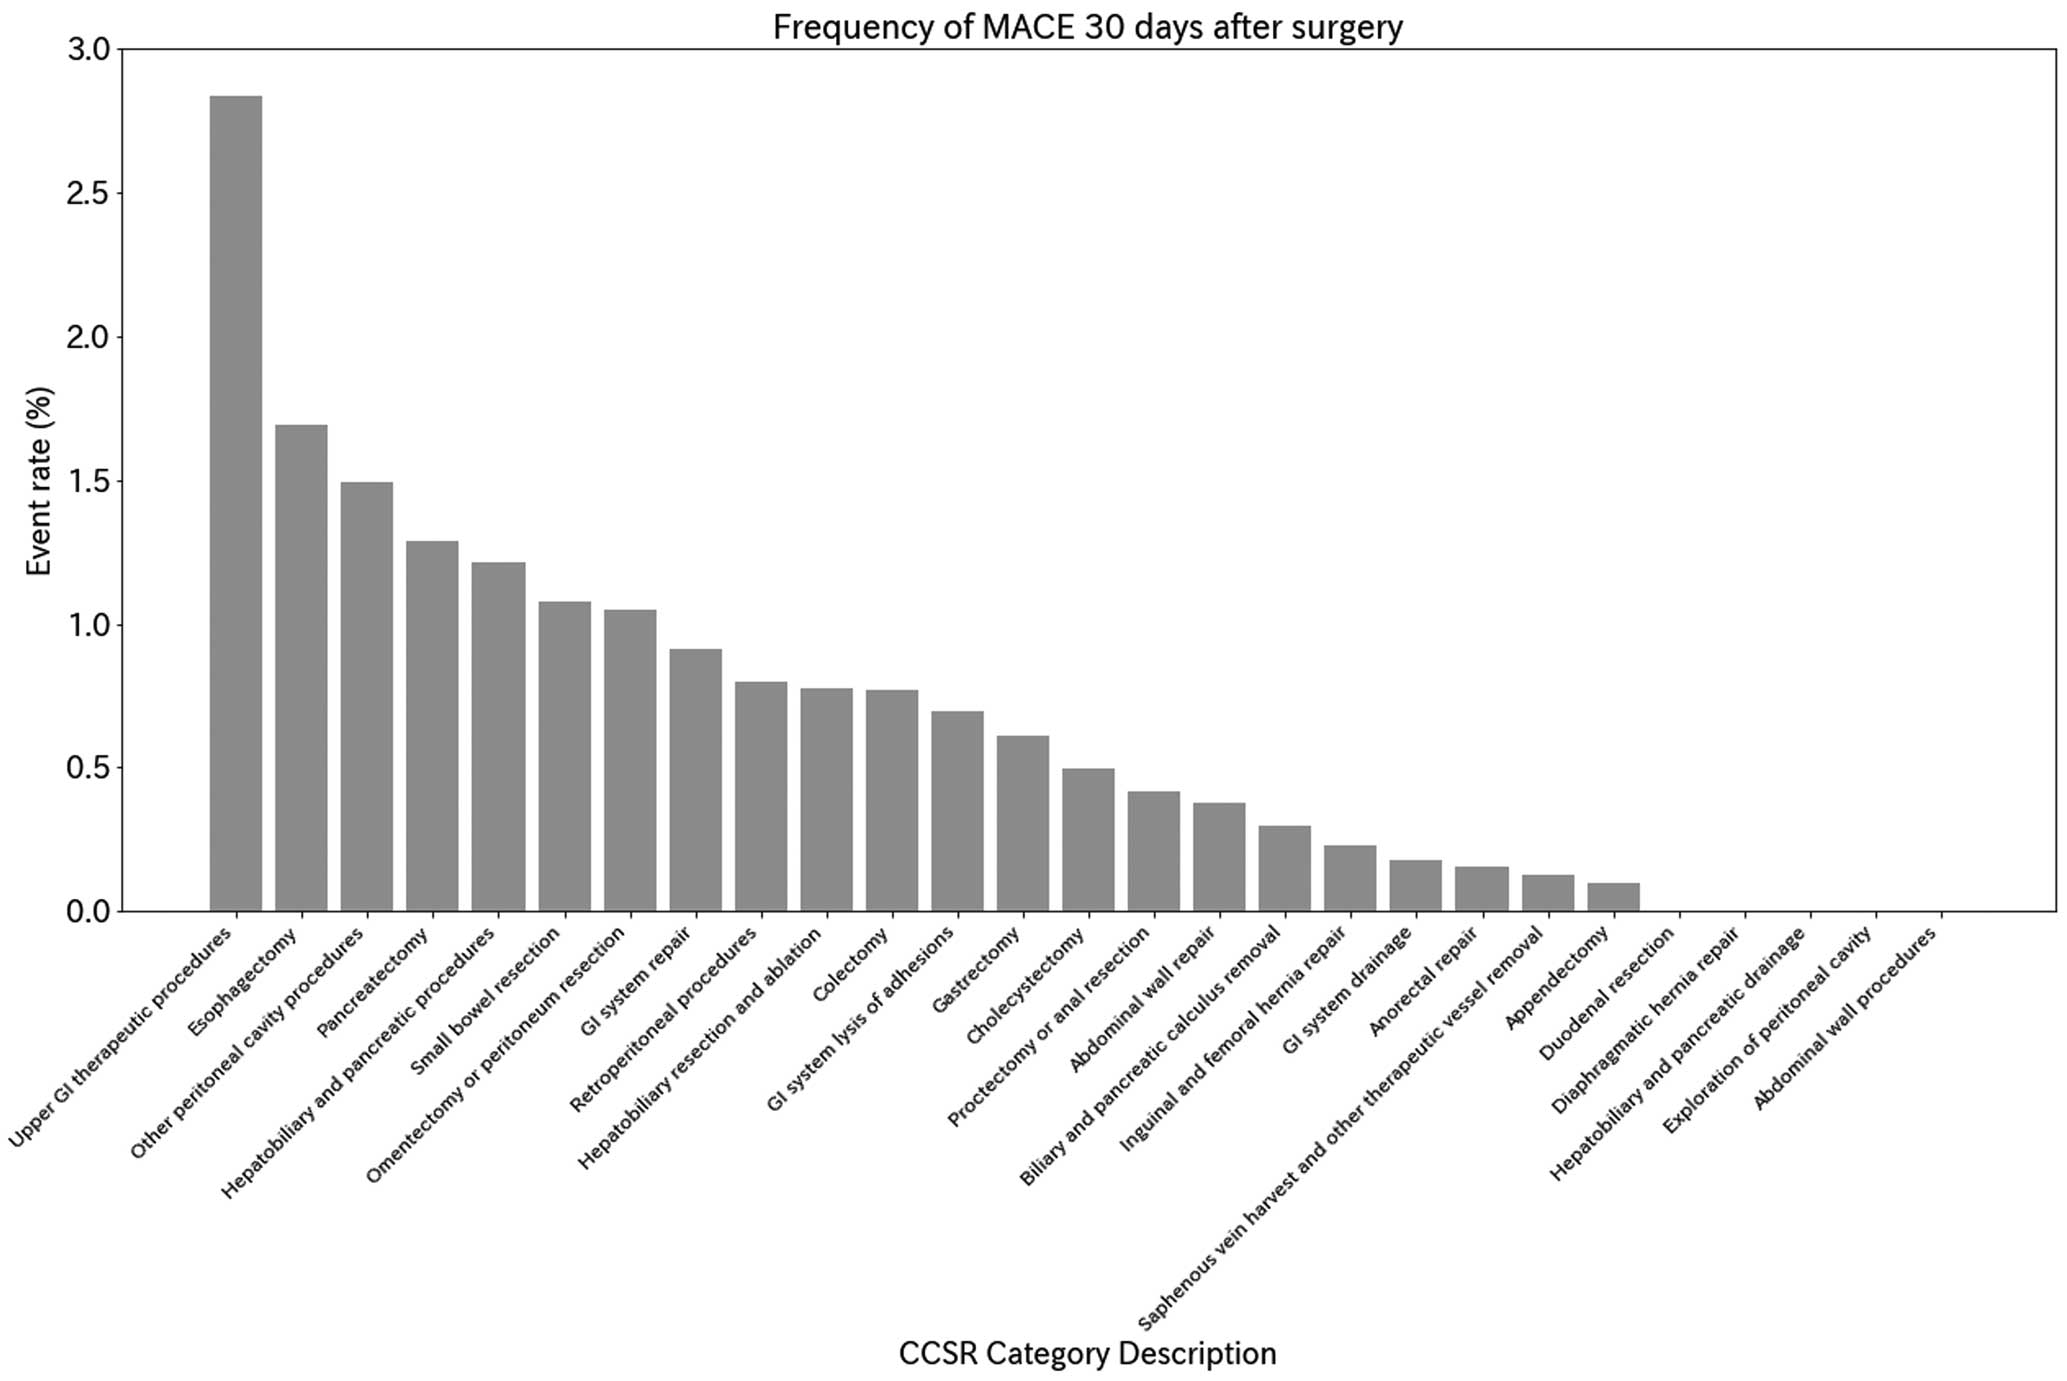
In all, 133,634 surgeries were included in the analysis (Figure 1). Patient characteristics in the original dataset are presented in the Table. Within 30 days of surgery, 506 (0.38%) patients experienced a MACE. Supplementary Table 5 presents baseline characteristics of patients with and without MACE. Figure 2 shows the incidence of MACE by surgical category classified according to the CCSR. Gastroenterostomy and duodenojejunal anastomosis had the highest event rates, followed by esophagectomy, generalized peritonitis and abdominal abscess surgery, and pancreatectomy. The medium-risk category included liver resection, colon resection, cholecystectomy (without stones), etc. The low-risk categories included inguinal hernia, femoral hernia, appendectomy, abdominal wall surgery, etc. (for details, see Supplementary Table 6). Figure 3 shows the accuracy of the prediction models for each method. Calibration curves to assess the goodness of fit of the models are shown in the Supplementary Figure. All models achieved high areas under the ROC curve (ROC-AUC), with values ranging from 0.831 to 0.856; the LightGBM model showed the largest PR-AUC, MCC, and F1 values (Supplementary Table 7). RCRI, calculated using a subset of the dataset, had an ROC-AUC of 0.684, which was lower than the machine learning model.

Table.
Patient Characteristics
| Variable |
Overall |
Training set |
Test set |
P value |
| No. patients |
133,634 |
93,543 |
40,091 |
|
| Male sex |
89,063 (66.6) |
62,331 (66.6) |
26,732 (66.7) |
0.879 |
| Age (years) |
48.5±12.9 |
48.5±12.9 |
48.5±12.9 |
0.693 |
| Comorbidities |
| Ischemic heart disease |
9,695 (7.3) |
6,755 (7.2) |
2,940 (7.3) |
0.476 |
| Heart failure |
7,667 (5.7) |
5,352 (5.7) |
2,315 (5.8) |
0.713 |
| Stroke |
3,772 (2.8) |
2,670 (2.9) |
1,102 (2.7) |
0.294 |
| Diabetes |
24,878 (18.6) |
17,399 (18.6) |
7,479 (18.7) |
0.819 |
| Hypertension |
33,933 (25.4) |
23,808 (25.5) |
10,125 (25.3) |
0.454 |
| Dyslipidemia |
37,227 (27.9) |
26,141 (27.9) |
11,086 (27.7) |
0.276 |
| Chronic kidney disease |
2,128 (1.6) |
1,482 (1.6) |
646 (1.6) |
0.735 |
| Atrial fibrillation |
2,688 (2.0) |
1,880 (2.0) |
808 (2.0) |
0.963 |
| Heart valve disease |
3,219 (2.4) |
2,240 (2.4) |
979 (2.4) |
0.619 |
| Chronic obstructive pulmonary disease |
2,240 (1.7) |
1,553 (1.7) |
687 (1.7) |
0.501 |
| Surgical information |
| Laparoscopic/thoracoscopic surgery |
60,379 (45.2) |
42,127 (45.0) |
18,252 (45.5) |
0.099 |
| Open surgery |
73,255 (54.8) |
51,416 (55.0) |
21,839 (54.5) |
0.099 |
| Malignancy |
27,712 (20.7) |
19,272 (20.6) |
8,440 (21.1) |
0.064 |
| Emergency surgery |
7,803 (5.8) |
5,465 (5.8) |
2,338 (5.8) |
0.950 |
| Surgical method (CCSR category) |
| Abdominal wall procedures |
172 (0.1) |
118 (0.1) |
54 (0.1) |
0.752 |
| Abdominal wall repair |
1,491 (1.1) |
1,044 (1.1) |
447 (1.1) |
1.000 |
| Anorectal repair |
3,074 (2.3) |
2,146 (2.3) |
928 (2.3) |
0.833 |
| Appendectomy |
16,998 (12.7) |
11,916 (12.7) |
5,082 (12.7) |
0.761 |
| Biliary and pancreatic calculus removal |
24,714 (18.5) |
17,386 (18.6) |
7,328 (18.3) |
0.187 |
| Cholecystectomy |
195 (0.1) |
141 (0.2) |
54 (0.1) |
0.532 |
| Colectomy |
9,343 (7.0) |
6,494 (6.9) |
2,849 (7.1) |
0.286 |
| Diaphragmatic hernia repair |
8 (0.0) |
6 (0.0) |
2 (0.0) |
1.000 |
| Duodenal resection |
30 (0.0) |
18 (0.0) |
12 (0.0) |
0.319 |
| Esophagectomy |
396 (0.3) |
279 (0.3) |
117 (0.3) |
0.886 |
| Exploration of peritoneal cavity |
27 (0.0) |
14 (0.0) |
13 (0.0) |
0.065 |
| Gastrectomy |
6,020 (4.5) |
4,198 (4.5) |
1,822 (4.5) |
0.656 |
| GI system drainage |
2,140 (1.6) |
1,520 (1.6) |
620 (1.5) |
0.306 |
| GI system lysis of adhesions |
2,026 (1.5) |
1,430 (1.5) |
596 (1.5) |
0.581 |
| GI system repair |
733 (0.5) |
493 (0.5) |
240 (0.6) |
0.113 |
| Hepatobiliary and pancreatic drainage |
13 (0.0) |
12 (0.0) |
1 (0.0) |
0.126 |
| Hepatobiliary and pancreatic procedures |
158 (0.1) |
103 (0.1) |
55 (0.1) |
0.218 |
| Hepatobiliary resection and ablation |
2,738 (2.0) |
1,879 (2.0) |
859 (2.1) |
0.118 |
| Inguinal and femoral hernia repair |
10,426 (7.8) |
7,332 (7.8) |
3,094 (7.7) |
0.458 |
| Omentectomy or peritoneum resection |
553 (0.4) |
395 (0.4) |
158 (0.4) |
0.491 |
| Other peritoneal cavity procedures |
1,390 (1.0) |
955 (1.0) |
435 (1.1) |
0.303 |
| Pancreatectomy |
2,410 (1.8) |
1,706 (1.8) |
704 (1.8) |
0.406 |
| Proctectomy or anal resection |
6,900 (5.2) |
4,758 (5.1) |
2,142 (5.3) |
0.054 |
| Retroperitoneal procedures |
483 (0.4) |
339 (0.4) |
144 (0.4) |
0.968 |
| Saphenous vein harvest and other therapeutic vessel removal |
36,817 (27.6) |
25,805 (27.6) |
11,012 (27.5) |
0.661 |
| Small bowel resection |
3,852 (2.9) |
2,692 (2.9) |
1,160 (2.9) |
0.890 |
| Upper GI therapeutic procedures |
527 (0.4) |
364 (0.4) |
163 (0.4) |
0.675 |
| RCRI scoreA |
1.2±0.5 |
1.2±0.5 |
1.2±0.5 |
0.480 |
| RCRI score ≥2A |
2,999 (12.3) |
2,095 (12.3) |
904 (12.5) |
0.622 |
| MACE |
506 (0.4) |
354 (0.4) |
152 (0.4) |
0.430 |
An=24,286. Categorical variables are expressed as n (%) and continuous variables are presented as the mean±SD. CCSR, Clinical Classifications Software Refined; GI, gastrointestinal; MACE, Major adverse cardiac events; RCRI, Revised Cardiac Risk Index.
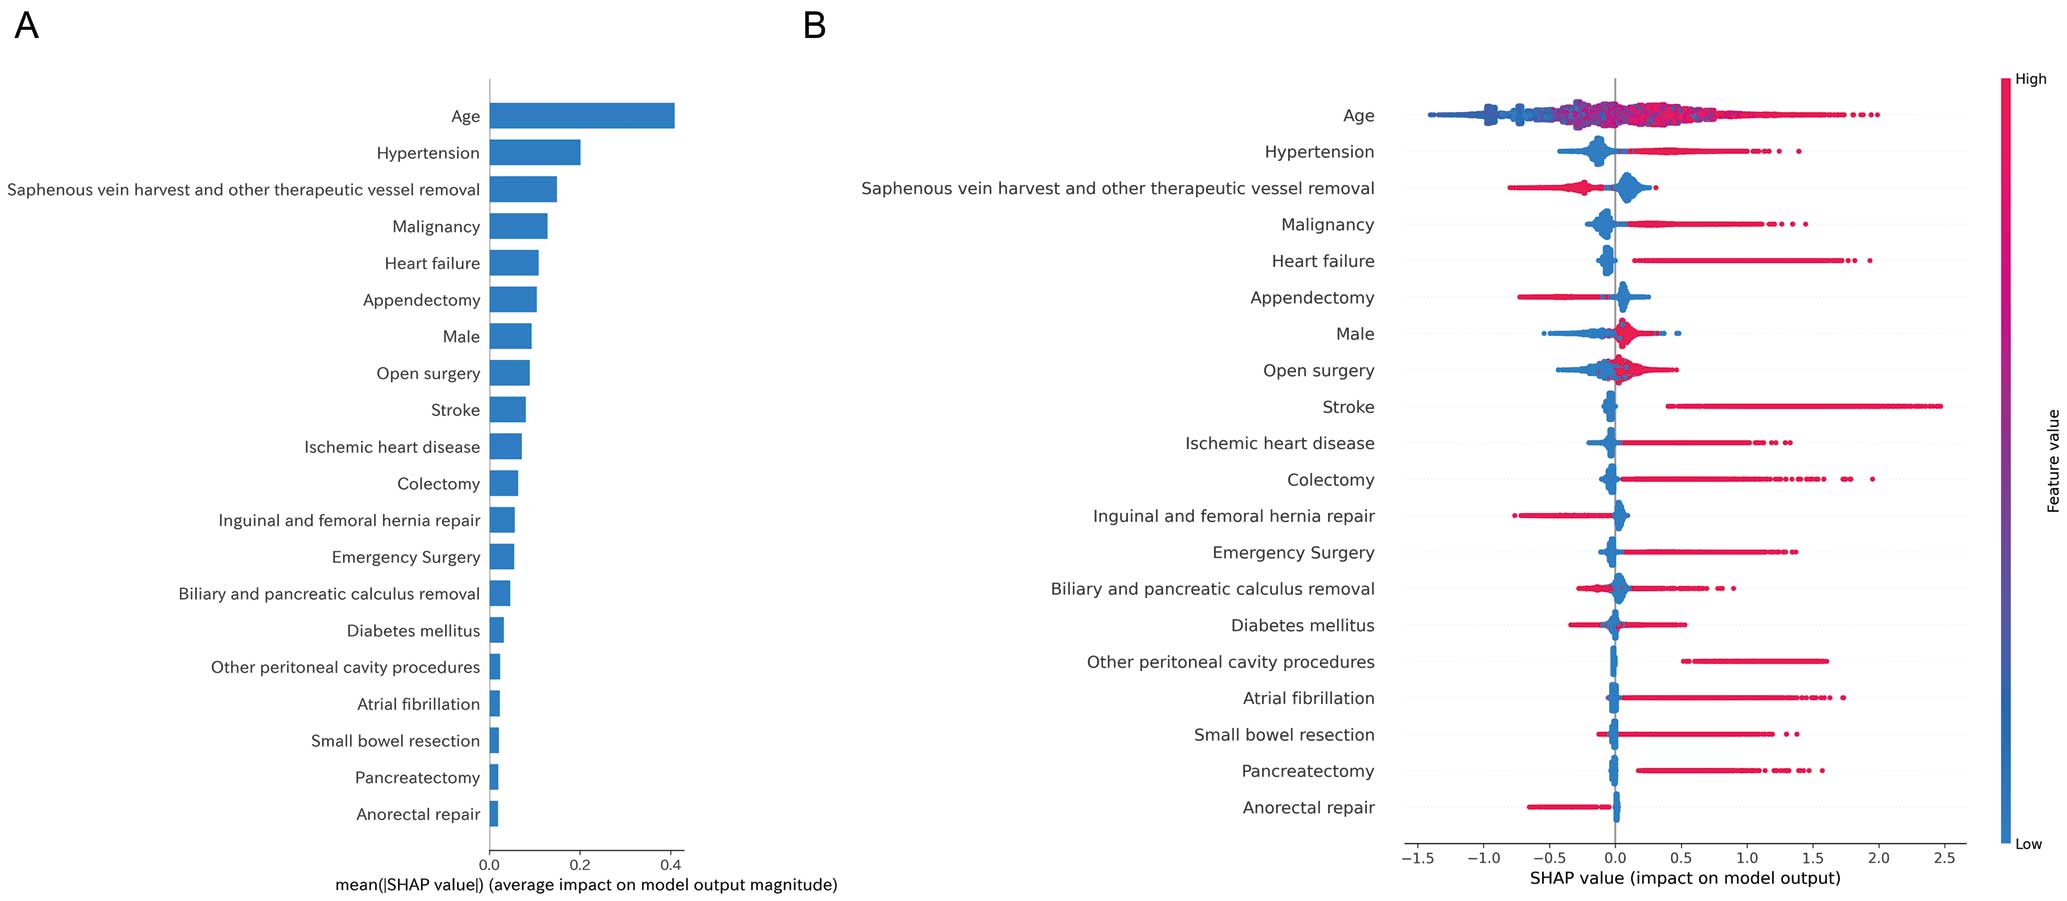
Of the features used to predict the outcomes, age had the highest impact (Figure 4A). The summary plot shows that higher age and the presence of a history of hypertension, malignancy, and heart failure contributed to MACE occurrence. In contrast, hemorrhoid surgery (variable name: saphenous vein harvest and other therapeutic vessel removal), appendicectomy, and surgery for inguinal and femoral hernias showed negative correlations as predictors of a lower MACE incidence (Figure 4B).
Figure 5A shows the MACE rates for each cluster of the training data clustered into 3 clusters using the K-means method. Clustering the test data using the same model yielded similar results, as shown in Figure 5B. Figure 6 shows the Kaplan-Meier curves for 30-day MACE after surgery for each cluster. Patients in Clusters 1 and 2 had significantly higher MACE rates than those in Cluster 0 (P<0.001).
Figure 7 shows the percentage distribution of the variables in each cluster. Each variable was standardized from 0 to 1. The results showed that the high-risk group was characterized by older age, a history of ischemic heart disease or heart failure, a history of stroke, history of diabetes, a history of hypertension, a history of atrial fibrillation, cases of malignancy, and pancreatic biliary surgery. Details of the characteristics by cluster for the training data are presented in Supplementary Table 8.

In summary, Cluster 0 (low risk) is characterized by younger age, lower rates of comorbidity, the CCSR categories of “appendectomy” and “saphenous vein harvest and other therapeutic vessel removal” (such as hemorrhoid surgery), and other benign procedures. Conversely, Cluster 2 (high risk) is characterized by older age, a higher proportion of comorbidities, a higher proportion of malignancy surgery, and “hepatobiliary resection and ablation” and “pancreatectomy” in the CCSR category. Cluster 1 (intermediate risk) was an intermediate patient background. In the present study, emergency surgery and laparoscopic or open surgery did not contribute significantly to risk estimation.
Discussion
In this study, the perioperative MACE risk in gastrointestinal surgery was evaluated using real-world data from Japan, and a machine learning prediction model was developed. Several important findings were obtained. First, gastrointestinal anastomosis, duodenojejunal anastomosis, esophagectomy, generalized peritonitis surgery, abdominal abscess surgery, and pancreatectomy were identified as high-risk procedures. These surgeries are considered high MACE risk because they require advanced techniques and management of the patient’s general condition. These results were comparable to those of the estimated surgical risk according to type of surgery in previous large studies,34,35 and several clinical guidelines, such as the American College of Cardiology and American Heart Association,36 the European Society of Cardiology,2 and the Japanese Circulation Society.37 However, the present study showed the risks of more segmented and refined surgical procedures.
Second, the accuracy of each model was found to be higher than that of the previously used RCRI, with LightGBM in particular demonstrating superior performance. In a previous Japanese study,9 it was unclear whether the RCRI score can identify patients at higher MACE risk. In the present study, the visualization of high-impact variables using SHAP showed factors that are important in prediction. In particular, age, medical history (ischemic heart disease, heart failure, stroke, diabetes, hypertension, and atrial fibrillation), presence of malignancy, and type of surgery emerged as important predictors.
Peng et al. presented the findings of a machine learning model that predicted postoperative MACE risk in approximately 5,700 elderly patients at a single institution.38 In that study, New York Heart Association functional class and biomarkers, such as B-type natriuretic peptide and troponin-T levels, were identified as important variables in the model.38 The machine learning model developed from general patient background, comorbidities, and surgical procedure information demonstrated satisfactory performance in the present study.
Conversely, all models showed low PR-AUC, MCC, and F1 values as a consequence of pronounced outcome imbalances. Furthermore, the adjustment of hyperparameters did not lead to any discernible enhancement. Nevertheless, the integration of the clustering method with the K-means method based on SHAP values may facilitate the stratification of risk and the identification of lower-frequency event occurrence risks. The high-risk group includes a significant proportion of patients who are older and have multiple cardiovascular diseases and malignancies. These patients require particularly careful preoperative evaluation and postoperative management.
A comparison of the clustering results and MACE incidence for the test data with those for the training data showed similar outcomes, thereby confirming the high degree of generalizability exhibited by the predictive model.
This suggests that the constructed model is likely to be of significant utility in actual clinical practice. This predictive tool demonstrates superior accuracy in risk stratification compared to the RCRI. Ideally, hospitalists would provide comprehensive support to ensure high-quality care.39 However, the shortage of physicians and cardiologists, particularly in small and medium-sized hospitals, may make it difficult to undertake adequate perioperative risk assessment.40 The concept proposed in the present study has the potential to assist surgeons in accurately assessing surgical risk. In addition, validation and clinical implementation could provide a practical solution to the shortage of hospital doctors.
Study Limitations
This study has several potential limitations. First, due to the nature of the database, the surgeries analyzed did not include cases in which the patient’s age at the time of surgery was ≥75 years. Furthermore, the lack of availability of medical history between the time of medical insurance enrollment and the time of surgery resulted in variations in the duration of observation of the medical history. Second, because the data were derived from receipts, it was not possible to ascertain whether an event occurred before or after the surgery on the day of the surgery. Consequently, such events were not included as outcomes. Therefore, there may be a degree of bias in this study regarding the occurrence of cardiovascular events due to these factors. Furthermore, due to the nature of the database, mortality data are available only on a monthly basis, so the analysis was conducted using mortality data obtained from the disease outcome with date information. Accordingly, some reliability concerns remain for the mortality information. Third, the model had low F1 values due to class imbalance and dataset specific characteristics. This may lead to misclassification of high-risk patients representing the minority class. There are limitations to improving the accuracy of rare events. Conversely, efforts to increase risk stratification capacity are important to improve practicality. Finally, the study was based on data from receipts, and the analysis relied on information recorded for the purpose of reimbursement, which may introduce bias regarding the reflection of actual clinical conditions. Despite these limitations, the study provides valuable insights into the risk assessment of perioperative cardiovascular events in gastrointestinal surgery using real-world data. Future studies should integrate diverse data sources to enhance the accuracy and applicability of the prediction model. Prospective studies are also necessary to validate the operational feasibility and usefulness of the model for application in actual clinical practice.
Conclusions
A machine learning model built from basic clinical information, comorbidities, and surgical information demonstrated its ability to stratify MACE risk in patients undergoing gastrointestinal surgery.
Acknowledgments
The authors thank FORTE Science Communications (https://www.forte-science.co.jp/) for English language editing.
Sources of Funding
This study was funded by the Progress of the Next Cross-ministerial Strategic Innovation Promotion Program (SIP) on “Integrated Health Care System” (Grant no. JPJ012425). The funder played no role in study design, data collection, analysis and interpretation of data, or the writing of this manuscript.
Disclosures
There are no financial conflicts of interest to disclose concerning this study.
IRB Information
This study was approved by the Ethics Committee of The University of Tokyo Hospital (Approval no. 2024105NIe).
Data Availability
The relevant analytical protocol and code underlying this analysis are available upon request to the corresponding author. The JMDC database is a commercial database and cannot be accessed through this request.
Supplementary Files
Please find supplementary file(s);
https://doi.org/10.1253/circj.CJ-25-0032
References
- 1.
Smilowitz NR, Gupta N, Ramakrishna H, Guo Y, Berger JS, Bangalore S. Perioperative major adverse cardiovascular and cerebrovascular events associated with noncardiac surgery. JAMA Cardiol 2017; 2: 181–187.
- 2.
Halvorsen S, Mehilli J, Cassese S, Hall TS, Abdelhamid M, Barbato E, et al. 2022 ESC guidelines on cardiovascular assessment and management of patients undergoing non-cardiac surgery. Eur Heart J 2022; 43: 3826–3924.
- 3.
Lee TH, Marcantonio ER, Mangione CM, Thomas EJ, Polanczyk CA, Cook EF, et al. Derivation and prospective validation of a simple index for prediction of cardiac risk of major noncardiac surgery. Circulation 1999; 100: 1043–1049.
- 4.
Gupta PK, Gupta H, Sundaram A, Kaushik M, Fang X, Miller WJ, et al. Development and validation of a risk calculator for prediction of cardiac risk after surgery. Circulation 2011; 124: 381–387.
- 5.
Dakik HA, Chehab O, Eldirani M, Sbeity E, Karam C, Abou Hassan O, et al. A New index for pre-operative cardiovascular evaluation. J Am Coll Cardiol 2019; 73: 3067–3078.
- 6.
Ford MK, Beattie WS, Wijeysundera DN. Systematic review: Prediction of perioperative cardiac complications and mortality by the revised cardiac risk index. Ann Intern Med 2010; 152: 26–35.
- 7.
Sunny JC, Kumar D, Kotekar N, Desai N. Incidence and predictors of perioperative myocardial infarction in patients undergoing non-cardiac surgery in a tertiary care hospital. Indian Heart J 2018; 70: 335–340.
- 8.
Yap MKC, Ang KF, Gonzales-Porciuncula LA, Esposo E. Validation of the American College of Surgeons risk calculator for preoperative risk stratification. Heart Asia 2018; 10: e010993.
- 9.
Hirano Y, Takeuchi H, Suda K, Oyama T, Nakamura R, Takahashi T, et al. Clinical utility of the Revised Cardiac Risk Index in non-cardiac surgery for elderly patients: A prospective cohort study. Surg Today 2014; 44: 277–284.
- 10.
Collins GS, Moons KGM, Dhiman P, Riley RD, Beam AL, Van Calster B, et al. TRIPOD+AI statement: Updated guidance for reporting clinical prediction models that use regression or machine learning methods. BMJ 2024; 385: e078378.
- 11.
Seki T, Kawazoe Y, Takiguchi T, Akagi Y, Ito H, Kubota K, et al. Sex differences in post-noncardiac surgery risks assessed using the revised cardiac risk index: A nationwide retrospective cohort study. Circ J 2025, doi:10.1253/circj.CJ-24-0846.
- 12.
Fujinaga J, Fukuoka T. A review of research studies using data from the administrative claims databases in Japan. Drugs Real World Outcomes 2022; 9: 543–550.
- 13.
Takizawa T, Kitano T, Iijima M, Togo K, Yonemoto N. Treatment patterns and characteristics of patients with migraine: Results from a retrospective database study in Japan. J Headache Pain 2024; 25: 19.
- 14.
Umemura T, Wattanakamolkul K, Nakayama Y, Takahashi Y, Sbarigia U, KyungHwa L, et al. Real-world epidemiology, clinical and economic burden of chronic hepatitis B in Japan: A retrospective study using JMDC Claims Database. Infect Dis Ther 2023; 12: 1337–1349.
- 15.
Gouda M, Arakawa K, Inagaki M, Ushirogawa Y. Effect of sodium-glucose cotransporter 2 inhibitor medication on new prescriptions of antihypertensives, antigout/antihyperuricemics and antidyslipidemics in Japan: Analysis using the JMDC Claims Database. J Diabetes Investig 2022; 13: 1842–1851.
- 16.
Laurent T, Simeone J, Kuwatsuru R, Hirano T, Graham S, Wakabayashi R, et al. Context and considerations for use of two Japanese real-world databases in Japan: Medical data vision and Japanese Medical Data Center. Drugs Real World Outcomes 2022; 9: 175–187.
- 17.
The U.S. Centers for Medicare & Medicaid Services. ICD-10 Codes. https://www.cms.gov/medicare/coding-billing/icd-10-codes (accessed April 16, 2025).
- 18.
Agency for Healthcare Quality and Research. Clinical Classifications Software Refined (CCSR). https://hcup-us.ahrq.gov/toolssoftware/ccsr/ccs_refined.jsp (accessed August 7, 2024).
- 19.
Johnston S, Jha A, Roy S, Pollack E. Surgical complication risk factor identification using high-dimensional hospital data: An illustrative example in hemostasis-related complications. Clinicoecon Outcomes Res 2022; 14: 683–689.
- 20.
Agency for Healthcare Research and Quality. Clinical Classifications Software Refined (CCSR) for ICD-10-PCS Procedures. https://hcup-us.ahrq.gov/toolssoftware/ccsr/prccsr.jsp (accessed April 16, 2025).
- 21.
Bosco E, Hsueh L, McConeghy KW, Gravenstein S, Saade E. Major adverse cardiovascular event definitions used in observational analysis of administrative databases: A systematic review. BMC Med Res Methodol 2021; 21: 241.
- 22.
Jernberg T, Hasvold P, Henriksson M, Hjelm H, Thuresson M, Janzon M. Cardiovascular risk in post-myocardial infarction patients: Nationwide real world data demonstrate the importance of a long-term perspective. Eur Heart J 2015; 36: 1163–1170.
- 23.
Lindahl B, Baron T, Erlinge D, Hadziosmanovic N, Nordenskjöld A, Gard A, et al. Medical therapy for secondary prevention and long-term outcome in patients with myocardial infarction with nonobstructive coronary artery disease. Circulation 2017; 135: 1481–1489.
- 24.
Ohm J, Skoglund PH, Discacciati A, Sundström J, Hambraeus K, Jernberg T, et al. Socioeconomic status predicts second cardiovascular event in 29,226 survivors of a first myocardial infarction. Eur J Prev Cardiol 2018; 25: 985–993.
- 25.
Seong JM, Shin D, Sung JW, Cho S, Yang J, Kang S, et al. Gonadotropin-releasing hormone agonists, anti-androgens and the risk of cardio-cerebrovascular disease in prostate cancer patients: An asian population-based observational study. J Cancer 2020; 11: 4015–4022.
- 26.
Riley RD, Ensor J, Snell KIE, Harrell FE Jr, Martin GP, Reitsma JB, et al. Calculating the sample size required for developing a clinical prediction model. BMJ 2020; 368: m441.
- 27.
Pedregosa F, Varoquaux G, Gramfort A, Michel V, Thirion B, Grisel O, et al. Scikit-learn: Machine learning in Python. J Mach Learn Res 2011; 12: 2825–2830.
- 28.
Chen T, Guestrin C. Xgboost: A scalable tree boosting system. In: KDD ’16: Proceedings of the 22nd ACM SIGKDD International Conference on Knowledge Discovery and Data Mining. 2016; 785–794. https://dl.acm.org/doi/10.1145/2939672.2939785 (accessed March 3, 2025).
- 29.
Prokhorenkova L, Gusev G, Vorobev A, Dorogush AV, Gulin A. CatBoost: Unbiased boosting with categorical features. In: 32nd Conference on Neural Information Processing Systems (NeurIPS 2018), Montréal, Canada. 2018. https://proceedings.neurips.cc/paper_files/paper/2018/file/14491b756b3a51daac41c24863285549-Paper.pdf (accessed March 3, 2025).
- 30.
Ke G, Meng Q, Finley T, Wang T, Chen W, Ma W, et al. Lightgbm: A highly efficient gradient boosting decision tree. In: 31st Conference on Neural Information Processing Systems (NIPS 2017), Long Beach, CA, USA. 2017. https://proceedings.neurips.cc/paper_files/paper/2017/file/6449f44a102fde848669bdd9eb6b76fa-Paper.pdf (accessed March 3, 2025).
- 31.
Akiba T, Sano S, Yanase T, Ohta T, Koyama M. Optuna: A next-generation hyperparameter optimization framework. In: Proceedings of the 25th ACM SIGKDD International Conference on Knowledge Discovery & Data Mining. 2019; 2623–2631, doi:10.48550/arXiv.1907.10902.
- 32.
Lundberg SM, Lee SI. A unified approach to interpreting model predictions. In: NIPS ’17: Proceedings of the 31st International Conference on Neural Information Processing Systems. 2017; 4768–4777. https://dl.acm.org/doi/10.5555/3295222.3295230 (accessed March 3, 2025).
- 33.
Tateishi R, Shimizu M, Suzuki M, Sakai E, Shimizu A, Shimada H, et al. Machine learning-based clustering using a 12-lead electrocardiogram in patients with a implantable cardioverter defibrillator to identify future ventricular arrhythmia. Circ J 2025; 89: 240–250.
- 34.
Birkmeyer JD, Siewers AE, Finlayson EV, Stukel TA, Lucas FL, Batista I, et al. Hospital volume and surgical mortality in the United States. N Engl J Med 2002; 346: 1128–1137.
- 35.
Bolliger M, Kroehnert JA, Molineus F, Kandioler D, Schindl M, Riss P. Experiences with the standardized classification of surgical complications (Clavien-Dindo) in general surgery patients. Eur Surg 2018; 50: 256–261.
- 36.
Fleisher LA, Fleischmann KE, Auerbach AD, Barnason SA, Beckman JA, Bozkurt B, et al. 2014 ACC/AHA guideline on perioperative cardiovascular evaluation and management of patients undergoing noncardiac surgery: Executive summary: A report of the American College of Cardiology/American Heart Association Task Force on Practice Guidelines. Circulation 2014; 130: 2215–2245.
- 37.
Hiraoka E, Tanabe K, Izuta S, Kubota T, Kohsaka S, Kozuki A, et al. JCS 2022 guideline on perioperative cardiovascular assessment and management for non-cardiac surgery. Circ J 2023; 87: 1253–1337.
- 38.
Peng X, Zhu T, Wang T, Wang F, Li K, Hao X. Machine learning prediction of postoperative major adverse cardiovascular events in geriatric patients: A prospective cohort study. BMC Anesthesiol 2022; 22: 284.
- 39.
Salim SA, Elmaraezy A, Pamarthy A, Thongprayoon C, Cheungpasitporn W, Palabindala V. Impact of hospitalists on the efficiency of inpatient care and patient satisfaction: A systematic review and meta-analysis. J Community Hosp Intern Med Perspect 2019; 9: 121–134.
- 40.
Kamihara T, Tabuchi M, Omura T, Suzuki Y, Aritake T, Hirashiki A, et al. Evolution of a large language model for preoperative assessment based on the Japanese Circulation Society 2022 guideline on perioperative cardiovascular assessment and management for non-cardiac surgery. Circ Rep 2024; 6: 142–148.