Abstract
Background: Coronary artery disease (CAD) is a major cause of mortality worldwide. Serum carboxyl-terminal telopeptide of type I collagen (CITP), a marker of collagen degradation in the heart and blood vessels, is associated with plaque vulnerability and cardiac remodeling in patients with acute myocardial infarction. However, the effect of CITP on the clinical outcomes of patients with CAD has not yet been elucidated.
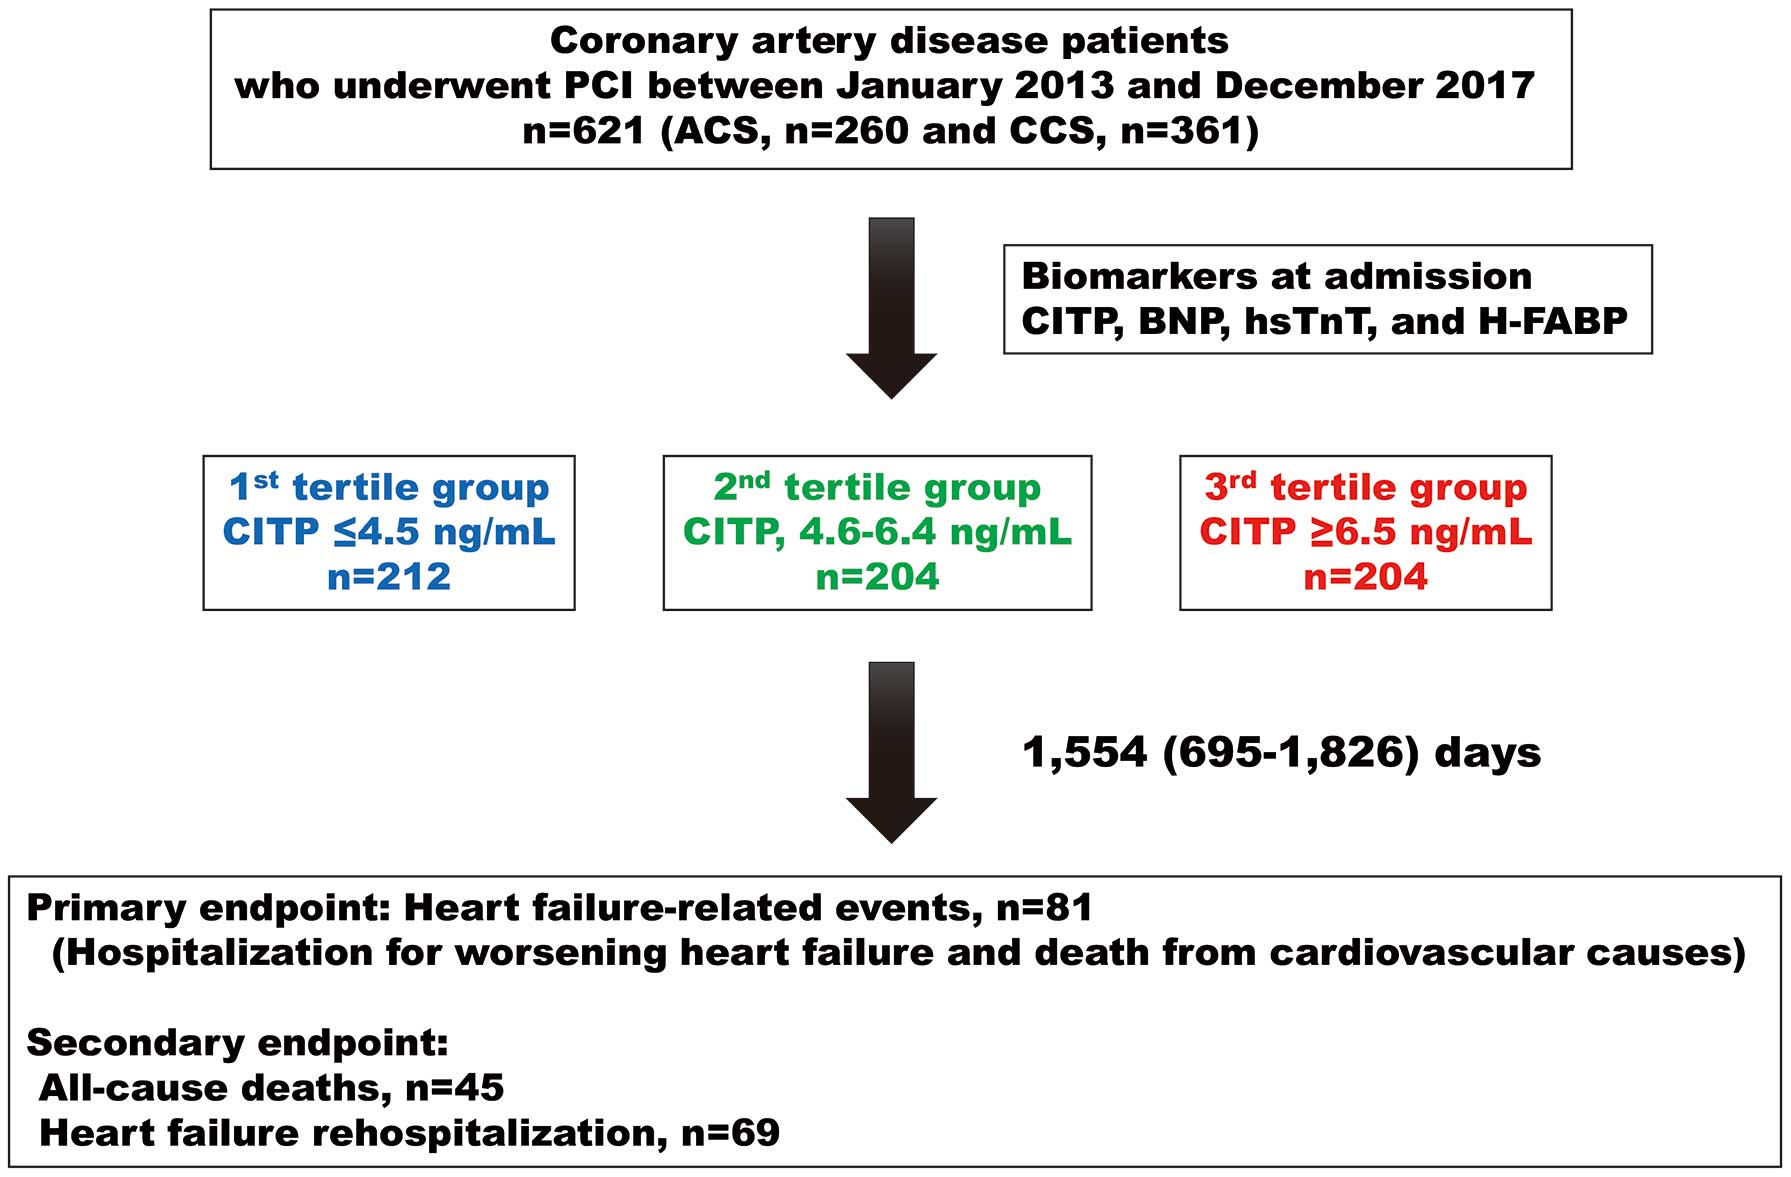
Methods and Results: Serum CITP concentrations were measured in 621 consecutive patients with CAD. All patients were prospectively followed up for a median period of 1,554 days. The primary endpoint was a composite of hospitalization for heart failure or cardiovascular death; the secondary endpoints were all-cause death and heart failure rehospitalization. B-Type natriuretic peptide and the left ventricular mass index were higher in the highest CITP tertile group. Kaplan-Meier analysis demonstrated that the CAD patients in the highest CITP tertile group had the greatest risk of both primary and secondary endpoints, independent of acute or chronic coronary syndrome. Multivariate Cox proportional hazard regression analysis demonstrated that CITP was an independent predictor of both primary and secondary endpoints after adjusting for confounding risk factors, regardless of acute or chronic coronary syndrome.
Conclusions: The serum CITP concentration could be a feasible marker for clinical outcomes in patients with CAD.
Cardiovascular disease (CVD) is the leading cause of death worldwide. Coronary artery disease (CAD), which clinically manifests as acute coronary syndrome (ACS) and chronic coronary syndrome (CCS), is the most common cause of cardiovascular death, accounting for around 40% of all cardiovascular diseases.1 Advances in percutaneous coronary intervention (PCI) procedures and medicine have improved clinical outcomes in CAD.2,3 However, the mortality and incidence rate of heart failure (HF) in patients with CAD remain high.4 Thus, preventing future cardiovascular death and HF in patients with CAD undergoing PCI is of critical importance.
HF after cardiac injury develops through a complex mechanism.5 Cardiovascular fibrosis, a key feature of left ventricular (LV) remodeling in CAD, can have deleterious effects on cardiac structure and function, leading to HF.6 Markers of collagen turnover include markers of collagen synthesis and degradation. Thus, byproducts of collagen synthesis and degradation have been extensively investigated as markers of fibrosis.7 Serum carboxyl-terminal telopeptide of type I collagen (CITP) is a 12-kDa matrix metalloproteinase-induced collagen degradation product of type I collagen in the extracellular matrix of the heart, blood vessels, and bone. Therefore, CITP is a useful marker of collagen turnover and is representative of myocardial and vascular fibrosis. CITP levels reportedly do not differ between healthy controls and patients with stable angina, whereas CITP values in patients with ACS are higher than those in patients with stable angina and healthy controls.8 CITP levels have been reported to be positively related to the necrotic core area assessed by intravascular ultrasound in patients who underwent coronary angiography.9 Furthermore, serum CITP levels on admission have been shown to be related to extension of wall motion abnormality after acute myocardial infarction (AMI) independent of reperfusion.10 CITP levels have also been shown to be related to early and 6-month cardiac remodeling in patients with AMI undergoing reperfusion, indicating an association of CITP with plaque vulnerability and LV remodeling in patients with AMI.11 One report indicated that CITP levels were associated with composite events and mortality at 1 year in patients with AMI.12 However, the clinical significance of serum CITP levels has not yet been fully examined in patients with CAD.
This study examined whether serum CITP levels are associated with clinical outcomes in patients with CAD who underwent PCI.
Methods
Ethics Statement
All procedures were performed in accordance with the ethical, institutional, and/or national research committee guidelines of the centers at which the studies were conducted, and complied with the 1964 Helsinki Declaration and its later amendments or comparable ethical standards. This study was approved by the Institutional Ethics Committee of Yamagata University School of Medicine. The first and updated IRB numbers are H20-62 and 2024-313, respectively.
Study Population
This prospective observational study is part of an ongoing Yamagata Cardiovascular and Cerebrovascular Prognosis Survey aimed at identifying the risk factors for poor clinical outcomes in patients with CAD. Starting in 2013, this survey examined the association between serum CITP levels and clinical outcomes. Serum CITP levels were measured early in the morning within 24 h of hospital admission after obtaining written informed consent. The exclusion criteria were malignant cancer with bone metastasis and active hepatic and lung diseases. All patients were prospectively followed up twice a year for 1,826 days, starting from the day after obtaining informed consent, using telephone or medical records.
The study population consisted of 621 patients with CAD who were admitted to Yamagata University Hospital for PCI. The sample size was estimated on the basis of the number of events required to adjust for confounding factors. ACS and CCS were diagnosed by 2 expert cardiologists according to the guidelines.2,3,13 PCI for CCS was performed in patients with angiographic stenosis >90% and in those showing angiographic stenosis >75% with evidence of ischemia assessed by myocardial scintigraphy or fractional flow reserve measurements. Successful revascularization was defined as Thrombolysis In Myocardial Infarction Grade 3 flow.
Transthoracic echocardiography was performed by physicians and sonographers who were blinded to biochemical data. LV ejection fraction (LVEF), LV end-diastolic diameter (LVEDD), LV mass index (LVMI), and the ratio of the mitral inflow E wave to the tissue Doppler e′ wave (E/e′ ratio) were measured. Clinical data, such as age, sex, traditional risk factors for CAD,14 medical history, and medication at discharge, were obtained from patients’ medical records and interviews
CITP and Cardiac Biomarker Measurement
Blood samples were collected in the early morning within 24 h of hospital admission. CITP levels were determined by radioimmunoassays, as reported previously,15 using a polyclonal antibody specifically directed against CITP (Orion Diagnostica, Finland).
B-Type natriuretic peptide (BNP) concentrations were measured in blood samples that were collected at the same time, preserved at 4℃, and centrifuged at 3200 r.p.m. for 7 min at 4℃. Plasma BNP concentrations were evaluated using a chemiluminescent immunoassay specific for human BNP (BNP-JP Abbott; Abbott Japan, Chiba, Japan).
High-sensitivity troponin T (hsTnT) and heart-type fatty acid-binding protein (H-FABP) concentrations were evaluated using the electrochemiluminescent immunoassay (ECLIA) method (Elecsystroponin-T; Roche Diagnostics, Tokyo, Japan) and a 2-step sandwich ELISA kit (MARKIT-M H-FABP; Dainippon Pharmaceutical Co. Ltd., Tokyo, Japan), respectively. High-sensitivity C-reactive protein (hsCRP) levels were measured simultaneously.
Cardiovascular Risk Factors
Hypertension was defined as systolic blood pressure ≥140 mmHg, diastolic blood pressure ≥90 mmHg, or the use of antihypertensive medication. Diabetes was defined as fasting blood sugar levels ≥126 mg/dL, HbA1c levels ≥6.5%, or the use of antidiabetic medications. Dyslipidemia was defined as high-density lipoprotein cholesterol <40 mg/dL, low-density lipoprotein cholesterol ≥140 mg/dL, triglyceride ≥150 mg/dL, or the use of lipid-lowering medications.
The estimated glomerular filtration rate (eGFR) was calculated using the Modification of Diet in Renal Disease equation with the Japanese coefficient, as reported previously.16 Chronic kidney disease (CKD) was defined as reduced eGFR (<60 mL/min/1.73 m2) or albuminuria. Severe CKD was defined as eGFR <30 mL/min/1.73 m2
or hemodialysis. Hemoglobin levels were measured simultaneously, and anemia was defined as hemoglobin <13 g/dL in men and <12 g/dL in women, in accordance with the World Health Organization guidelines.
Thrombotic and Bleeding Risks
The components of the Coronary Revascularization Demonstrating Outcome Study in Kyoto Risk Score for thrombotic risk in patients who underwent PCI include age ≥75 years, chronic total coronary artery occlusion, diabetes, atrial fibrillation (AF), lower-extremity artery disease (LEAD), severe CKD, anemia, and HF.
Bleeding risk was assessed using the Japanese version of the high bleeding risk criteria according to the Japanese Circulation Society 2020 guideline recommendations.17 The primary criteria for the Japanese version of high bleeding risk include low body weight (men <55 kg, women <50 kg), LEAD, severe CKD, moderate-to-severe anemia (hemoglobin <11 g/dL), and HF.
Endpoints and Follow-up
All patients were prospectively followed up by telephone or by reviewing their medical records twice a year for a median period of 1,554 days (interquartile range [IQR] 695–1,826 days). The primary endpoints were HF-related events, defined as cardiovascular death and rehospitalization for HF. Secondary endpoints were all-cause death and rehospitalization for HF. In addition, we examined thrombotic events, such as target vessel revascularization, target vessel ACS, non-target vessel ACS, and bleeding events defined by the Bleeding Academic Research Consortiums 3 and 5.
Statistical Analysis
The normality of the distribution of continuous variables was confirmed using the Shapiro-Wilk test. Normally distributed continuous variables are presented as the mean±SD, whereas skewed variables are presented as the median with IQR. Categorical variables are presented as numbers and percentages. Continuous and categorical variables were compared using t-tests and the χ2
test , respectively. The significance of differences among groups was analyzed using analysis of variance with Tukey’s post hoc test. Because CITP, BNP, hsTnT, H-FABP, and hsCRP data were not normally distributed, the significance of differences among groups was analyzed using the Steel-Dwass test.
Receiver operating characteristic curves for primary and secondary endpoints were plotted and used to measure the predictive accuracy of CITP, BNP, hsTnT, and H-FABP levels. C-indices for each cardiac biomarker were compared to the other biomarkers in all patients, patients with ACS, and those with CCS. Survival curves were constructed using the Kaplan-Meier method and compared using the log-rank test. Because of non-normal data distribution, we used log10-transformed CITP, BNP, hsTnT, H-FABP, and hsCRP values for Cox proportional hazard regression analyses. Cox proportional hazard regression analysis was used to determine independent predictors of primary and secondary endpoints. Multicollinearity was assessed using the variance inflation factor. Multivariate Cox proportional hazard regression analysis of Models 1, 6, and 7 was performed in a stepwise manner. Multivariate Cox proportional hazard regression Models 2, 3, 4, and 5 were adjusted for cardiovascular risk factors, coronary status, thrombotic risk factors, and bleeding risk factors, respectively.
Statistical significance was set at P<0.05. All statistical analyses were performed using a standard software package (JMP Pro Version 16.1.0 [SAS Institute, Cary, NC, USA]; R 3.0.2, with additional packages, including Rcmdr, Epi, and pROC).
Results
Baseline Characteristics of CAD Patients and Comparisons of Clinical Characteristics According to CITP Tertile
Baseline characteristics of the 621 patients are presented in Table 1. The mean patient age was 70 years, and 78% of patients were men. The study population included 260 patients with ACS and 361 with CCS. Multivessel disease was identified in 236 (38%) patients. PCI was performed in all patients, with a success rate of 97%. Hypertension, diabetes, dyslipidemia, a family history of CAD, and current smoking status were identified in 449 (72%), 262 (42%), 318 (51%), 105 (17%), and 166 (27%) patients, respectively. The median serum CITP level was 5.4 ng/mL.
Table 1.
Baseline Characteristics in All Patients and Comparisons of Baseline Clinical Characteristics Among CITP Tertiles in Patients With CAD
| |
All patients
(n=621) |
CITP tertile |
T1 (CITP ≤4.5 ng/mL;
n=212) |
T2 (CITP 4.6–6.4 ng/mL;
n=204) |
T3 (CITP ≥6.5 ng/mL;
n=205) |
| Age (years) |
70±11 |
67±10 |
70±12* |
73±10*,† |
| Men/women (n) |
483/138 |
170/42 |
162/42 |
151/54 |
| ACS/CCS (n) |
260/361 |
83/129 |
84/120 |
93/112 |
| Multivessel disease |
236 (38) |
75 (35) |
81 (40) |
80 (39) |
| Main culprit lesion (n) |
| LMT/LAD/LCX/RCA/others |
21/284/121/190/5 |
5/96/41/70/0 |
9/97/30/67/1 |
7/91/50/53/4 |
| Lesion type (n) |
| A/B/C |
137/335/149 |
59/105/48 |
40/117/47 |
38/113/54 |
| Successful revascularization |
605 (97) |
208 (98) |
197 (97) |
200 (97) |
| Stent implantation |
589 (95) |
203 (96) |
193 (95) |
193 (94) |
| IVUS use |
601 (97) |
206 (97) |
188 (97) |
197 (96) |
| Prior PCI |
130 (21) |
36 (17) |
48 (24) |
46 (22) |
| Prior MI |
97 (16) |
25 (12) |
35 (17) |
37 (18) |
| Hypertension |
449 (72) |
136 (64) |
152 (75) |
161 (79)‡ |
| Diabetes |
262 (42) |
86 (41) |
84 (41) |
92 (45) |
| Dyslipidemia |
318 (51) |
114 (54) |
118 (58) |
86 (42)‡ |
| Family history of CAD |
105 (17) |
48 (23) |
34 (17) |
23 (11)‡ |
| Smoking (n) |
| Current/past/non-smoker |
166/200/255 |
63/67/82 |
54/77/73 |
49/56/100 |
| Low body weight |
151 (24) |
39 (18) |
40 (20) |
72 (35)‡ |
| Atrial fibrillation |
101 (16) |
28 (13) |
27 (13) |
46 (22)‡ |
| Prior LEAD |
89 (14) |
22 (10) |
27 (13) |
40 (20)‡ |
| Severe CKD |
42 (6.8) |
0 (0) |
1 (0.5) |
41 (20)‡ |
| CKD |
232 (37) |
38 (18) |
70 (34) |
124 (60)‡ |
| Anemia |
294 (47) |
91 (29) |
88 (43) |
145 (71)‡ |
| Prior HF |
95 (15) |
6 (3) |
29 (14) |
60 (29)‡ |
| Biochemical data |
| CITP (ng/mL) |
5.4 [4.1–7.7] |
3.7 [3.1–4.1] |
5.4 [4.9–5.9] |
9.7 [7.7–14.7] |
| BNP (pg/mL) |
64 [25–186] |
36 [17–87] |
62 [23–148]* |
134 [51–473]*,† |
| hsTnT (ng/mL) |
0.034 [0.012–1.105] |
0.015 [0.008–0.846] |
0.025 [0.013–1.130]* |
0.091 [0.020–1.488]*,† |
| H-FABP (ng/mL) |
5.4 [3.4–12.4] |
4.0 [2.7–8.25] |
5.0 [3.3–8.9]* |
7.3 [4.6–35.6]*,† |
| eGFR (mL/min/1.73 m2) |
72±24 |
87±19 |
74±20* |
55±32*,† |
| Hemoglobin (g/dL) |
12.7±1.8 |
13.5±1.6 |
13.0±1.8* |
11.6±2.0*,† |
| hsCRP (pg/mL) |
0.190 [0.055–1.020] |
0.100 [0.039–0.542] |
0.174 [0.052–0.844]* |
0.527 [0.117–1.020]*,† |
| Echocardiogram |
| Left atrial diameter (mm) |
39±6 |
38±5 |
39±6 |
40±7* |
| LVEF (%) |
60±13 |
62±12 |
60±13 |
59±15* |
| LVEDD (mm) |
48±6 |
48±5 |
49±7 |
49±8 |
| LVMI (g/m2) |
153±41 |
146±34 |
152±40 |
163±48*,† |
| E/e′ ratio |
12.3±5.7 |
10.9±4.3 |
12.7±5.7* |
13.6±6.7* |
| Medication at discharge |
| Aspirin |
606 (98) |
210 (99) |
200 (98) |
196 (96) |
| P2Y12 inhibitors |
596 (96) |
205 (97) |
201 (99) |
190 (93)‡ |
| OACs or warfarin |
108 (17) |
29 (14) |
38 (19) |
41 (20) |
| Statins |
519 (84) |
194 (92) |
170 (83) |
155 (76)‡ |
| ACEi/ARBs |
449 (72) |
147 (69) |
157 (77) |
145 (71) |
| β-blockers |
328 (53) |
100 (47) |
113 (55) |
115 (56) |
| MRAs |
54 (9) |
5 (2) |
21 (10) |
28 (14)‡ |
| Diuretics |
78 (13) |
7 (3.3) |
23 (11) |
48 (23)‡ |
| Clinical outcomes |
| Target vessel revascularization |
26 (4.2) |
7 (3.3) |
8 (3.9) |
11 (5.4) |
| Target vessel ACS |
5 (0.8) |
2 (0.9) |
1 (0.5) |
2 (1) |
| Non-target vessel ACS |
9 (1.5) |
3 (1.4) |
5 (2.5) |
1 (0.5) |
| Bleeding events |
24 (3.8) |
7 (3.3) |
9 (4.4) |
8 (3.9) |
Unless indicated otherwise, data are expressed as the mean±SD, n (%), or median [interquartile range]. *P<0.05 compared with Tertile (T) 1; †P<0.05 compared with T2 (analysis of variance with Tukey-Kramer test); ‡P<0.05 compared with T1 (Chi-squared test). ACEi, angiotensin-converting enzyme inhibitor; ACS, acute coronary syndrome; ARBs, angiotensin II receptor blockers; BNP, B-type natriuretic peptide; CAD, coronary artery disease; CCS, chronic coronary syndrome; CITP, carboxyl-terminal telopeptide of type I collagen; CKD, chronic kidney disease; E/e′ ratio, the ratio of the mitral inflow E wave to the tissue Doppler e′ wave; eGFR, estimated glomerular filtration rate; H-FABP, heart-type fatty acid-binding protein; HF, heart failure; hsCRP, high-sensitivity C-reactive protein; hsTnT, high-sensitivity troponin T; IVUS, intravascular ultrasound; LAD, left anterior descending artery; LCX, left circumflex artery; LEAD, lower extremity artery disease; LMT, left main trunk; LVEDD, left ventricular end-diastolic dimension; LVEF, left ventricular ejection fraction; LVMI, left ventricular mass index; MI, myocardial infarction; MRA, mineralocorticoid receptor antagonists; OAC, oral anticoagulant; PCI, percutaneous coronary intervention; RCA, right coronary artery.
As shown in Figure 1, patients were divided into 3 CITP tertiles: T1, CITP ≤4.5 ng/mL (n=212); T2, CITP, 4.6–6.4 ng/mL (n=204); and T3, CITP ≥6.5 ng/mL (n=205). As indicated in Table 1, patients in T3 were older, had a higher prevalence of hypertension, low body weight, AF, prior LEAD, severe CKD, anemia, and prior HF, and a lower prevalence of dyslipidemia and a family history of CAD than patients in T1 and T2. Patients in T3 had higher BNP, hsTnT, H-FABP, hsCRP, and LVMI concentrations, and lower eGFR and hemoglobin levels than patients in T1 and T2. Echocardiograms showed higher left atrial diameter, LVEDD, and E/e′ ratio and lower LVEF in T3 compared with T1. There were no significant differences in target vessel revascularization, target vessel ACS, non-target ACS, and bleeding events among the 3 groups. Patients in T3 had significantly higher BNP and LVMI independent of clinical presentation. Notably, BNP, hsTnT, and H-FABP levels increased with increasing CITP tertile in patients with CCS (Figure 2).

Because CITP levels reportedly differ by clinical presentation,8 we compared the levels of cardiac biomarkers between patients with ACS and those with CCS. BNP, hsTnT, and H-FABP levels were significantly higher in patients with ACS than in those with CCS (Supplementary Figure 1A–C). In contrast, CITP levels did not differ significantly between patients with ACS and those with CCS (Supplementary Figure 1D). Serum CITP levels were significantly higher in patients with than without myocardial injury (Supplementary Figure 1E,F). We also compared serum CITP concentrations according to the presence of hypertension, AF, LEAD, severe CKD, and prior HF. Serum CITP concentrations increased in the presence of these conditions (Supplementary Figure 2).
CITP and Clinical Outcomes
During the study period, there were 81 HF-related events, 45 all-cause deaths, and 69 HF rehospitalizations. To compare the prognostic capacity of CITP levels with that of cardiac biomarkers, we created receiver operating characteristic curves for HF-related events. As shown in Supplementary Figure 3 and Table 2, the C-indices of CITP levels for predicting the primary and HF rehospitalization endpoints were significantly greater than those of hsTnT levels, but not those of BNP or H-FABP levels, in all patients and in those with ACS. Interestingly, abnormal cut-off values in cardiac biomarkers differed according to setting, such as ACS and CCS, and the cut-off CITP values were similar between patients with ACS and those with CCS (Table 2).
Table 2.
C-Indices for Primary and Secondary Endpoints in Patients With CAD
| |
All patients |
ACS |
CCS |
| C index |
Cut-off value |
C index |
Cut-off value |
C index |
Cut-off value |
| Primary endpointA |
| CITP |
0.759* (0.709–8.110) |
6.4 ng/mL |
0.764* (0.683–0.846) |
6.4 ng/mL |
0.759 (0.694–0.824) |
5.2 ng/mL |
| BNP |
0.774* (0.717–0.829) |
265 pg/mL |
0.764* (0.675–0.852) |
147 pg/mL |
0.782 (0.709–0.855) |
99.5 pg/mL |
| hsTnT |
0.614 (0.558–0.675) |
0.015 ng/mL |
0.544 (0.451–0.636) |
0.679 ng/mL |
0.699 (0.615–0.778) |
0.012 ng/mL |
| H-FABP |
0.693* (0.635–0.752) |
4.9 ng/mL |
0.691* (0.601–0.783) |
34.4 ng/mL |
0.707 (0.627–0.788) |
4.7 ng/mL |
| Secondary endpoints |
| All-cause death |
| CITP |
0.669 (0.583–0.756) |
6.4 ng/mL |
0.692* (0.565–0.819) |
8.4 ng/mL |
0.646 (0.528–0.764) |
6.4 ng/mL |
| BNP |
0.646 (0.562–0.728) |
79.8 pg/mL |
0.643 (0.521–0.764) |
133.2 pg/mL |
0.623 (0.500–0.746) |
46 pg/mL |
| hsTnT |
0.622 (0.555–0.700) |
0.025 ng/mL |
0.516 (0.407–0.625) |
0.202 ng/mL |
0.684 (0.565–0.802) |
0.025 ng/mL |
| H-FABP |
0.621 (0.535–0.708) |
7.8 ng/mL |
0.569 (0.570–0.698) |
18.7 ng/mL |
0.643 (0.512–0.773) |
7.3 ng/mL |
| HF rehospitalization |
| CITP |
0.761*,† (0.709–0.814) |
5.1 ng/mL |
0.770*,† (0.687–0.852) |
6.3 ng/mL |
0.758 (0.689–0.827) |
5.1 ng/mL |
| BNP |
0.784*,† (0.726–0.843) |
263 pg/mL |
0.786*,† (0.696–0.877) |
273 pg/mL |
0.793 (0.718–0.868) |
261 pg/mL |
| hsTnT |
0.589 (0.527–0.650) |
0.014 ng/mL |
0.515 (0.419–0.612) |
2.39 ng/mL |
0.691 (0.603–0.779) |
0.011 ng/mL |
| H-FABP |
0.655* (0.592–0.718) |
4.8 ng/mL |
0.610 (0.509–0.710) |
4.8 ng/mL |
0.695 (0.608–0.782) |
4.6 ng/mL |
AThe primary endpoint was a composite of hospitalization for HF or cardiovascular death. *P<0.05 compared with hsTnT; †P<0.05 compared with H-FABP. Abbreviations as in Table 1.
Kaplan-Meier analysis revealed that among the CITP tertiles, T3 had the greatest risk of primary and secondary endpoints (Figure 3A–C). Similar results were obtained in subgroup analyses of patients with ACS (Figure 3D–F) and CCS (Figure 3G–I).

Univariate and multivariate Cox proportional hazard regression analyses were performed to determine the risk of the primary event. Univariate Cox proportional hazard regression analysis revealed that CITP level was significantly associated with HF-related events. Furthermore, age, multivessel disease, left main trunk and left anterior descending artery lesion, diabetes, low body weight, AF, prior LEAD, severe CKD, anemia, prior HF, BNP, hsTnT, H-FABP, hsCRP, eGFR, hemoglobin, left atrial diameter, LVEF, LVEDD, LVMI, and the E/e′ ratio were associated with the primary event (Table 3). Multivariate Cox proportional hazards regression analysis demonstrated that CITP level was an independent predictor of the primary event after adjusting for confounding factors (Table 4). Similarly, among the CITP tertiles, T3 had the greatest risk for the primary endpoint in the multivariate Cox proportional hazard regression analysis (Table 4). This association was maintained in the subgroups analyses of patients with ACS or CCS (Figure 4).
Table 3.
Univariate Cox Proportional Hazard Regression Analyses for Primary and Secondary Endpoints in Patients With CAD
| |
Primary endpointA |
All-cause death |
HF rehospitalization |
| HR (95% CI) |
P value |
HR (95% CI) |
P value |
HR (95% CI) |
P value |
| Age |
1.03 (1.01–1.05) |
0.0084 |
1.05 (1.02–1.08) |
0.0024 |
1.04 (1.01–1.06) |
0.0025 |
| Male vs. female sex |
1.23 (0.72–2.22) |
0.4676 |
0.68 (0.37–1.38) |
0.2626 |
1.10 (0.63–2.05) |
0.7595 |
| ACS/CCS |
1.29 (0.83–1.99) |
0.2608 |
1.81 (1.01–3.29) |
0.0484 |
1.12 (0.69–1.80) |
0.6239 |
| Multivessel disease |
1.67 (1.08–2.58) |
0.0225 |
1.22 (0.66–2.21) |
0.5094 |
1.48 (0.91–2.37) |
0.1113 |
| Main culprit lesion |
| LMT and LAD vs. LCX, RCA, and others |
1.59 (1.03–2.50) |
0.0392 |
1.05 (0.58–1.89) |
0.8624 |
1.61 (1.00–2.63) |
0.0494 |
| Revascularization |
0.41 (0.18–1.17) |
0.0553 |
1.24 (0.27–21.95) |
0.8267 |
0.60 (0.22–2.40) |
0.4184 |
| Stent implantation |
0.49 (0.25–1.12) |
0.0868 |
1.18 (0.36–7.24) |
0.8131 |
0.57 (0.27–1.47) |
0.2220 |
| IVUS use |
0.48 (0.21–1.36) |
0.1492 |
1.38 (0.30–24.41) |
0.7381 |
0.40 (0.18–1.15) |
0.0832 |
| Prior PCI |
1.33 (0.78–2.16) |
0.2838 |
1.19 (0.56–2.32) |
0.6278 |
1.23 (0.68–2.10) |
0.4793 |
| Prior MI |
1.48 (0.83–2.44) |
0.1764 |
0.86 (0.33–1.88) |
0.7236 |
1.28 (0.67–2.27) |
0.4287 |
| Hypertension |
1.49 (0.89–2.63) |
0.1293 |
1.30 (0.64–2.54) |
0.5441 |
1.56 (0.89–2.91) |
0.1236 |
| Diabetes |
1.70 (1.10–2.64) |
0.0177 |
1.14 (0.63–2.06) |
0.6474 |
1.39 (0.86–2.23) |
0.1736 |
| Dyslipidemia |
0.66 (0.42–1.03) |
0.0670 |
0.66 (0.36–1.19) |
0.1699 |
0.66 (0.41–1.07) |
0.0910 |
| Family history of CAD |
1.05 (0.58–1.79) |
0.8663 |
0.57 (0.20–1.32) |
0.2066 |
0.97 (0.50–1.74) |
0.9252 |
| Smoking |
| Current vs. non-smoker |
0.79 (0.45–1.33) |
0.3722 |
0.38 (0.14–0.88) |
0.0233 |
0.77 (0.43–1.35) |
0.3740 |
| Past vs. non-smoker |
0.73 (0.43–1.23) |
0.2377 |
0.99 (0.52–1.86) |
0.9719 |
0.69 (0.39–1.20) |
0.1922 |
| Low body weight |
1.86 (1.16–2.92) |
0.0107 |
3.21 (1.77–5.78) |
0.0002 |
2.14 (1.30–3.46) |
0.0033 |
| Atrial fibrillation |
3.61 (2.28–5.64) |
<0.0001 |
1.37 (0.59–2.80) |
0.4309 |
4.49 (2.76–7.22) |
<0.0001 |
| Prior LEAD |
2.30 (1.35–3.74) |
0.0028 |
1.58 (0.68–3.22) |
0.2631 |
2.50 (1.42–4.20) |
0.0021 |
| Severe CKD |
4.35 (2.39–7.43) |
<0.0001 |
3.75 (1.53–7.91) |
0.0060 |
4.55 (2.38–8.08) |
<0.0001 |
| CKD |
3.62 (2.30–5.79) |
<0.0001 |
2.03 (1.13–3.67) |
0.0182 |
3.18 (1.97–5.24) |
<0.0001 |
| Anemia |
3.45 (2.15–5.76) |
<0.0001 |
4.11 (2.15–8.52) |
<0.0001 |
3.69 (2.20–6.49) |
<0.0001 |
| Prior HF |
4.75 (3.03–7.37) |
<0.0001 |
1.25 (0.52–2.64) |
0.5938 |
6.07 (3.76–9.74) |
<0.0001 |
| Log10[CITP]B |
1.89 (1.61–2.19) |
<0.0001 |
1.72 (1.36–2.12) |
<0.0001 |
1.94 (1.63–2.27) |
<0.0001 |
| CITP tertile |
| T3 vs. T1 |
11.35 (5.30–29.50) |
<0.0001 |
4.92 (2.27–12.28) |
<0.0001 |
14.40 (5.85–47.77) |
<0.0001 |
| T2 vs. T1 |
3.74 (1.59–10.23) |
0.0019 |
1.78 (0.70–4.84) |
0.2255 |
5.36 (2.01–48.48) |
0.0004 |
| Log10[BNP]B |
2.77 (2.20–3.50) |
<0.0001 |
1.81 (1.35–2.44) |
<0.0001 |
2.96 (2.31–3.83) |
<0.0001 |
| Log10[hsTnT]B |
1.35 (1.09–1.67) |
0.0049 |
1.39 (1.04–1.85) |
0.0246 |
2.33 (0.98–1.56) |
0.0696 |
| Log10[H-FABP]B |
1.73 (1.45–2.04) |
<0.0001 |
1.50 (1.15–1.91) |
0.0015 |
1.52 (1.24–1.85) |
<0.0001 |
| eGFRB |
0.54 (0.45–0.65) |
<0.0001 |
0.85 (0.65–1.13) |
0.2682 |
0.55 (0.45–0.68) |
<0.0001 |
| HemoglobinB |
0.53 (0.44–0.65) |
<0.0001 |
0.49 (0.37–0.64) |
<0.0001 |
0.49 (0.39–0.61) |
<0.0001 |
| Log10[hsCRP]B |
1.68 (1.32–2.18) |
<0.0001 |
1.66 (1.21–2.36) |
0.0028 |
1.54 (1.19–2.02) |
0.0012 |
| Left atrial diameterB |
1.84 (1.47–2.27) |
<0.0001 |
1.07 (0.76–1.49) |
0.7135 |
1.88 (1.49–2.34) |
<0.0001 |
| LVEFB |
0.62 (0.50–0.76) |
<0.0001 |
0.98 (0.72–1.37) |
0.8815 |
0.64 (0.52–0.81) |
<0.0001 |
| LVEDDB |
1.39 (1.12–1.71) |
0.0021 |
0.67 (0.46–0.98) |
0.0434 |
1.36 (1.07–1.69) |
0.0087 |
| LVMIB |
1.41 (1.14–1.73) |
0.0011 |
1.01 (0.71–1.38) |
0.9620 |
1.44 (1.15–1.78) |
0.0011 |
| E/e′ ratioB |
1.50 (1.25–1.75) |
<0.0001 |
1.38 (1.03–1.74) |
0.0160 |
1.52 (1.27–1.79) |
<0.0001 |
| ACEi or ARBs |
0.82 (0.52–1.35) |
0.4221 |
0.61 (0.33–1.15) |
0.1212 |
0.91 (0.54–1.58) |
0.7216 |
| β-blockers |
2.10 (1.33–3.42) |
0.0014 |
0.69 (0.38–1.24) |
0.2169 |
2.47 (1.48–4.29) |
0.0008 |
| MRAs |
1.39 (0.68–2.58) |
0.3445 |
0.45 (0.08–1.46) |
0.2131 |
1.68 (0.81–3.13) |
0.1554 |
| Diuretics |
3.98 (2.49–6.24) |
<0.0001 |
0.75 (0.23–1.86) |
0.5694 |
4.86 (2.96–7.84) |
<0.0001 |
AThe primary endpoint was a composite of hospitalization for HF or cardiovascular death. BPer 1-SD increase. CI, confidence interval; HR, hazard ratio. Other abbreviations as in Table 1.
Table 4.
HRs for CITP in the Multivariate Cox Proportional Hazard Regression Analysis for Primary and Secondary Endpoints in Patients With CAD
| |
CITP tertile |
Log10CITPA |
P value |
| T1 |
T2 |
T3 |
| Primary endpointB |
| Model 1 |
1.00 |
3.14 (1.31–8.69)* |
5.57 (2.40–15.20)*,† |
1.61 (1.22–2.11) |
0.0007 |
| Model 2 |
1.00 |
3.75 (1.59–10.31)* |
10.44 (4.77–27.53)*,† |
1.55 (1.28–1.89) |
<0.0001 |
| Model 3 |
1.00 |
3.42 (1.45–9.37)* |
10.86 (5.01–28.42)*,† |
1.89 (1.59–2.22) |
<0.0001 |
| Model 4 |
1.00 |
2.89 (1.22–7.98)* |
5.70 (2.49–15.45)*,† |
1.68 (1.26–2.25) |
0.0004 |
| Model 5 |
1.00 |
3.20 (1.34–8.84)* |
5.70 (2.46–15.59)*,† |
1.66 (1.23–2.24) |
0.0008 |
| Secondary endpoints |
| All-cause death |
| Model 6 |
1.00 |
1.42 (0.55–3.93) |
2.87 (1.23–7.55)*,† |
1.59 (1.20–2.05) |
0.0007 |
| HF rehospitalization |
| Model 7 |
1.00 |
4.10 (1.52–14.22)* |
4.97 (1.86–17.29)* |
1.30 (1.04–1.63) |
0.0222 |
Unless indicated otherwise, data are given as hazard ratios with 95% confidence intervals in parentheses. *P<0.05 compared with Tertile (T) 1; †P<0.05 compared with T2. APer 1-SD increase. BThe primary endpoint was a composite of hospitalization for HF or cardiovascular death. Model 1 includes sex, left main trunk and left anterior descending artery lesion, atrial fibrillation, severe CKD, prior HF, BNP, and heart-type fatty acid-binding protein, which were selected in a stepwise manner. Model 2 includes age, sex, and cardiovascular risk factors, such as hypertension, diabetes, dyslipidemia, family history of CAD, and smoking. Model 3 includes age, sex, and coronary status, such as ACS, multivessel disease, culprit lesion, lesion type, and revascularization. Model 4 includes age, sex, and major components of the Japanese version of high bleeding risk, such as low body weight, prior LEAD, severe CKD, anemia, and prior HF. Model 5 includes thrombotic risk factors such as high age, ACS, lesion type, prior PCI, diabetes, smoking, atrial fibrillation, prior LEAD, severe CKD, anemia, and prior HF. Model 6 includes low body weight, anemia, prior HF, and hsCRP, which were selected in a stepwise manner. Model 7 includes sex, atrial fibrillation, prior LEAD, prior HF, BNP, and hemoglobin, which were selected in a stepwise manner. Abbreviations as in Table 1.
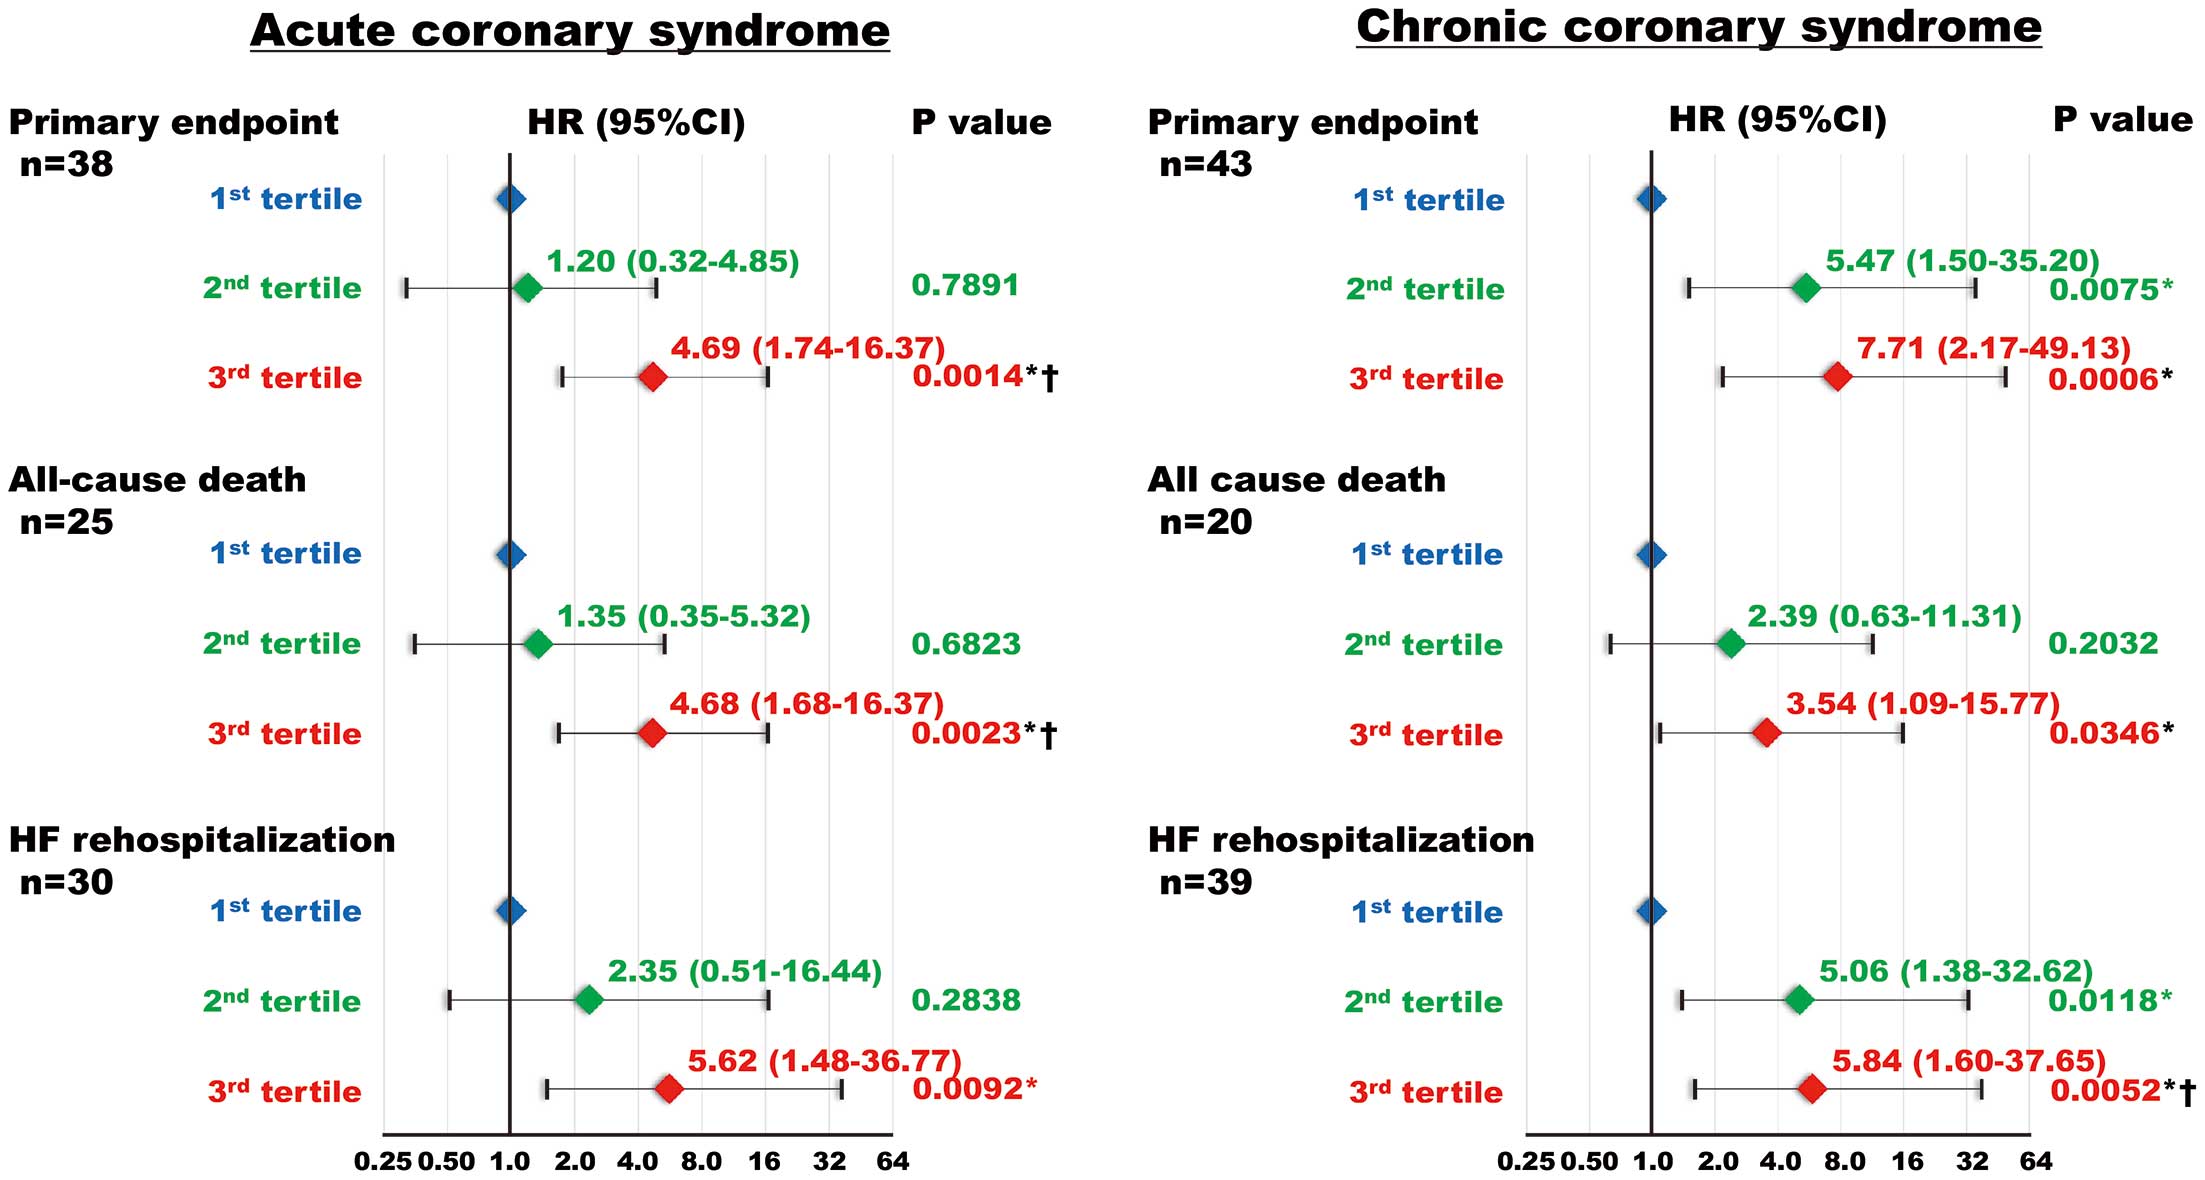
Univariate and multivariate Cox proportional hazard regression analyses were performed to determine the risk of the secondary endpoints. Univariate Cox proportional hazard regression analysis revealed that CITP levels were significantly associated with the secondary endpoints. Furthermore, age, low body weight, severe CKD, anemia, BNP, H-FABP, hemoglobin, and hsCRP levels, and the E/e′ ratio were associated with the secondary endpoints (Table 3). Multivariate Cox proportional hazard regression analysis demonstrated that CITP was an independent predictor of secondary endpoints after adjusting for confounding risk factors (Table 4). Similarly, among the CITP tertiles, T3 had the greatest risk for the secondary endpoints in the multivariate Cox proportional hazard regression analysis (Table 4).
Discussion
The novel findings of the present study are that: (1) the T3 group had higher BNP levels and LVMI than the T1 and T2 groups; (2) the C-index of CITP for the primary and secondary endpoints was comparable to those of BNP and H-FABP in patients with CAD; (3) unlike other cardiac biomarkers, abnormal cut-off CITP values were equivalent between patients with ACS and those with CCS; (4) Kaplan-Meier analysis demonstrated that CAD patients in T3 had the greatest risk of both the primary and secondary endpoints, independent of ACS or CCS; and (5) multivariate Cox proportional hazard regression analysis demonstrated that CAD patients in T3 had the highest hazard ratios for both the primary and secondary endpoints . Our results raise the possibility that CITP is a feasible marker of clinical outcomes in patients with CAD, regardless of ACS or CCS.
CITP in CAD
Because CITP is a collagen degradation marker in the heart and blood vessels, elevated CITP levels reflect pre-existing fibrosis in patients with CAD. In the present study, the T3 group showed persistently elevated CITP levels at follow-up coronary angiography (Supplementary Figure 4) and a higher prevalence of hypertension, AF, prior LEAD, severe CKD, and prior HF, despite similar coronary artery disease severity. Conversely, serum CITP levels were elevated in these settings (Supplementary Figure 2). These findings indicate the possibility that serum CITP is derived from atrial, ventricular, and vascular fibrosis and atherosclerotic lesions from peripheral arteries, not merely from coronary atherosclerosis. Several studies have investigated the clinical importance of CITP levels in the setting of hypertension, AF, LEAD, CKD, and HF.
Hypertension generally induces fibrosis of the heart and vasculature. CITP levels have been reported to increase in relation to collagen type I synthesis in patients with hypertension and stiffer arteries, as assessed by aortic pulse wave velocity and the augmentation index.18 Among patients with hypertension, serological evidence of an active fibrotic process was frequently observed in patients with more severe diastolic dysfunction.19 The changes in collagen I turnover favoring its increased degradation reportedly contribute to the LV radial and global systolic dysfunction seen in advanced hypertensive heart disease.20 Therefore, CITP reflects vascular and heart collagen degradation in patients with hypertension, which is potentially involved in cardiac and vascular remodeling and function.
AF is associated with fibrotic processes in both atria and ventricles.21 CITP levels were higher in patients with persistent AF than in control participants.22 In the Multi-Ethnic Study of Atherosclerosis (MESA), elevated CITP levels were associated with the incidence of AF.23 CITP levels have been shown to be proportional to pulmonary capillary wedge pressure and C-reactive protein levels in patients with chronic HF and AF.24 Recent reports defined collagen cross-linking, which stiffens the fibrils, as a decreased CITP/matrix metalloproteinase-1 ratio and related it to the onset of AF and AF recurrence after ablation.25 These findings suggest that CITP participates in the pathophysiology of AF.
LEAD is characterized by atherosclerosis of the peripheral arteries. We have reported that CITP levels are significantly associated with the severity and clinical outcomes of LEAD.15 Serum CITP levels have been reported to be independently associated with peripheral pulse wave velocity in patients with chronic HF.26 These reports indicate a possible link between altered collagen metabolism and peripheral vascular stiffness. Thus, prior LEAD may be a cause of elevated CITP levels.
Circulating CITP is excreted by glomerular filtration in the kidney.27,28 Thus, we could not exclude the possibility that renal excretion may have affected serum CITP levels in the present study. In patients with IgA nephropathy, CITP levels were similar between CKD stages 1–2 and stages 3–5. However, carotid-femoral pulse wave velocity, aortic pulse pressure, and LVMI showed strong positive correlations with CITP.29 In patients with CKD and HF with preserved ejection fraction (HFpEF), CKD facilitates malignant myocardial fibrosis associated with severe diastolic dysfunction as assessed by the CITP/matrix metalloproteinase-1 ratio.30 These reports indicate that high CITP levels are related to vascular stiffness and LV remodeling in patients with CKD.
The failing heart exhibits cardiac fibrosis. Repeated micro myocardial injury generally leads to collagen deposition and fibrosis, which increase the risk of HF. An increase in cardiac TnT levels over 3 years was significantly associated with CITP elevation at follow-up.31 In MESA, elevated circulating CITP levels appeared to be associated with incident HFpEF.32 The Cardiovascular Health Study also indicated that elevated circulating CITP levels were associated with incident HF in elderly subjects with cardiovascular risk factors and no previous HF.33 A report showed CITP had good predictive value for diastolic dysfunction and HFpEF in patients with HT.34 These findings raise the possibility that CITP could be useful in the diagnosis of HFpEF. A predominance of collagen degradation over synthesis results in matrix tensile strength that can be responsible for ventricular dilatation and systolic dysfunction in patients with chronic HF.35 Thus, collagen biomarkers may be correlated with the incidence of HF. In outpatients with chronic HF, increased CITP levels were associated with self-assessed health status.36 In patients with acute decompensation of chronic HF, CITP levels were significantly higher at discharge than at admission.37 Thus, HF exacerbation may cause CITP elevation.
Collectively, CITP levels increased in response to collagen degradation in the heart and vasculature in the setting of hypertension, AF, LEAD, CKD, and HF. The T3 group also exhibited severe LV remodeling. CITP elevation in CAD may be plausibly augmented by comorbidities resulting from collagen degradation in the heart and vasculature, as well as atherosclerosis in the coronary artery.
Importantly, the CITP level was independently associated with HF-related events after adjusting for these covariates. One report showed an association between CITP levels and short-term cardiovascular events in patients with AMI.12 CITP levels predicted cardiac events in patients with HFpEF.38 In the OPTIMAL project study, CITP levels were reportedly an independent prognostic factor for all-cause and cardiovascular mortality in elderly patients with HF with reduced ejection fraction.39 Serum CITP concentrations have been suggested to be an additional prognostic indicator of N-terminal pro BNP levels and an independent and strong prognostic marker for survival in patients with chronic HF.40 These findings support our hypothesis that CITP could be a prognostic marker for HF-related events in patients with CAD who undergo PCI.
CITP and Medications
Several studies have investigated the effects of medications on circulating CITP levels. Bisoprolol has been reported to reduce circulating CITP levels, but not levels of collagen synthesis markers, and is related to reverse remodeling in patients with chronic HF, suggesting that β-blockers gradually inhibit collagen degradation.41 Intriguingly, an improvement in LVEF after β-blocker administration was proportional to the reduction in CITP levels. Conversely, angiotensin AT1
receptor blockers and aldosterone blockers reportedly failed to decrease serum CITP levels.42–44 No changes in CITP levels were observed in patients with moderate-to-severe chronic HF receiving diuretic therapy, indicating that loop diuretics did not affect serum CITP levels.28 Beta-blockers are the Class I recommended drugs in patients with CAD. CITP may help identify β-blocker responders among patients with CAD. Further studies are required to determine whether CITP levels can provide additional information for the treatment and management of patients with CAD.
Study Limitations
First, because this was a single-center study, the sample size was relatively small. Second, the pathology of ACS could not be identified because intravascular ultrasound-guided PCI was performed. Generally, intravascular ultrasound cannot identify the precise pathology of ACS owing to its low resolution. Patients with ACS caused by plaque rupture may have higher CITP levels than those without this form of ACS. Third, we did not measure the levels of collagen synthesis markers and matrix metalloproteinases in this study. Therefore, we could not determine the mechanisms related to collagen metabolism and cross-linking in patients with CAD. Due to the lack of the autopsy or biopsy samples, we could not determine the association between serum CITP levels and the degree of cardiac fibrosis in patients with CAD. Fourth, the thrombotic and bleeding event rates were relatively low. Follow-up coronary angiography was performed in 81% of patients at 6–12 months. The duration of dual-antiplatelet therapy was determined after follow-up coronary angiography. This may have contributed to the low rates of thrombotic and bleeding events. Fifth, the optimal cut-off value for CITP remains unclear. Further studies with larger sample sizes are required to establish this value. Finally, the normal ranges of fibrosis markers, including CITP, were not confirmed. However, CITP levels ranged from 1.8 to 9.7 ng/mL in previous studies. Thus, our results are almost consistent with those of previous reports.7
Conclusions
We demonstrated that CITP levels are associated with clinical outcomes in patients with CAD. Further clinical and experimental studies are required to determine the precise role of collagen degradation markers in the development and progression of CAD.
Sources of Funding
This study did not receive any specific funding.
Disclosures
All authors declare no conflicts of interest for this contribution.
IRB Information
This study was approved by the Institutional Ethics Committee of Yamagata University School of Medicine (first and updated IRB numbers: H20-62 and 2024-313).
Supplementary Files
Please find supplementary file(s);
https://doi.org/10.1253/circj.CJ-25-0067
References
- 1.
Timmis A, Vardas P, Townsend N, Torbica A, Katus H, De Smedt D, et al. European Society of Cardiology: Cardiovascular disease statistics 2021. Eur Heart J 2022; 43: 716–799.
- 2.
Byrne RA, Rossello X, Coughlan JJ, Barbato E, Berry C, Chieffo A, et al. 2023 ESC guidelines for the management of acute coronary syndromes. Eur Heart J 2023; 44: 3720–3826.
- 3.
Vrints C, Andreotti F, Koskinas KC, Rossello X, Adamo M, Ainslie J, et al. 2024 ESC guidelines for the management of chronic coronary syndromes. Eur Heart J 2024; 45: 3415–3537.
- 4.
Martin SS, Aday AW, Almarzooq ZI, Anderson CAM, Arora P, Avery CL, et al. 2024 heart disease and stroke statistics: A report of US and global data from the American Heart Association. Circulation 2024; 149: e347–e913.
- 5.
Frantz S, Hundertmark MJ, Schulz-Menger J, Bengel FM, Bauersachs J. Left ventricular remodelling post-myocardial infarction: Pathophysiology, imaging, and novel therapies. Eur Heart J 2022; 43: 2549–2561.
- 6.
de Boer RA, De Keulenaer G, Bauersachs J, Brutsaert D, Cleland JG, Diez J, et al. Towards better definition, quantification and treatment of fibrosis in heart failure. A scientific roadmap by the Committee of Translational Research of the Heart Failure Association (HFA) of the European Society of Cardiology. Eur J Heart Fail 2019; 21: 272–285.
- 7.
Rubiś PP, Dziewieçka E, González A, Cleland JGF. High variability in assays of blood markers of collagen turnover in cardiovascular disease: Implications for research and clinical practice. Eur J Heart Fail 2024, doi:10.1002/ejhf.3375.
- 8.
Deng Y, Chen LH, Wang XB, Song XD, Ling YN, Chen AH, et al. [Changes in serum level of carboxy-terminal telopeptide of type I collagen in patients with coronary heart disease. Nan Fang Yi Ke Da Xue Xue Bao 2015; 35: 506–510 (in Chinese).
- 9.
Kato S, Endo I, Fujimura M, Kuriwaka-Kido R, Fujinaka Y, Aihara K, et al. Serum carboxy-terminal telopeptide of type I collagen (ICTP) as a surrogate marker for vulnerable plaques in atherosclerotic patients: A pilot study. Atherosclerosis 2013; 229: 182–185.
- 10.
McGavigan AD, Maxwell PR, Dunn FG. Serological evidence of altered collagen homeostasis reflects early ventricular remodeling following acute myocardial infarction. Int J Cardiol 2006; 111: 267–274.
- 11.
Cerisano G, Pucci PD, Sulla A, Tommasi M, Raspanti S, Santoro GM, et al. Relation between plasma brain natriuretic peptide, serum indexes of collagen type I turnover, and left ventricular remodeling after reperfused acute myocardial infarction. Am J Cardiol 2007; 99: 651–656.
- 12.
Barthelemy O, Beygui F, Vicaut E, Rouanet S, Van Belle E, Baulac C, et al. Relation of high concentrations of plasma carboxy-terminal telopeptide of collagen type I with outcome in acute myocardial infarction. Am J Cardiol 2009; 104: 904–909.
- 13.
Kikuchi M, Tahara Y, Yamaguchi J, Nakashima T, Nomura O, Tanaka A, et al. Executive summary: Acute coronary syndrome in the Japan Resuscitation Council guidelines for resuscitation 2020. Circ J 2023; 87: 866–878.
- 14.
Fujiyoshi A, Kohsaka S, Hata J, Hara M, Kai H, Masuda D, et al. JCS 2023 Guideline on the primary prevention of coronary artery disease. Circ J 2024; 88: 763–842.
- 15.
Otaki Y, Watanabe T, Takahashi H, Yamaura G, Nishiyama S, Arimoto T, et al. Serum carboxy-terminal telopeptide of type I collagen (I-CTP) is predictive of clinical outcome in peripheral artery disease patients following endovascular therapy. Heart Vessels 2017; 32: 149–156.
- 16.
Matsuo S, Imai E, Horio M, Yasuda Y, Tomita K, Nitta K, et al. Revised equations for estimated GFR from serum creatinine in Japan. Am J Kidney Dis 2009; 53: 982–992.
- 17.
Nakamura M, Kimura K, Kimura T, Ishihara M, Otsuka F, Kozuma K, et al. JCS 2020 guideline focused update on antithrombotic therapy in patients with coronary artery disease. Circ J 2020; 84: 831–865.
- 18.
McNulty M, Mahmud A, Spiers P, Feely J. Collagen type-I degradation is related to arterial stiffness in hypertensive and normotensive subjects. J Hum Hypertens 2006; 20: 867–873.
- 19.
Martos R, Baugh J, Ledwidge M, O’Loughlin C, Conlon C, Patle A, et al. Diastolic heart failure: Evidence of increased myocardial collagen turnover linked to diastolic dysfunction. Circulation 2007; 115: 888–895.
- 20.
Plaksej R, Kosmala W, Frantz S, Herrmann S, Niemann M, Stork S, et al. Relation of circulating markers of fibrosis and progression of left and right ventricular dysfunction in hypertensive patients with heart failure. J Hypertens 2009; 27: 2483–2491.
- 21.
Dzeshka MS, Lip GY, Snezhitskiy V, Shantsila E. Cardiac fibrosis in patients with atrial fibrillation: Mechanisms and clinical implications. J Am Coll Cardiol 2015; 66: 943–959.
- 22.
Liu L, Su J, Li R, Luo F. Changes in intestinal flora structure and metabolites are associated with myocardial fibrosis in patients with persistent atrial fibrillation. Front Nutr 2021; 8: 702085.
- 23.
Duprez DA, Heckbert SR, Alonso A, Gross MD, Ix JH, Kizer JR, et al. Collagen biomarkers and incidence of new onset of atrial fibrillation in subjects with no overt cardiovascular disease at baseline: The Multi-Ethnic Study of Atherosclerosis. Circ Arrhythm Electrophysiol 2018; 11: e006557.
- 24.
Lofsjogard J, Persson H, Diez J, Lopez B, Gonzalez A, Edner M, et al. Atrial fibrillation and biomarkers of myocardial fibrosis in heart failure. Scand Cardiovasc J 2014; 48: 299–303.
- 25.
Ravassa S, Ballesteros G, Lopez B, Ramos P, Bragard J, Gonzalez A, et al. Combination of circulating type I collagen-related biomarkers is associated with atrial fibrillation. J Am Coll Cardiol 2019; 73: 1398–1410.
- 26.
Chatzikyriakou SV, Tziakas DN, Chalikias GK, Stakos DA, Thomaidi AK, Mitrousi K, et al. Serum levels of collagen type-I degradation markers are associated with vascular stiffness in chronic heart failure patients. Eur J Heart Fail 2008; 10: 1181–1185.
- 27.
Lopez B, Gonzalez A, Varo N, Laviades C, Querejeta R, Diez J. Biochemical assessment of myocardial fibrosis in hypertensive heart disease. Hypertension 2001; 38: 1222–1226.
- 28.
Lopez B, Querejeta R, Gonzalez A, Sanchez E, Larman M, Diez J. Effects of loop diuretics on myocardial fibrosis and collagen type I turnover in chronic heart failure. J Am Coll Cardiol 2004; 43: 2028–2035.
- 29.
Sagi B, Vas T, Jakabfi-Csepregi R, Horvath-Szalai Z, Koszegi T, Csiky B, et al. The role of two heart biomarkers in IgA nephropathy. Int J Mol Sci 2023; 24: 10336.
- 30.
Eiros R, Romero-Gonzalez G, Gavira JJ, Beloqui O, Colina I, Fortun Landecho M, et al. Does chronic kidney disease facilitate malignant myocardial fibrosis in heart failure with preserved ejection fraction of hypertensive origin? J Clin Med 2020; 9: 404.
- 31.
Kop WJ, Gottdiener JS, deFilippi CR, Barasch E, Seliger SL, Jenny NS, et al. Cardiac microinjury measured by troponin T predicts collagen metabolism in adults aged ≥65 years with heart failure. Circ Heart Fail 2012; 5: 406–413.
- 32.
Duprez DA, Gross MD, Kizer JR, Ix JH, Hundley WG, Jacobs DR Jr. Predictive value of collagen biomarkers for heart failure with and without preserved ejection fraction: MESA (Multi-Ethnic Study of Atherosclerosis). J Am Heart Assoc 2018; 7: e007885.
- 33.
Barasch E, Gottdiener JS, Aurigemma G, Kitzman DW, Han J, Kop WJ, et al. The relationship between serum markers of collagen turnover and cardiovascular outcome in the elderly: The Cardiovascular Health Study. Circ Heart Fail 2011; 4: 733–739.
- 34.
Martos R, Baugh J, Ledwidge M, O’Loughlin C, Murphy NF, Conlon C, et al. Diagnosis of heart failure with preserved ejection fraction: Improved accuracy with the use of markers of collagen turnover. Eur J Heart Fail 2009; 11: 191–197.
- 35.
Lopez B, Gonzalez A, Diez J. Circulating biomarkers of collagen metabolism in cardiac diseases. Circulation 2010; 121: 1645–1654.
- 36.
Chatzikyriakou SV, Tziakas DN, Chalikias GK, Stakos D, Papazoglou D, Lantzouraki A, et al. Circulating levels of a biomarker of collagen metabolism are associated with health-related quality of life in patients with chronic heart failure. Qual Life Res 2012; 21: 143–153.
- 37.
Chatzikyriakou SV, Tziakas DN, Chalikias GK, Stakos DA, Thomaidi AK, Mitrousi K, et al. Resolution of symptoms and serum peptides of collagen type I turnover in acute heart failure patients. Acta Cardiol 2009; 64: 29–33.
- 38.
Kitahara T, Takeishi Y, Arimoto T, Niizeki T, Koyama Y, Sasaki T, et al. Serum carboxy-terminal telopeptide of type I collagen (ICTP) predicts cardiac events in chronic heart failure patients with preserved left ventricular systolic function. Circ J 2007; 71: 929–935.
- 39.
Lofsjogard J, Kahan T, Diez J, Lopez B, Gonzalez A, Ravassa S, et al. Usefulness of collagen carboxy-terminal propeptide and telopeptide to predict disturbances of long-term mortality in patients ≥60 years with heart failure and reduced ejection fraction. Am J Cardiol 2017; 119: 2042–2048.
- 40.
Tziakas DN, Chalikias GK, Stakos D, Chatzikyriakou SV, Papazoglou D, Mitrousi K, et al. Independent and additive prognostic ability of serum carboxy-terminal telopeptide of collagen type-I in heart failure patients: A multi-marker approach with high-negative predictive value to rule out long-term adverse events. Eur J Prev Cardiol 2012; 19: 62–71.
- 41.
Fukui M, Goda A, Komamura K, Nakabo A, Masaki M, Yoshida C, et al. Changes in collagen metabolism account for ventricular functional recovery following beta-blocker therapy in patients with chronic heart failure. Heart Vessels 2016; 31: 173–182.
- 42.
Olsen MH, Christensen MK, Wachtell K, Tuxen C, Fossum E, Bang LE, et al. Markers of collagen synthesis is related to blood pressure and vascular hypertrophy: A LIFE substudy. J Hum Hypertens 2005; 19: 301–307.
- 43.
Varo N, Etayo JC, Zalba G, Beaumont J, Iraburu MJ, Montiel C, et al. Losartan inhibits the post-transcriptional synthesis of collagen type I and reverses left ventricular fibrosis in spontaneously hypertensive rats. J Hypertens 1999; 17: 107–114.
- 44.
Nishikawa N, Yamamoto K, Sakata Y, Mano T, Yoshida J, Umekawa S, et al. Long-term effect of spironolactone on cardiac structure as assessed by analysis of ultrasonic radio-frequency signals in patients with ventricular hypertrophy. Circ J 2005; 69: 1394–1400.