Abstract
Background:
The relationship between left ventricular diastolic dysfunction (LVDD) and paroxysmal atrial fibrillation (PAF) remains unclear because of a lack of standard measures to evaluate LVDD. Accordingly, we examined the association between the prevalence of PAF and each LVDD grade determined according to the latest American Society of Echocardiography guidelines.
Methods and Results:
In all, 2,063 patients without persistent AF who underwent echocardiography at Saitama Municipal Hospital from July 2016 to June 2017 were included in the study. Patients were divided into LVDD 6 categories: No-LVDD (n=1,107), Borderline (n=392), Grade 1 (n=204), Indeterminate (n=62), Grade 2 (n=254), and Grade 3 (n=44). PAF was documented in 111 (10.0%), 81 (20.7%), 28 (13.7%), 6 (9.7%), 52 (20.5%), and 24 (54.5%) patients in the No-LVDD, Borderline, Grade 1, Indeterminate, Grade 2, and Grade 3 categories, respectively. PAF prevalence was higher in patients with Grade 3 LVDD across the whole study population. Subgroup analyses showed that the prevalence of PAF increased with increased LVDD grade in patients with reduced left ventricular ejection fraction. This relationship was significant in multivariate analysis including various patient characteristics.
Conclusions:
LVDD severity determined on the basis of the latest echocardiographic criteria was associated with the prevalence of PAF. The present findings shed light on the development of new therapeutic markers for PAF.
Atrial fibrillation (AF) is the most common arrhythmia in clinical settings, and its prevalence increases markedly with age, affecting more than 5% of the population aged ≥65 years.1,2
Because AF is closely associated with potential adverse events, such as heart failure or cardiogenic stroke, its management is of paramount importance for the well-being of the general population.3,4
Before AF becomes persistent, paroxysmal AF (PAF) can be detected and treated appropriately such that PAF will not progress to its persistent form or increase the risk of cardiogenic stroke. However, in many instances detecting PAF is difficult, resulting in delays in medical intervention.5
Therefore, those who are susceptible to PAF need to be identified and carefully monitored.
Left ventricular diastolic dysfunction (LVDD) is considered to be one possible cause of AF.6,7
Accumulating evidence from transthoracic echocardiographic evaluations indicates an association between LVDD and AF.8–12
However, each report has used a different definition of LVDD, making it difficult to clarify the association between LVDD and the onset of PAF. Therefore, the relationship between LVDD and PAF remains unclear. In addition, various criteria for echocardiographic measurements have been used for the diagnosis of LVDD, but there has not been a consensus regarding which criterion is most reliable. In general, the accuracy of the results depends on the accuracy of the diagnostic tools and criteria used. The definition of LVDD based on echocardiographic examinations was revised in the 2016 guidelines of the American Society of Echocardiography (ASE).13
Based on those guidelines, LVDD measured by transthoracic echocardiography (TTE) can be divided into 6 categories. In this study, we re-evaluated the relationship between LVDD and the prevalence of PAF using the 2016 ASE guidelines, which may be the most sophisticated criteria for the definition of LVDD to date.
Methods
This study was a retrospective, observational study. The study protocol was approved by the Ethics Committee of Saitama Municipal Hospital (Reference no. A-2926), and the study was performed in accordance with the provisions of the Declaration of Helsinki. The need for written informed consent was waived because of the retrospective nature of the study.
Study Patients
Data for 2,732 consecutive patients who underwent TTE at the Echocardiography Laboratory of Saitama Municipal Hospital between July 2016 and June 2017, regardless of the reasons for referral for echocardiography, were analyzed retrospectively. Patients who underwent echocardiography at the emergency department or those with acute decompensated heart failure were not included in the study. Of the 2,732 patients, 235 had AF rhythm during echocardiographic examination and were diagnosed as having persistent AF (PerAF); thus, they were excluded from the analyses. Additional exclusion criteria were: (1) significant left ventricular (LV) hypertrophy (n=67), namely LV mass >105 g/m2
in males or 95 g/m2
in females, LV wall thickness >12 mm, or high voltage on the electrocardiogram (RV5+SV1>3.5 mV); (2) restrictive cardiomyopathy (n=8); (3) severe mitral valve stenosis (n=13); (4) severe mitral valve regurgitation (n=8); (5) severe aortic valve regurgitation (n=4); (6) a history of cardiac valvular surgery (n=66) or severe mitral annulus calcification (n=16); (7) an intraventricular pacing lead (n=68); (8) left bundle branch block (n=21); (9) complete atrioventricular block (n=2); (10) pulmonary arterial pulmonary hypertension (n=3); (11) a history of catheter ablation for AF (n=64); and (12) poor echocardiogram recording to assess LVDD (n=94). Thus, the relationship between the prevalence of LVDD and PAF was analyzed using data from 2,063 patients.
Determination of PAF
AF was determined only by confirming the presence of a past electrocardiogram revealing AF (obtained prior to echocardiography) in the patients’ medical records. Patients who had a history of AF and showed sinus rhythm during echocardiography were defined as having PAF.
Echocardiographic Measurements
All echocardiograms were obtained using a ViVid E9 ultrasound machine (probe, M5Sc-D; GE Healthcare Japan, Tokyo, Japan) or an Aplio 500 ultrasound machine (probe, PFST-25BT; Canon Medical Systems, Tochigi, Japan). LV ejection fraction (LVEF) was calculated using the biplane disk summation method or the Teichholz method in the parasternal long axis view according to the ASE and European Association of Cardiovascular Imaging 2015 guidelines.14
Left atrial volume was measured using the biplane disk summation method in the apical 2-chamber view and the apical 4-chamber view. The left atrial volume index (LAVI) was calculated by dividing the left atrial volume by body surface area. Mitral early deceleration time (Dct), peak velocity of the mitral E wave, peak velocity of the mitral A wave, and tricuspid valve regurgitation (TR) flow velocity were measured using transmitral and transtricuspid Doppler studies.15
Septal e’ velocity and lateral e’ velocity were measured at the mitral and tricuspid annulus using the tissue Doppler imaging technique, and the E/e’ ratio and E/A ratios were calculated using these data.15
Determination of LVDD Severity
Patients With Normal LV Systolic Function
Based on the latest ASE criteria, patients were classified into 6 categories depending on the severity of LVDD. Among patients with normal LV systolic function (LVEF >50%), the severity of LVDD was determined according using the following 4 indices: (1) mean E/e’ ratio >14; (2) septal e’ velocity <7 cm/s or lateral e’ velocity <10 cm/s; (3) TR velocity >2.8 m/s; and (4) LAVI >34 mL/m2.13
Patients who met 3 or 4 of these criteria were classified as having normal diastolic function (No-LVDD), patients who met 2 criteria were classified as having moderate LVDD (Borderline), and patients who only met 1 or none of the criteria were classified as having LVDD and were further classified using the algorithm described in the following section that is commonly used to classify LVDD in patients with reduced LV systolic function.13
Patients With LVDD or Reduced LV Systolic Function
In patients diagnosed as having LVDD using the algorithm described above and in those with reduced LV systolic function (LVEF ≤50%), LVDD was further classified based on the results of an LV inflow Doppler study.13
Briefly, when both an E/A ratio <0.8 and an E wave velocity <50 cm/s were observed, patients were classified as having normal left atrial pressure and Grade 1 LVDD (Grade 1). When the E/A ratio was >2, patients were classified as having increased atrial pressure and Grade 3 LVDD (Grade 3). When both an E/A ratio <0.8 and an E wave velocity >50 cm/s were observed, or when either an E/A ratio >0.8 or an E/A ratio <2 was observed, the following 3 additional criteria were used to determine the severity of LVDD: (1) mean E/e’ ratio >14; (2) TR velocity >2.8 m/s; and 3) LAVI >34 mL/m2. Patients who met only one or none of these 3 criteria were classified as having Grade 1 LVDD (Grade 1), whereas patients who met 2 or 3 of the criteria were classified as having elevated left atrial pressure and Grade 2 LVDD (Grade 2). If results for only 2 variables were available, LVDD was classified as follows: when none of 2 variables met the above criteria, patients were classified as having Grade 1 LVDD (Grade 1); when either of the 2 variables met the above criteria, LVDD was classified as “Indeterminate”; and when both the 2 variables met the above criteria, patients were classified as having Grade 2 LVDD (Grade 2).
Based on the algorithms described above, patients with LVEF >50% were classified into 6 categories, whereas patients with LVEF ≤50% were classified into 4 categories. Because LVDD assessment started with the second algorithm for patients with LVEF ≤50%, there were no patients with LVEF ≤50% in the No-LVDD or Borderline categories. Accordingly, in patients with LVEF >50%, odds ratios (ORs) for the prevalence of PAF in each LVDD grade were calculated using the prevalence of PAF in the No-LVDD group as a control. Furthermore, in patients with LVEF <50%, the ORs for the prevalence of PAF in each LVDD grade were calculated using the prevalence of PAF in the Grade 1 group as a control. Therefore, to assess ORs for the prevalence of PAF in each grade against the control, all patients were re-examined by dividing them into 2 groups, one with LVEF >50% and the other with LVEF ≤50%.
Statistical Analysis
The Shapiro-Wilk normality test was used to determine whether continuous variables were normally distributed. In this study, because all continuous variables were not normally distributed, data are expressed as the median with interquartile range (IQR). Continuous variables were compared between 2 groups using the Mann-Whitney U-test. Pearson’s Chi-squared tests were used to analyze relationships between the prevalence of PAF and each clinical characteristic, each LVDD grade, or each quartile of each echocardiography parameter. Furthermore, Haberman’s residual test was used for multiple comparisons of the prevalence of PAF among groups. Logistic regression was used for univariate and multivariate analyses between the prevalence of PAF and patients’ clinical characteristics or each LVDD grade. Differences were considered significant at 2-tailed P<0.05. In these analyses, hazard ratios (HRs), 95% confidence intervals (CIs), and associated P values were generated.
All statistical analyses were performed with EZR (http://www.jichi.ac.jp/saitama-sct/SaitamaHP.files/statmed.html),16
which is a graphical user interface for R (R Foundation for Statistical Computing, Vienna, Austria). EZR is a modified version of R commander designed to add statistical functions frequently used in biostatistics.
Results
Clinicodemographic Characteristics of Included Patients
The association between each LVDD grade and the prevalence of PAF was examined in 2,063 patients eligible for inclusion in this study. Among these patients, 302 had PAF based on their medical records. The prevalence of PAF (n=302) and PerAF (n=235) in the study population increased with age and was higher than that in the general population, possibly because the patients included in the study were recruited from those who had undergone echocardiography for evaluation of heart diseases or other disease conditions (Figure 1A).1,2
As indicated in
Table 1, PAF was common in the elderly, men, and in patients with hypertension or congestive heart failure. However, the prevalence of PAF was not related to a history of type 2 diabetes, stroke, or chronic obstructive pulmonary disease.

Table 1.
Clinicodemographic Characteristics of Patients With and Without PAF
| |
Patients without PAF
(n=1,761) |
Patients with PAF
(n=302) |
P value |
| Median [IQR] age (years) |
72 [61–80] |
75 [70–83] |
<0.01 |
| Age >75 years |
763 (43) |
162 (54) |
<0.01 |
| Male sex |
940 (53) |
185 (61) |
0.01 |
| Hypertension |
959 (54) |
201 (67) |
<0.01 |
| Type 2 diabetes |
413 (23) |
70 (23) |
0.94 |
| Congestive heart failure |
243 (14) |
99 (17) |
<0.01 |
| Stroke |
299 (17) |
52 (17) |
0.93 |
| COPD |
58 (3) |
14 (5) |
0.31 |
Unless indicated otherwise, data are presented as n (%). Age was compared between groups using the Mann-Whitney U-test; other variables were compared using the Chi-squared test. COPD, chronic obstructive pulmonary disease; IQR, interquartile range; PAF, paroxysmal atrial fibrillation.
All measurements representing LVDD (except LVEF), namely Dct of the E wave, E wave velocity, A wave velocity, E/A ratio, septal e’ wave velocity, lateral e’ wave velocity, E/e’ ratio, TR velocity, and LAVI, differed significantly between patients with and without PAF (P<0.01 for all;
Table 2). For example, the median value of the Dct of the E wave was higher in patients without than with PAF (233 vs. 217 cm/s, respectively; P<0.01). However, the differences in values between the 2 groups were small, and in most cases the ranges of values for each parameter overlapped. In addition, there was no significant difference in LVEF between patients without and with PAF in the entire cohort (median [IQR] 66% [59–72%] vs. 65% [55–71%], respectively;
Table 2).
Table 2.
Echocardiographic Measurements in Patients With and Without PAF
| |
Patients without PAF |
Patients with PAF |
P value |
| Dct (cm/s) |
233 [193–277] |
217 [184–260] |
<0.01 |
| Mitral E wave velocity (cm/s) |
62.0 [53–75] |
65.5 [53–82] |
<0.01 |
| Mitral A wave velocity (cm/s) |
78 [63–94] |
73 [56–88] |
<0.01 |
| E/A ratio |
0.80 [0.6–1.0] |
0.86 [0.7–1.3] |
<0.01 |
| Septal e’ wave velocity (cm/s) |
5.8 [4.6–7.4] |
5.5 [4.4–6.7] |
<0.01 |
| Lateral e’ wave velocity (cm/s) |
7.5 [5.9–9.4] |
7.2 [5.9–8.8] |
0.02 |
| E/e’ ratio |
9.4 [7.3–12.1] |
10.4 [8.1–14.1] |
<0.01 |
| TR velocity (m/s) |
2.3 [2.1–2.6] |
2.5 [2.2–2.7] |
<0.01 |
| LAVI (mL/m2) |
30 [23–39] |
37 [28–52] |
<0.01 |
| LVEF (%) |
66 [59–72] |
65 [55–71] |
0.06 |
Data are presented as the median [interquartile range]. Groups were compared using the Mann-Whitney U-test. Dct, deceleration time; LAVI, left atrial volume index; LVEF, left ventricular ejection fraction; PAF, paroxysmal atrial fibrillation; TR, tricuspid valve regurgitation.
Quartile analysis for each echocardiographic measurement showed that the prevalence of PAF in the study population increased linearly with increases in E wave velocity, E/A ratio, E/e’ ratio, TR velocity, and LAVI (Table 3). Conversely, the prevalence of PAF decreased with increases in the Dct of the E wave, A wave velocity, septal e’ velocity, and lateral e’ velocity (Table 3). There was no significant difference in LVEF between patients with and without PAF in the entire patient population (Table 2); however, the prevalence of PAF was significantly higher in patients in the lowest LVEF quartile than in those in the other quartiles (Table 3). Thus, both LV and diastolic and systolic functions appear to be associated with the prevalence of PAF.
Table 3.
Quartile Analyses for Echocardiographic Measurements of Left Ventricular Diastolic Dysfunction Affecting the Prevalence of PAF
| |
1 st quartile |
2nd quartile |
3rd quartile |
4th quartile |
P value |
Median
[IQR] |
PAF
(%) |
Median
[IQR] |
PAF
(%) |
Median
[IQR] |
PAF
(%) |
Median
[IQR] |
PAF
(%) |
| Dct of E wave (cm/s) |
170
[150–183] |
19 |
210
[202–220] |
15 |
250
[239–262] |
13 |
313
[293–348] |
12 |
<0.01 |
| Mitral E wave velocity (cm/s) |
46
[41–50] |
14 |
58
[55–60] |
12 |
69
[65–72] |
15 |
89
[82–100] |
19 |
<0.01 |
| Mitral A wave velocity (cm/s) |
51
[44–58] |
19 |
70
[66–74] |
15 |
84
[81–88] |
14 |
105
[98–115] |
10 |
<0.01 |
| E/A ratio |
0.6
[0.5–0.6] |
10 |
0.7
[0.7–0.7] |
14 |
0.8
[0.8–0.9] |
13 |
1.3
[1.2–1.7] |
22 |
<0.01 |
| E/e’ ratio |
6.3
[5.7–6.9] |
10 |
8.5
[8.0–9.0] |
13 |
10.6
[10–11.3] |
16 |
15.2
[13.4–18.6] |
19 |
<0.01 |
| Septal e’ velocity (cm/s) |
3.8
[3.3–4.2] |
17 |
5.2
[4.9–5.4] |
16 |
6.4
[6.1–6.9] |
16 |
8.9
[7.9–10.5] |
10 |
<0.01 |
| Lateral e’ velocity (cm/s) |
4.9
[4.2–5.4] |
14 |
6.6
[6.2–7.0] |
18 |
8.1
[7.7–8.7] |
17 |
10.9
[9.9–12.8] |
10 |
0.03 |
| TR velocity (m/s) |
None |
10 |
2.0
[1.9–2.1] |
13 |
2.3
[2.3–2.4] |
13 |
2.7
[2.6–3.0] |
23 |
<0.01 |
| LAVI (mm3/m2) |
20
[18–22] |
9 |
27
[25–29] |
11 |
34
[32–37] |
14 |
50
[44–60] |
24 |
<0.01 |
| LVEF (%) |
49
[41–55] |
18 |
62
[61–64] |
12 |
68
[67–70] |
14 |
75
[73–77] |
14 |
<0.01 |
The P values indicate results of the Chi-squared test. Abbreviations as in Tables 1,2.
Using the new criteria for LVDD, all study patients were classified into 6 categories based on the severity of LVDD: No-LVDD (n=1,107), Borderline (n=392), Grade 1 (n=204), Indeterminate (n=62), Grade 2 (n=254), and Grade 3 (n=44). The distribution of the severity of LVDD (LVDD grades) was quite different between patients with and without PAF (Figure 1B). Fewer patients with than without PAF were classified as No-LVDD, and more patients with than without PAF were classified as Borderline, Grade 2, or Grade 3 LVDD.
Prevalence of PAF in Patient Subgroups Based on LVDD Severity
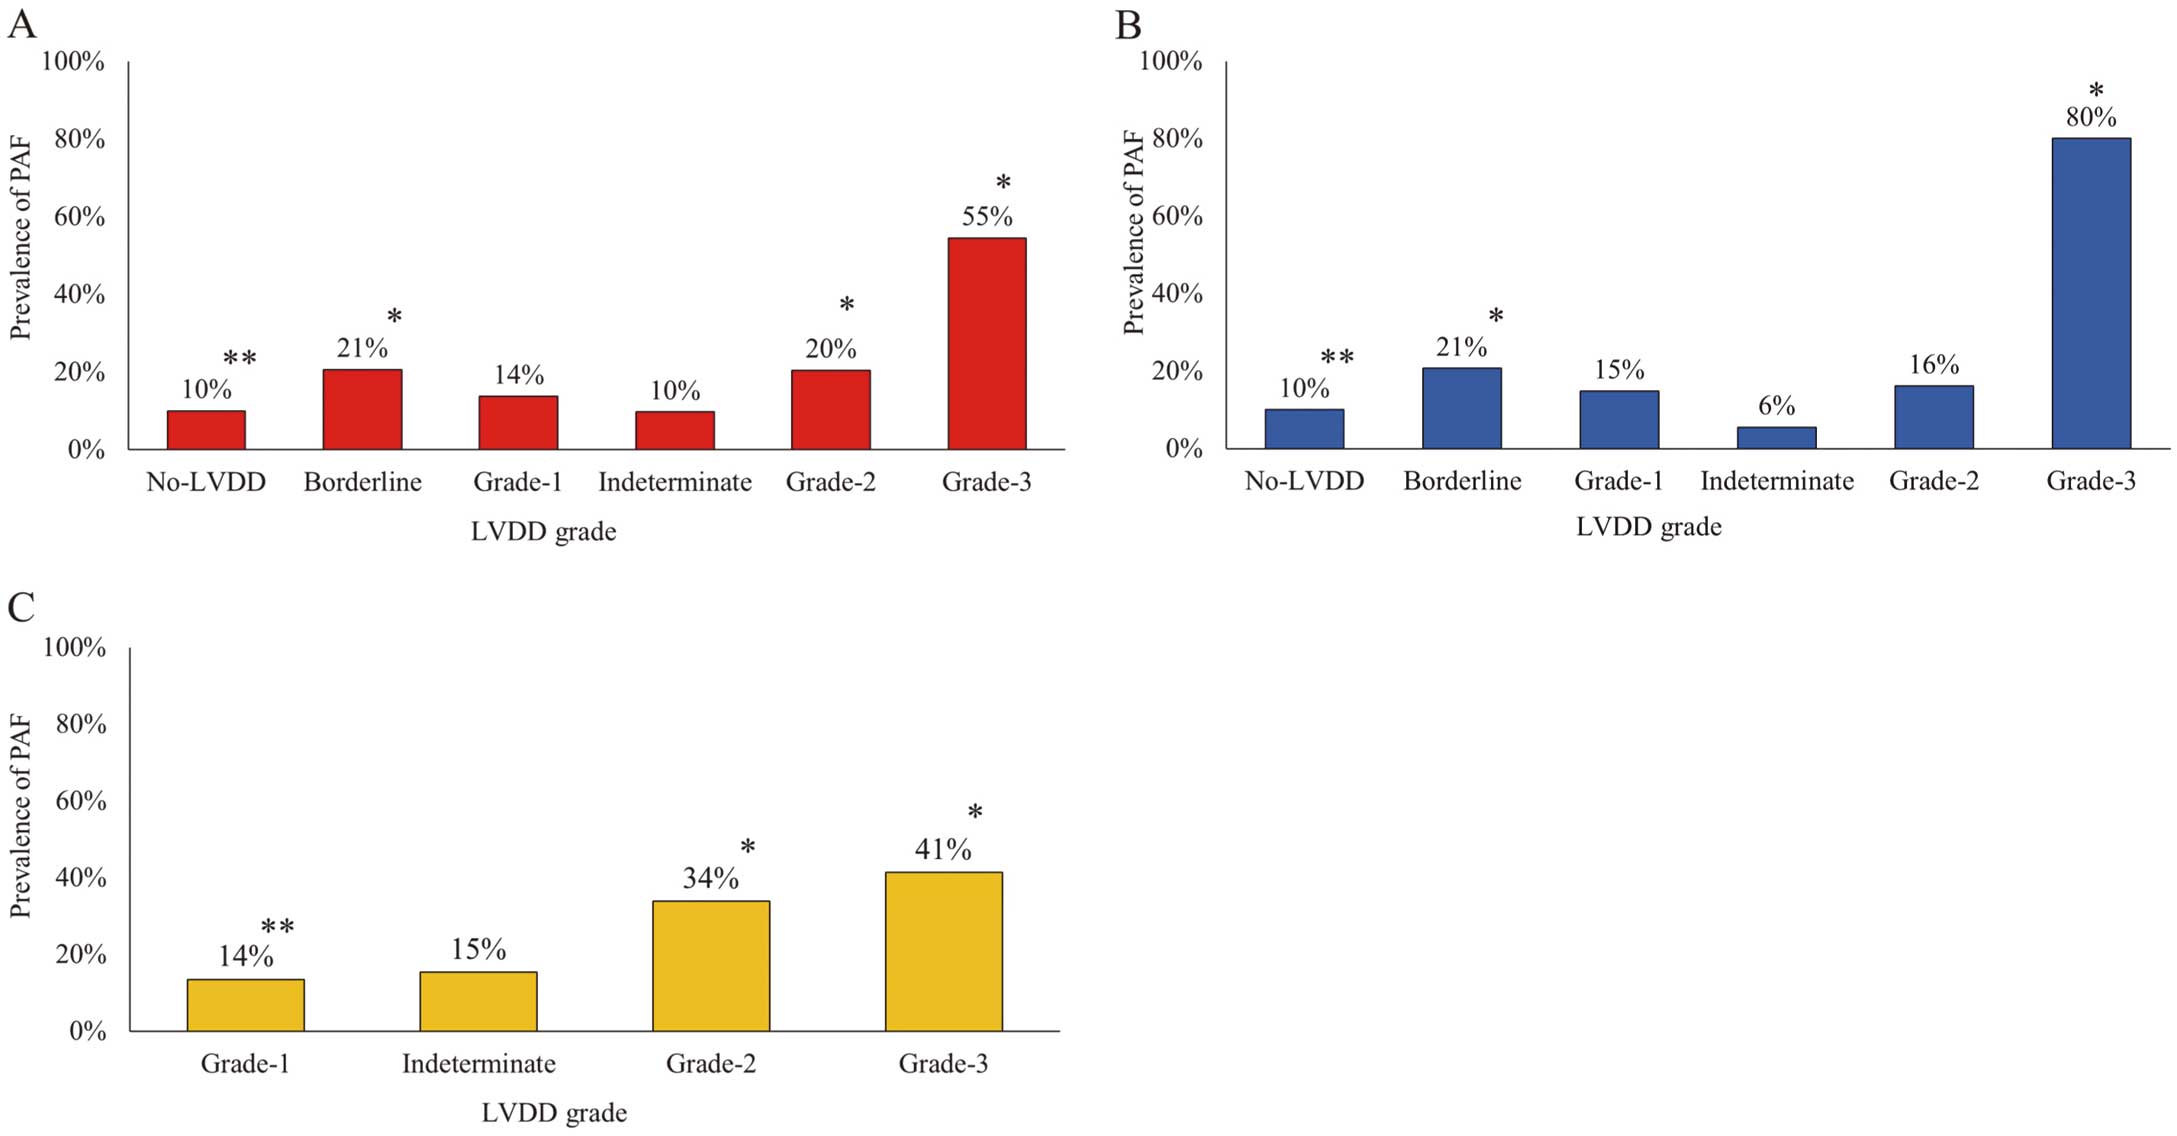
PAF was documented in 111 patients in the No-LVDD group, 81 in the Borderline group, 28 in the Grade 1 group, 6 in the Indeterminate group, 52 in the Grade 2 group, and 24 in the Grade 3 group. The prevalence of PAF was significantly lower in the No-LVDD group (P<0.01;
Figure 2A) and was significantly higher in the Borderline, Grade 2, and Grade 3 groups (P<0.01;
Figure 2A). Among patients with LVEF >50%, the prevalence of PAF was significantly lower in the No-LVDD group and significantly higher in the Borderline and Grade 3 groups (P<0.01 for all;
Figure 2B). Among patients with LVEF <50%, the prevalence of PAF was significantly lower in the Grade 1 group and significantly higher in the Grade 2 and Grade 3 groups (P<0.01 for all;
Figure 2C).
Effects of Patient Clinical Characteristics and LVDD on the Prevalence of PAF
In patients with LVEF >50%, the univariate analysis of patient clinical characteristics showed a higher prevalence of PAF in the elderly (age >75 years), men, and patients with a history of hypertension and congestive heart failure (Figure 3). Furthermore, univariate analysis of LVDD indicated a higher prevalence of PAF in the Borderline, Grade 2, and Grade 3 groups than in the No-LVDD group (Figure 3). Multivariate analysis of patient clinical characteristics and LVDD showed the same results in men, patients with a history of hypertension and congestive heart failure, and Borderline and Grade 3 LVDD patients, but not in the elderly and Grade 2 LVDD patients (Figure 3).

In patients with LVEF ≤50%, both univariate and multivariate analyses failed to show any association between the prevalence of PAF and each clinical characteristic (Figure 4). However, both univariate and multivariate analyses revealed that Grade 2 and Grade 3 LVDD were significantly associated with a higher prevalence of PAF (Figure 4).
Discussion
In the present study we assessed the relationship between the prevalence of PAF and LVDD using the latest criteria reported by the ASE, which is well accepted worldwide, including by the Japanese Circulation Society.13
Although the present study revealed different distribution patterns of LVDD between patients with and without PAF, LVDD was consistently associated with the prevalence of PAF, regardless of LVEF. This relationship was statistically significant, even after taking various patient clinical characteristics into account in the multivariate analysis.
Patient Clinical Characteristics and the Prevalence of PAF
The development of PAF has been reported to be affected by many factors, such as age, sex, comorbidities with hypertension, type 2 diabetes, congestive heart failure, chronic obstructive pulmonary disease, and structural heart disease.17–20
Similar results were found in the present study. The prevalence of PAF was higher in the elderly, men, and patients with a history of hypertension or congestive heart failure (Table 1).
Echocardiographic Measurements and the Prevalence of PAF
Tsang et al used several echocardiographic measurements for LVDD (i.e., E wave velocity, E/A ratio, left atrial size, and pattern of E/A ratio) to predict the onset of PAF and found a higher prevalence of PAF in patients with LVDD, indicating an association between LVDD and the prevalence of PAF.6
Similar results were observed in the present study (Table 2). Patients in the highest E or E/A ratio quartiles had a higher prevalence of PAF than those in the lowest E or E/A ratio quartiles (Table 3).
Vasan et al used the Dct of the E wave to predict the development of AF.7
In the present study, patients in the highest quartile of the Dct of the E wave had a 40% lower prevalence of PAF than those in the lowest quartile (Table 3). In addition, Rosenberg et al demonstrated the usefulness of the A wave velocity-time integral using quartile analysis in predicting the onset of PAF, reporting a U-shaped relationship between the A wave velocity-time integral and the risk of AF.8
In addition, patients with a mid-range A wave velocity-time integral (8–9 cm) had the lowest ORs of AF (0.622–0.886; P=0.005).8
Conversely, in the present study we found a negative linear correlation between the prevalence of PAF and A wave velocity. Patients in the highest A wave velocity quartile had a 45% lower prevalence of PAF than those in the lowest quartile (Table 3). The reason for the different results between the present study and that of Rosenberg et al is uncertain. However, it may be due, in part, to differences in methods used to evaluate the mitral A wave in the 2 studies. Kumar et al claimed that a higher value of septal e’ velocity (<8 cm/s) was a prominent risk factor for the recurrence of AF after catheter ablation.9
In the present study, patients in the highest septal e’ velocity quartile had 40% lower prevalence of PAF than those in the lowest quartile (Table 3). Furthermore, Arai et al demonstrated that an E/e’ ratio >11 was an independent risk factor for new-onset AF.21
In the present study, patients in the highest E/e’ ratio quartile had a 2-fold higher prevalence of PAF than those in the lowest quartile (Table 3).
Thus, the present study further confirmed the usefulness of each echocardiographic measurement currently used for estimating LVDD in predicting the onset of PAF.
LVDD With or Without LV Systolic Dysfunction and the Prevalence of PAF
There have been controversies regarding the effects of reduced LVEF on the prevalence of PAF.6
Rosenberg et al found no effects of LVEF on the prevalence of PAF.8
Similarly, Hu et al, who examined the effects of both LV diastolic and systolic function on the recurrence of catheter ablation for PAF, found no differences in LVEF between patients with and without PAF recurrence.22
In the present study, we did not find any significant differences in LVEF between patients with and without PAF across the whole study population (Table 2). However, in quartile analysis, patients in the lowest LVEF quartile had a higher prevalence of PAF than those in the other quartiles (Table 3). Furthermore, in subgroup analysis of patients with reduced LVEF (≤50%), the prevalence of PAF increased with the severity of LVDD. This relationship was significant even after multivariate analysis involving various clinical characteristics of patients that affect the prevalence of PAF, indicating that the association between the prevalence of PAF and LVDD is robust in patients with reduced LVEF. Considering that a higher prevalence of PAF was evident particularly in the Grade 3 LVDD group (patients with normal LVEF), atrial overloading due to LV systolic dysfunction may help reveal the association between LVDD and the prevalence of PAF in patients with reduced LVEF, possibly by enhancing the tendency for PAF to develop. Previous studies that used older diagnostic criteria for LVDD did not show this relationship. Therefore, the present study is the first to reveal the association between LVDD and the prevalence of PAF. The new diagnostic criteria in the 2016 ASE guidelines are very sophisticated and universally applicable, regardless of patients’ LV systolic function. The findings of this study, obtained using the new criteria, may improve our understanding of the relationship between LVDD and the prevalence of PAF.13
Study Limitations
This study has some limitations. First, the study was a retrospective, observational study. Thus, data regarding medical therapy prior to PAF were not readily available, and how these therapies may have factored into the disease course is not known. However, because the present study did not examine the effect of medical intervention, similar results would be expected even if this study was to be performed prospectively. Second, the study population consisted of patients who underwent echocardiography in the Echocardiography Laboratory of Saitama Municipal Hospital. Therefore, this study predominantly included patients with cardiac disorders, and these patients may not be representative of the general population. Third, the diagnosis of PAF was based on patients’ medical records. Therefore, it is possible that not all episodes of PAF were documented. Considering the possibility of underestimation of the diagnosis of PAF, we reviewed all medical records of patients without AF (n=1,761) up to 2 years after TTE. An additional 35 patients were diagnosed with PAF during the 2 years after the initial TTE examination: 4 with No-LVDD, 10 with Borderline LVDD, 5 with Grade 1 LVDD, 2 with Indeterminate LVDD, 14 with Grade 2 LVDD, and none with Grade 3 LVDD. Therefore, at 2 years after TTE examination, the prevalence of PAF was 10.4%, 23.2%, 16.2%, 12.9%, 26.0%, and 54.5% in the No-LVDD, Borderline, Grade 1, Indeterminate, Grade 2, and Grade 3 LVDD groups, respectively. However, medical records were not available for 595 patients because they did not return for a follow-up examination within 2 years after the initial TTE examination. Statistical results for the prevalence of PAF and LVDD at 2 years after the initial TTE examination were similar to those at the time of the first analysis in this study and so, because it was difficult to make accurate statistical evaluations due to insufficient data at 6 months or 2 years after the initial TTE, we conducted statistical analyses on data the time of the initial TTE examinations. Despite these limitations, the results of this study correlate well with previous studies, and the analysis using the latest echocardiographic criteria for LVDD provides a new aspect on the relationship between LVDD and the prevalence of PAF.
Conclusions
LVDD determined on the basis of the latest echocardiographic criteria was associated with the prevalence of PAF in consecutive patients who underwent echocardiography in the Echocardiography Laboratory of Saitama Municipal Hospital. The findings of the present study shed light on the development of new therapeutic markers for PAF.
Acknowledgments
The authors thank Chieko Udagawa, Kazuhiro Tachikawa, Makiko Nishida, Fumi Horiuchi, Asami Yamazaki, Tomomi Kamijima, Hisashi Yamaura, and Michiru Kobayashi at the Echocardiography Laboratory of Saitama Municipal Hospital for their assistance with echocardiographic recordings and measurements.
Sources of Funding
This study did not receive any specific funding.
Disclosures
The authors declare that there are no conflicts of interest. This work has no relationship with industry.
IRB Information
This study was approved by the Ethics Committee of Saitama Municipal Hospital (Reference no. A-2929).
Data Availability
Deidentified participant data will not be shared.
References
- 1.
Feinberg WM, Blackshear JL, Laupacis A, Kronmal R, Hart RG. Prevalence, age distribution, and gender of patients with atrial fibrillation: Analysis and implications. Arch Intern Med 1995; 155: 469–473.
- 2.
Iguchi Y, Kimura K, Aoki J, Kobayashi K, Terasawa Y, Sakai K, et al. Prevalence of atrial fibrillation in community-dwelling Japanese aged 40 years or older in Japan: Analysis of 41,436 non-employee residents in Kurashiki-city. Circ J 2008; 72: 909–913.
- 3.
Hohnloser SH, Pajitnev D, Pogue J, Healey JS, Pfeffer MA, Yusuf S, et al. Incidence of stroke in paroxysmal versus sustained atrial fibrillation in patients taking oral anticoagulation or combined antiplatelet therapy: An ACTIVE W Substudy. Am J Coll Cardiol 2007; 50: 2156–2161.
- 4.
Sato N, Kajimoto K, Keida T, Mizuno M, Minami Y, Yumino D, et al. Clinical features and outcome in hospitalized heart failure in Japan (from the ATTEND Registry). Circ J 2013; 77: 944–951.
- 5.
Israel CW, Grönefeld G, Ehrlich JR, Li YG, Hohnloser SH. Long-term risk of recurrent atrial fibrillation as documented by an implantable monitoring device: Implications for optimal patient care. Am J Coll Cardiol 2004; 43: 47–52.
- 6.
Tsang TS, Gersh BJ, Appleton CP, Tajik AJ, Barnes ME, Bailey KR, et al. Left ventricular diastolic dysfunction as a predictor of the first diagnosed nonvalvular atrial fibrillation in 840 elderly men and women. Am J Coll Cardiol 2002; 40: 1636–1644.
- 7.
Vasan RS, Larson MG, Levy D, Galderisi M, Wolf PA, Benjamin EJ. Doppler transmitral flow indexes and risk of atrial fibrillation (the Framingham Heart Study). Am J Cardiol 2003; 91: 1079–1083.
- 8.
Rosenberg MA, Gottdiener JS, Heckbert SR, Mukamal KJ. Echocardiographic diastolic parameters and risk of atrial fibrillation: The Cardiovascular Health Study. Eur Heart J 2012; 33: 904–912.
- 9.
Kumar P, Patel A, Mounsey JP, Chung EH, Schwartz JD, Pursell IW, et al. Effect of left ventricular diastolic dysfunction on outcomes of atrial fibrillation ablation. Am J Cardiol 2014; 114: 407–411.
- 10.
Hirai T, Cotseones G, Makki N, Agrawal A, Wilber DJ, Barron JT. Usefulness of left ventricular diastolic function to predict recurrence of atrial fibrillation in patients with preserved left ventricular systolic function. Am J Cardiol 2014; 114: 65–69.
- 11.
Schaaf M, Andre P, Altman M, Maucort-Boulch D, Placide J, Chevalier P, et al. Left atrial remodeling assessed by 2D and 3D echocardiography identifies paroxysmal atrial fibrillation. Eur Heart J Cardiovasc Imaging 2017; 18: 46–53.
- 12.
Nayor M, Cooper LL, Enserro DM, Xanthakis V, Larson MG, Benjamin EJ, et al. Left ventricular diastolic dysfunction in the community: Impact of diagnostic criteria on the burden, correlates, and prognosis. J Am Heart Assoc 2018; 7: e008291.
- 13.
Nagueh SF, Smiseth OA, Appleton CP, Byrd BF 3rd, Dokainish H, Edvardsen T, et al. Recommendations for the evaluation of left ventricular diastolic function by echocardiography: An update from the American Society of Echocardiography and the European Association of Cardiovascular Imaging. J Am Soc Echocardiogr 2016; 29: 277–314.
- 14.
Lang RM, Badano LP, Mor-Avi V, Afilalo J, Armstrong A, Ernande L, et al. Recommendations for cardiac chamber quantification by echocardiography in adults: An update from the American Society of Echocardiography and the European Association of Cardiovascular Imaging. J Am Soc Echocardiogr 2015; 28: 1–39.
- 15.
Mann D, Zipes D, Libby P, Bonow R. Chapter 14: Echocardiograophy. In: Braunwald’s heart disease, 10th edn. Philadelphia: Elsevier: 2014; 179–189.
- 16.
Kanda Y. Investigation of the freely available easy-to-use software “EZR” for medical statistics. Bone Marrow Transplant 2013; 48: 452–458.
- 17.
Kannel WB, Abbott RD, Savage DD, McNamara PM. Epidemiologic features of chronic atrial fibrillation: The Framingham study. N Engl J Med 1982; 306: 1018–1022.
- 18.
Krahn AD, Manfreda J, Tate RB, Mathewson FA, Cuddy TE. The natural history of atrial fibrillation: Incidence, risk factors, and prognosis in the Manitoba Follow-Up Study. Am J Med 1995; 98: 476–484.
- 19.
Djoussé L, Levy D, Benjamin EJ, Blease SJ, Russ A, Larson MG, et al. Long-term alcohol consumption and the risk of atrial fibrillation in the Framingham Study. Am J Cardiol 2004; 93: 710–713.
- 20.
Grymonprez M, Vakaet V, Kavousi M, Stricker BH, Ikram MA, Heeringa J, et al. Chronic obstructive pulmonary disease and the development of atrial fibrillation. Int J Cardiol 2019; 276: 118–124.
- 21.
Arai R, Suzuki S, Semba H, Arita T, Yagi N, Otsuka T, et al. The predictive role of E/e’ on ischemic stroke and atrial fibrillation in Japanese patients without atrial fibrillation. J Cardiol 2018; 72: 33–41.
- 22.
Hu YF, Hsu TL, Yu WC, Huang SH, Tsao HM, Tai CT, et al. The impact of diastolic dysfunction on the atrial substrate properties and outcome of catheter ablation in patients with paroxysmal atrial fibrillation. Circ J 2010; 74: 2074–2078.