Abstract
Background:
Serum calcium (Ca) concentrations in the acute phase of acute heart failure (AHF) have not been not sufficiently investigated.
Methods and Results:
This study enrolled 1,291 AHF patients and divided them into 3 groups based on original and corrected Ca concentrations: (1) hypocalcemia (both original and corrected Ca ≤8.7 mg/dL; n=651); (2) pseudo-hypocalcemia (original and corrected Ca ≤8.7 and >8.7 mg/dL, respectively; n=300); and (3) normal/hypercalcemia (both original and corrected Ca >8.7 mg/dL; n=340). AHF patients were also divided into 2 groups based on corrected Ca concentrations: (1) corrected hypocalcemia (corrected Ca ≤8.7 mg/dL; n=651); and (2) corrected normal/hypercalcemia (corrected Ca >8.7 mg/dL; n=640). Of the 951 patients with original hypocalcemia (≤8.7 mg/dL), 300 (31.5%) were classified as corrected normal/hypercalcemia after correction of Ca concentrations by serum albumin. The prognoses in the pseudo-hypocalcemia, low albumin, and corrected normal/hypercalcemia groups, including all-cause death within 730 days, were significantly poorer than in the other groups. Multivariate Cox regression analysis showed that classification into the pseudo-hypocalcemia, hypoalbumin, and corrected normal/hypercalcemia groups independently predicted 730-day all-cause death (hazard ratios [95% confidence intervals] of 1.497 [1.153–1.943], 2.392 [1.664–3.437], and 1.294 [1.009–1.659], respectively).
Conclusions:
Corrected normal/hypercalcemia was an independent predictor of prognosis because this group included patients with pseudo-hypocalcemia, which was affected by the serum albumin concentration.
Acute heart failure (AHF) is fundamentally recognized as a heterogeneous condition, with its characteristics and management differing among individuals. Heart failure (HF) is sometimes complicated with kidney disease, so-called cardio-renal syndrome;1
moreover, most HF patients are prescribed some kind of diuretic.2
Thus, electrolyte disturbances and electrical stability are induced because of these comorbidities, but studies of electrolyte disturbances in AHF have primarily focused on impaired serum sodium or potassium.3,4
Decreased serum sodium and increased serum potassium are known to be major prognostic factors in AHF patients.5
Few reports have discussed serum calcium (Ca) homeostasis in patients with AHF. Ca homeostasis is affected by various factors (e.g., Ca intake, parathyroid hormone, bone metabolism, kidney disease, and vitamin D disturbance).6–10
Although hypocalcemia was suggested to be an important adverse prognostic factor in patients with chronic HF,11
increased serum Ca was also suggested to be independently associated with all-cause mortality in a population of patients with stable coronary artery disease.12
Meanwhile, it is necessary to correct Ca concentrations by serum albumin concentrations. Nutritional problems in patients with AHF have also been discussed.13–15
Hypoalbuminemia is frequently observed as a complication in AHF cohorts. Thus, evaluation of corrected serum Ca concentrations in patients with AHF may provide an alert to intensivists, who may rely on the original Ca concentration when they risk stratify patients.
We hypothesized that pseudo-hypocalcemia induced by hypoalbuminemia may be one of the factors leading to a poor prognosis. Thus, in the present study, we examined the prognostic impact of the original and corrected serum Ca concentrations in a cohort of patients with AHF.
Methods
Subjects
In all, 1,378 AHF patients admitted to the Intensive Care Unit (ICU) of Nippon Medical School Chiba Hokusoh Hospital between January 2000 and January 2018 were screened retrospectively. Serum Ca values were missing for 20 patients and the serum Ca concentration had not been measured within 24 h after admission in 67 patients; these patients were excluded from the study (Figure 1).

AHF is defined as a gradual or rapid change in HF signs and symptoms, resulting in the need for urgent therapy. HF was comprehensively diagnosed based on clinical history (i.e., symptoms, functional limitation, history of cardiac disease, risk factors, exacerbating factors, comorbidities, and drugs), physical examination findings (i.e., vital signs, and the weight and volume of the heart, lung, abdomen, and peripheral vascular region), and initial investigations (i.e., chest radiography, 12-lead electrocardiography, laboratory measurements of troponins, blood urea nitrogen (BUN), creatinine, sodium, potassium, glucose, liver function, and complete blood count). As supplementary evaluations for the diagnosis of HF, plasma natriuretic peptide concentrations were measured and echocardiography was performed. The treating physician in the emergency department diagnosed AHF within 30 min of admission according to the aforementioned factors.16
All patients had a New York Heart Association (NYHA) functional class of either III or IV.
All the patients included in the study were administered diuretics or vasodilators as treatment for AHF. Patients who required high-flow oxygen therapy (including mechanical support) to treat orthopnea, those who required inotropes or mechanical support due to low blood pressure, and those who required various types of diuretics to improve general or lung edema were deemed to require intensive care. Patients with HF caused by ST-T segment elevation acute coronary syndrome were excluded from the study. The treating physician chose the treatment strategy for individual patients.
Blood Sample Measurements and Data Collection
Blood samples were collected from all patients to measure serum Ca concentrations. All patients underwent measurements on Day 1. Blood samples were centrifuged (1,500 g, 10 min, 4℃) within 5 min of collection and then immediately frozen and stored at −80℃ until analysis. The normal range of serum Ca (defined by our laboratory) was 8.8–10.3 mg/dL. Data were retrospectively retrieved from hospital medical records.
The patient distribution is shown in the flow chart in
Figure 1. Of the 1,291 enrolled patients, 951 with serum Ca ≤8.7 mg/dL were defined as having original hypocalcemia, whereas the remaining 340 patients with serum Ca ≥8.8 mg/dL were defined as having original normal/hypercalcemia. Ca concentrations in patients whose serum albumin concentration was <4.0 mg/dL were corrected using the following formula:17
Corrected Ca = serum Ca + 0.8 × (4.0 − serum albumin)
Following correction, 300 patients in patients with original hypocalcemia were reclassified as normal/hypercalcemia (serum Ca ≥8.8 mg/dL). Based on this result, AHF patients were divided into 3 groups according to original and corrected Ca concentrations: (1) hypocalcemia (both original and corrected Ca ≤8.7 mg/dL; n=651); (2) pseudo-hypocalcemia (original Ca ≤8.7 mg/dL and corrected Ca ≥8.8 mg/dL; n=300); and (3) normal/hypercalcemia (both original and corrected Ca ≥8.8 mg/dL; n=340). Finally, AHF patients were divided into 2 groups based on their corrected Ca concentrations: (1) corrected hypocalcemia (corrected Ca ≤8.7 mg/dL; n=651); and (2) corrected normal/hypercalcemia (corrected Ca ≥8.8 mg/dL; n=640;
Figure 1).
Patient characteristics, including age, sex, the presence of de novo or recurrent HF, the etiology of HF, risk factors for atherosclerosis (diabetes, hypertension, and dyslipidemia), vital signs and status on admission (systolic blood pressure [SBP], heart rate, left ventricular ejection fraction [LVEF] on echocardiography, orthopnea, chronic kidney disease [CKD], respiratory management, arterial blood gas data, and laboratory data, including BUN, total bilirubin, hemoglobin, B-type natriuretic peptide [BNP], and C-reactive protein [CRP]), medications administered during ICU admission, duration of admission (duration of ICU and hospital stays), and in-hospital mortality, were compared among the hypocalcemia, pseudo-hypocalcemia, and normal/hypercalcaemia groups, as well between the corrected hypocalcemia and corrected normal/hypercalcaemia groups.
LVEF was calculated using the Teichholz method or Simpson’s method at admission (Sonos 5500 [Hewlett Packard, Palo Alto, CA, USA] or Vivid I [GE Yokogawa Medical, Tokyo, Japan]). Because LVEF was measured during the acute phase, it was not adequately evaluated in cases of severe orthopnea. The method of LVEF measurement (Teichholz or Simpson’s method) was decided on a case-by-case basis.
Prognosis
Long-term prognosis, including all-cause death and HF events within 730 days, was evaluated. Patients underwent clinical follow-up examinations at routine outpatient visits. The prognoses of patients being followed up at other institutes were determined by telephone. HF events were defined as all-cause death and readmission to the hospital due to recurrence of HF. The prognostic value of 730-day mortality and HF events was evaluated using Kaplan-Meier curve analysis and Cox regression analysis. Long-term prognosis was first evaluated in the 2 (corrected hypocalcemia and corrected normal/hypercalcaemia) or 3 (hypocalcemia, pseudo-hypocalcemia, and normal/hypercalcaemia) groups according to serum Ca levels. In addition, prognosis was evaluated based on serum albumin concentrations: serum albumin ≤2.9 g/dL (n=119), serum albumin 3.0–3.4 g/dL (n=336), and serum albumin ≥3.5 g/dL (n=834).
Statistical Analyses
Data were analyzed using SPSS 22.0 (SPSS Japan Institute, Tokyo, Japan). All numerical data are expressed as the median and range or interquartile rang (IQR). The Mann-Whitney U-test was used for comparisons between 2 groups. The Chi-squared test was used to compare proportions. Two-sided P<0.05 was considered statistically significant.
The cumulative survival rates and event rates in each of the groups were analyzed using Kaplan-Meier curves, and the significance of differences was evaluated using a log-rank test. Cox regression analysis was used to determine the hazard ratios (HRs) for 730-day mortality and HF events. All clinically relevant factors affecting mortality, including age (per 1-year increase), SBP (per 10-mmHg increase), heart rate (per 10-beats/min increase), creatinine (per 0.1-mg/dL increase), total bilirubin (per 1.0-mg/dL increase), sodium (per 1.0-mg/dL increase), CRP (per 1.0-mg/dL increase), hemoglobin (per 1.0-mg/dL increase), and BNP (per 10-pg/dL increase), were included in the multivariate logistic regression model. A multivariate logistic regression analysis was performed using simultaneous forced entry. Original Ca, corrected Ca, and serum albumin concentrations were confounding factors for each other. Therefore, 3 different multivariate models were created.
Ethics Review
The Research Ethics Committee of Nippon Medical School Chiba Hokusoh Hospital approved the study protocol. The requirement for written informed consent was waived, in accordance with the advice from the Ethics Committee, because of the study’s retrospective design. In accordance with the advice of the Ethics Committee, we described the content of the present study in a poster displayed at Nippon Medical School Chiba Hokusoh Hospital and shared the content on the institute’s homepage where it could be easily seen by anyone. All procedures were performed in accordance with the Declaration of Helsinki.
Results
Patient Characteristics, Prognoses and Differences Among the Hypocalcemia, Pseudo-Hypocalcemia, and Normal/Hypercalcemia Groups
Figure 2
shows the distribution of original and corrected serum Ca concentrations. The original Ca concentration peaked at around 8.0–8.4 mg/dL, whereas the corrected Ca concentration peaked around 8.5–8.9 mg/dL. Median original and corrected Ca concentrations were 8.5 and 8.9 mg/dL, respectively. Of 951 patients with original hypocalcemia (≤8.7 mg/dL), 300 (31.5%) were reclassified as normal/hypercalcemia after correction of Ca concentrations (Figure 2).
The study population included 860 (66.6%) men (median age 74 years); 443 (34.3%) the patients had been readmitted for HF. In all, 528 (40.9%) patients had ischemic heart disease, and most patients were complicated with orthopnea in an emergency setting (n=1,044; 80.9%). The median LVEF on admission was 36.0%.
The pseudo-hypocalcemia group was significantly older and had significantly lower SBP and heart rate than the normal/hypercalcemia group. With regard to laboratory findings, serum sodium and hemoglobin levels were significantly lower and serum BUN, CRP, and BNP levels were significantly higher in the pseudo-hypocalcemia than normal/hypercalcemia group. Furthermore, the administration of nitroglycerin was significantly less frequent, whereas the administration of dobutamine was significantly more frequent in the pseudo-hypocalcemia than normal/hypercalcemia group. Interestingly, the length of ICU stay and length of total hospitalization were significantly longer in the pseudo-hypocalcemia than normal/hypercalcemia group (Table 1).
Table 1.
Characteristics of Patients in the Hypocalcemia, Pseudo-Hypocalcemia and Normal/Hypercalcemia Groups
| |
Total
(n=1,291) |
Hypocalcemia
(n=651) |
Pseudo-
hypocalcemia
(n=300) |
Normal/
hypercalcemia
(n=340) |
P value |
| Characteristics |
| Age (years) |
74 [65–81] |
76 [67–81] |
75 [65–82] |
71 [64–79] |
0.001 |
| Readmission to hospital |
443 (34.3) |
230 (35.3) |
97 (32.3) |
116 (34.1) |
0.736 |
| Male sex |
860 (66.6) |
439 (67.4) |
194 (64.6) |
227 (66.8) |
0.724 |
| Ischemic etiology |
528 (40.9) |
275 (42.2) |
128 (42.7) |
125 (36.8) |
0.168 |
| Risk factors for atherosclerosis |
| Hypertension |
972 (75.3) |
488 (75.0) |
224 (74.7) |
260 (76.5) |
0.634 |
| Diabetes |
574 (44.5) |
281 (43.2) |
142 (47.3) |
151 (44.4) |
0.415 |
| Dyslipidemia |
618 (47.9) |
305 (46.9) |
138 (46.0) |
151 (44.4) |
0.370 |
| Vital signs and status |
| SBP (mmHg) |
159 [128–184] |
166 [138–194] |
148 [118–176] |
158 [130–181] |
<0.001 |
| Heart rate (beats/min) |
110 [92–130] |
111 [94–130] |
108 [89–126] |
113 [94–132] |
0.010 |
| LVEF (%) |
36 [25–50] |
38 [27–50] |
36 [25–49] |
32 [24–47] |
0.026 |
| LVEF >40% |
516 (40.2) |
281 (43.4) |
117 (39.1) |
118 (34.8) |
0.029 |
| Orthopnea |
1,044 (80.9) |
554 (85.1) |
226 (75.3) |
264 (77.6) |
0.001 |
| CKD |
674 (52.2) |
341 (52.4) |
163 (54.3) |
170 (50.0) |
0.490 |
| Prescribed hemodialysis |
52 (4.0) |
12 (1.8) |
8 (2.7) |
32 (9.4) |
<0.001 |
| Respiratory management |
| ETI |
297 (23.0) |
165 (25.3) |
69 (23.0) |
63 (18.5) |
0.086 |
| NPPV |
644 (49.9) |
321 (49.3) |
151 (50.3) |
172 (50.6) |
0.667 |
| Arterial blood gas |
| pH |
7.34 [7.21–7.43] |
7.29 [7.18–7.39] |
7.39 [7.27–7.44] |
7.36 [7.24–7.43] |
<0.001 |
| PCO2 (mmHg) |
41 [34–54] |
46 [35–62] |
37 [32–47] |
40 [34–52] |
<0.001 |
| PO2 (mmHg) |
92 [68–137] |
95 [68–137] |
90 [68–142] |
89 [66–136] |
0.477 |
| HCO3− (mmol/L) |
22.0 [19.3–24.4] |
21.7 [19.3–24.1] |
21.6 [18.7–24.2] |
22.3 [19.3–24.4] |
0.363 |
| SaO2 (%) |
96 [91–98] |
96 [91–98] |
97 [93–99] |
96 [91–98] |
<0.001 |
| Lactate (mmol/L) |
1.8 [1.2–3.7] |
1.8 [1.1–3.5] |
1.9 [1.2–3.9] |
1.7 [1.1–3.6] |
0.690 |
| Laboratory data |
| Total bilirubin (mg/dL) |
0.6 [0.4–0.9] |
0.5 [0.4–0.8] |
0.6 [0.4–1.0] |
0.6 [0.5–0.9] |
0.003 |
| BUN (mg/dL) |
24.4 [18.0–36.8] |
23.9 [17.5–35.5] |
27.2 [19.2–39.1] |
23.8 [17.4–37.3] |
0.019 |
| Creatinine (mg/dL) |
1.20 [0.90–1.86] |
1.18 [0.89–1.87] |
1.26 [0.91–1.98] |
1.18 [0.89–1.80] |
0.444 |
| Sodium (mmol/L) |
140 [137–142] |
140 [137–142] |
139 [136–141] |
140 [137–142] |
0.021 |
| Potassium (mmol/L) |
4.3 [3.9–4.8] |
4.2 [3.8–4.7] |
4.2 [3.9–4.7] |
4.4 [4.0–4.9] |
<0.001 |
| Uric acid (mg/dL) |
6.8 [5.4–8.1] |
6.8 [5.4–8.0] |
6.8 [5.2–8.1] |
7.0 [5.7–8.3] |
0.263 |
| Hemoglobin (g/dL) |
12.4 [10.6–14.2] |
12.1 [10.3–14.0] |
11.8 [10.0–13.1] |
13.4 [11.5–14.9] |
<0.001 |
| Total protein (g/dL) |
6.6 [6.1–7.1] |
6.7 [6.2–7.1] |
6.2 [5.8–6.7] |
6.8 [6.4–7.3] |
<0.001 |
| Albumin (g/dL) |
3.6 [3.3–3.9] |
3.7 [3.4–4.0] |
3.3 [3.0–3.5] |
3.9 [3.6–4.1] |
<0.001 |
| CRP (mg/dL) |
0.73 [0.23–2.60] |
0.52 [0.16–1.78] |
1.48 [0.52–5.40] |
0.50 [0.17–1.47] |
<0.001 |
| BNP (pg/dL) |
859 [449–1,478] |
801 [450–1,374] |
982 [488–1,679] |
824 [414–1,380] |
0.013 |
| Coagulation data |
| PT/INR |
1.13 [1.04–1.30] |
1.13 [1.05–1.31] |
1.15 [1.04–1.36] |
1.13 [1.03–1.28] |
0.396 |
| APTT (s) |
32.9 [29.1–39.0] |
32.7 [28.9–38.3] |
33.2 [29.6–39.4] |
33.3 [29.3–40.0] |
0.176 |
| Fibrinogen (mg/dL) |
297 [242–362] |
286 [225–348] |
308 [246–403] |
292 [241–351] |
0.003 |
| FDP (μg/mL) |
5.8 [5.0–10.0] |
6.0 [5.0–10.0] |
7.0 [5.0–10.9] |
5.0 [5.0–10.0] |
0.005 |
| Medication during ICU admission |
| Furosemide |
1,183 (91.6) |
602 (92.5) |
273 (91.0) |
308 (90.6) |
0.456 |
| Nitroglycerin |
780 (60.4) |
442 (67.9) |
143 (47.7) |
195 (57.4) |
<0.001 |
| Nicorandil |
172 (13.3) |
84 (12.9) |
53 (17.7) |
35 (10.3) |
0.028 |
| Carperitide |
603 (46.7) |
323 (49.6) |
137 (45.7) |
143 (42.1) |
0.159 |
| Dopamine |
247 (19.1) |
138 (21.2) |
55 (18.3) |
54 (15.9) |
0.126 |
| Dobutamine |
278 (21.5) |
108 (16.6) |
82 (27.3) |
88 (25.9) |
<0.001 |
| ACEI/ARB |
465 (36.0) |
244 (37.5) |
87 (29.0) |
134 (39.4) |
0.022 |
| β-blocker |
340 (26.4) |
172 (26.4) |
68 (22.7) |
100 (29.4) |
0.137 |
| Spironolactone |
469 (36.3) |
232 (35.6) |
112 (37.3) |
125 (36.8) |
0.850 |
| Short-term outcome |
| ICU hospitalization (days) |
4 [3–6] |
4 [3–6] |
5 [3–7] |
4 [3–6] |
0.007 |
| Total hospitalization (days) |
26 [16–43] |
27 [17–43] |
29 [17–52] |
24 [16–41] |
0.014 |
| In-hospital mortality |
122 (9.5) |
39 (6.0) |
43 (10.5) |
40 (11.8) |
<0.001 |
Unless indicated otherwise, data are presented as n (%) or as the median [interquartile range]. P values between the hypocalcemia, pseudo-hypocalcemia, and normal/hypercalcemia groups were determined by the Kruskal-Wallis test or χ2 test. ACEI, angiotensin-converting enzyme inhibitor; APTT, activated partial thromboplastin time; ARB, angiotensin II receptor blocker; BNP, B-type natriuretic peptide; BUN, blood urea nitrogen; CKD, chronic kidney disease; CRP, C-reactive protein; ETI, endotracheal intubation; FDP, fibrin degradation product, fibrin-fibrinogen degradation products; ICU, intensive care unit; LVEF, left ventricular ejection fraction measured by echocardiography; NPPV, non-invasive positive pressure ventilation; PNI, prognostic nutritional index; PT/INR, prothrombin time-international normalized ratio; SBP, systolic blood pressure.
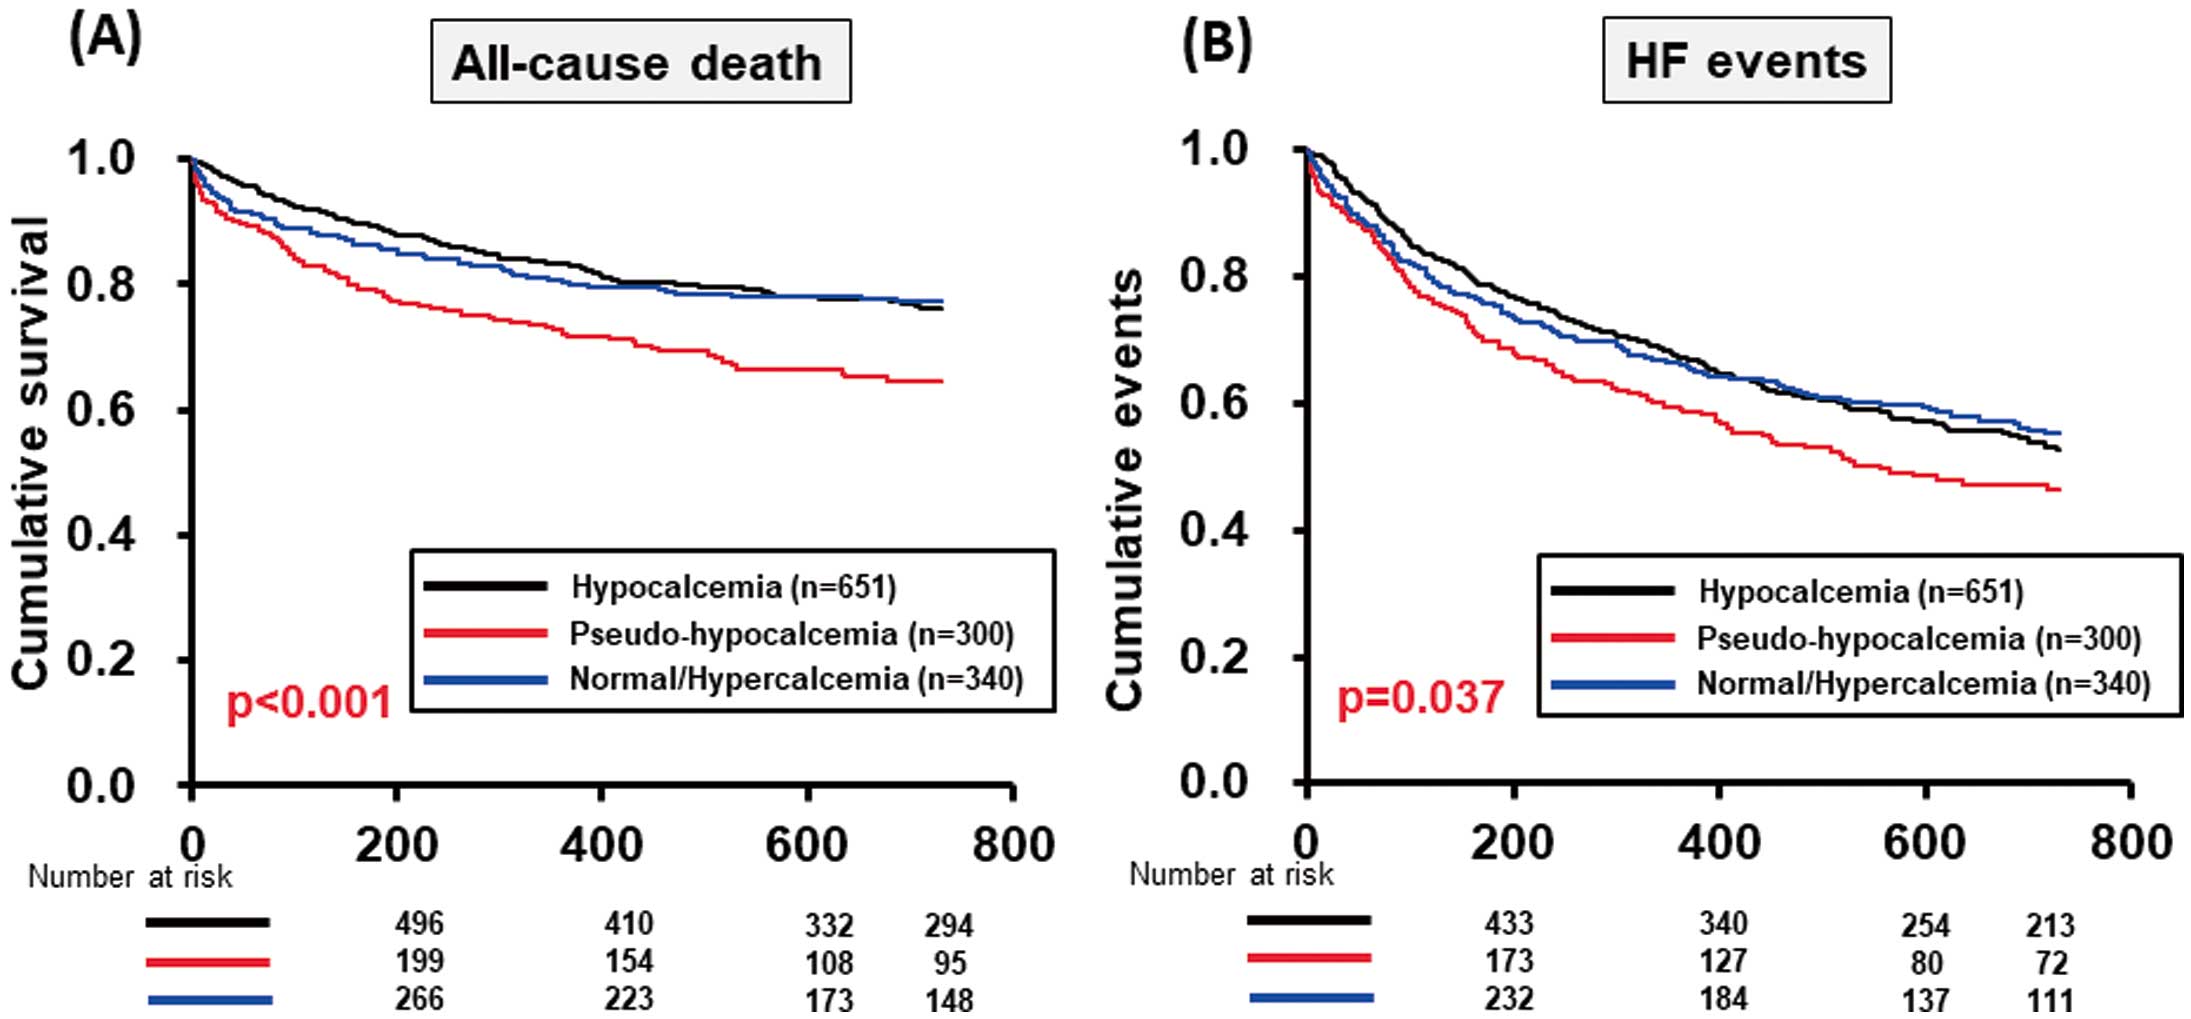
The Kaplan-Meier survival curves, including all-cause death and HF events within 730 days, for the 3 groups are shown in
Figure 3. Both the survival and event-free rates were significantly lower in the pseudo-hypocalcemia than normal/hypercalcemia group (Figure 3).
Patient Characteristics, Prognoses and Differences Between the Corrected Hypocalcemia and Corrected Normal/Hypercalcemia Groups
The corrected hypocalcemia group was significantly older and had significantly higher SBP than the corrected normal/hypercalcemia group. Interestingly, the rate of hemodialysis was significantly higher in the corrected normal/hypercalcemia group. With regard to laboratory findings, hemoglobin levels were significantly lower and serum CRP concentrations were also significantly lower in the corrected-hypocalcemia than corrected normal/hypercalcemia group. The rate of in-hospital mortality was significantly lower in the corrected hypocalcemia than corrected normal/hypercalcemia group (n=39 [6.0%] vs. n=83 [12.6%], respectively;
Table 2).
Table 2.
Characteristics of Patients in the Corrected Hypocalcemia and Corrected Normal/Hypocalcemia Groups
| |
Corrected
hypocalcemia
(n=651) |
Corrected normal/
hypercalcemia
(n=640) |
P value |
| Characteristics |
| Age (years) |
76 [67–81] |
73 [64–81] |
0.009 |
| Readmission to hospital |
230 (35.3) |
116 (34.1) |
0.446 |
| Male sex |
439 (67.4) |
227 (66.7) |
0.555 |
| Ischemic etiology |
275 (42.2) |
125 (36.7) |
0.336 |
| Risk factors for atherosclerosis |
| Hypertension |
488 (75.0) |
260 (76.4) |
0.797 |
| Diabetes |
281 (43.2) |
151 (44.4) |
0.370 |
| Dyslipidemia |
305 (46.9) |
175 (51.5) |
0.469 |
| Vital signs and status |
| SBP (mmHg) |
166 [138–192] |
153 [122–180] |
<0.001 |
| Heart rate (beats/min) |
111 [94–130] |
110 [92–130] |
0.185 |
| LVEF (%) |
38 [27–50] |
35 [25–48] |
<0.011 |
| LVEF >40% |
281 (43.4) |
235 (36.8) |
0.017 |
| Orthopnea |
554 (85.1) |
490 (76.6) |
<0.001 |
| CKD |
341 (52.4) |
333 (52.0) |
0.911 |
| Prescribed hemodialysis |
12 (1.8) |
40 (6.3) |
<0.001 |
| Respiratory management |
| ETI |
165 (25.3) |
132 (20.6) |
0.047 |
| NPPV |
321 (49.3) |
323 (50.5) |
0.697 |
| Arterial blood gas |
| pH |
7.29 [7.18–7.39] |
7.38 [7.26–7.44] |
<0.001 |
| PCO2 (mmHg) |
46 [35–62] |
38 [32–50] |
<0.001 |
| PO2 (mmHg) |
95 [68–137] |
89 [67–138] |
0.507 |
| HCO3− (mmol/L) |
21.7 [19.3–24.1] |
22.0 [19.2–24.4] |
0.613 |
| SaO2 (%) |
96 [91–98] |
96 [92–98] |
0.014 |
| Lactate (mmol/L) |
1.8 [1.1–3.5] |
1.8 [1.2–3.8] |
0.808 |
| Laboratory data |
| Total bilirubin (mg/dL) |
0.5 [0.4–0.8] |
0.6 [0.4–0.9] |
<0.001 |
| BUN (mg/dL) |
23.9 [17.5–35.5] |
25.0 [18.2–38.1] |
0.149 |
| Creatinine (mg/dL) |
1.18 [0.89–1.87] |
1.22 [0.90–1.90] |
0.441 |
| Sodium (mmol/L) |
140 [137–142] |
140 [137–142] |
0.511 |
| Potassium (mmol/L) |
4.2 [3.8–4.7] |
4.3 [4.0–4.8] |
<0.001 |
| Uric acid (mg/dL) |
6.8 [5.4–8.0] |
6.9 [5.4–8.2] |
0.384 |
| Hemoglobin (g/dL) |
12.1 [10.3–14.0] |
12.5 [10.7–14.2] |
0.018 |
| Total protein (g/dL) |
6.7 [6.2–7.1] |
6.6 [6.0–7.0] |
0.012 |
| Albumin (g/dL) |
3.7 [3.4–4.0] |
3.5 [3.2–3.9] |
<0.001 |
| CRP (mg/dL) |
0.52 [0.16–1.78] |
0.82 [0.27–3.06] |
<0.001 |
| BNP (pg/dL) |
801 [450–1,374] |
896 [448–1,521] |
0.114 |
| Coagulation data |
| PT/INR |
1.13 [1.05–1.31] |
1.14 [1.04–1.31] |
0.400 |
| APTT (s) |
32.7 [28.9–38.3] |
33.3 [29.5–39.9] |
0.064 |
| Fibrinogen (mg/dL) |
286 [225–348] |
298 [244–371] |
0.007 |
| FDP (μg/mL) |
6.0 [5.0–10.0] |
5.8 [5.0–10.0] |
0.759 |
| Medication during ICU admission |
| Furosemide |
602 (92.5) |
581 (90.8) |
0.315 |
| Nitroglycerin |
442 (67.9) |
338 (52.8) |
<0.001 |
| Nicorandil |
84 (12.9) |
88 (13.8) |
0.683 |
| Carperitide |
323 (49.6) |
280 (43.8) |
0.039 |
| Dopamine |
138 (21.2) |
109 (17.0) |
0.066 |
| Dobutamine |
108 (16.6) |
170 (26.6) |
<0.001 |
| ACEI/ARB |
244 (37.5) |
221 (34.5) |
0.271 |
| β-blocker |
172 (26.4) |
168 (26.3) |
0.950 |
| Spironolactone |
232 (35.6) |
237 (37.0) |
0.643 |
| Short-term outcome |
| ICU hospitalization (days) |
4 [3–6] |
4 [3–7] |
0.238 |
| Total hospitalization (days) |
27 [17–43] |
26 [16–46] |
0.652 |
| In-hospital mortality |
39 (6.0) |
83 (12.6) |
<0.001 |
Unless indicated otherwise, data are presented as n (%) or as the median [interquartile range]. P values between the corrected hypocalcemia and corrected normal/hypercalcemia groups were determined by the Mann-Whitney U-test or the χ2 test. Abbreviations as in Table 1.
The Kaplan-Meier survival curves, including all-cause death and HF events within 730 days, of the corrected hypocalcemia and corrected normal/hypocalcemia groups are shown in
Figure 4. Survival rates for both all-cause death and HF events were significantly better in the corrected hypocalcemia than corrected normal/hypercalcemia group. Event-free rates did not differ significantly between the corrected hypocalcemia and corrected normal/hypocalcemia groups (Figure 4). Prognosis was significantly poorer in patients with serum albumin ≤2.9 g/dL than in patients with serum albumin 3.0–3.4 or ≥3.5 g/dL (Figure 5). In particular, pseudo-hypocalcemia (HR 1.497; 95% confidence interval [CI] 1.153–1.943) and serum albumin ≤2.9 g/dL (HR: 2.392; 95% CI 1.664–3.437) were independent predictors of 730-day all-cause death (Table 3).


Table 3.
Multivariate Analyses of Factors Associated With 730-Day All-Cause Death
| |
Univariate analysis |
Multivariate analysis |
| Model 1 |
Model 2 |
Model 3 |
| HR (95% CI) |
P value |
HR (95% CI) |
P value |
HR (95% CI) |
P value |
HR (95% CI) |
P value |
| Original calcium level |
Pseudo-hypocalcemia
(vs. others) |
1.678
(1.308–2.151) |
<0.001 |
1.497
(1.153–1.943) |
0.002 |
|
|
|
|
| Serum albumin (g/dL) |
| ≤3.5 |
1.000 |
|
|
|
1.000 |
|
|
|
| 3.0 ≤ serum albumin ≤ 3.4 |
1.838
(1.419–2.380) |
<0.001 |
|
|
1.482
(1.122–1.957) |
<0.001 |
|
|
| ≥2.9 |
3.003
(2.168–4.160) |
<0.001 |
|
|
2.392
(1.664–3.437) |
<0.001 |
|
|
| Correlated calcium level |
Correlated normal/
hypercalcemia |
1.323
(1.050–1.666) |
0.017 |
|
|
|
|
1.294
(1.009–1.659) |
0.042 |
| Adjusting factors |
Age
(per 1-year increase) |
1.043
(1.031–1.055) |
<0.001 |
1.050
(1.037–1.063) |
<0.001 |
1.050
(1.037–1.064) |
<0.001 |
1.052
(1.038–1.065) |
<0.001 |
SBP
(per 10-mmHg increase) |
0.876
(0.852–0.900) |
<0.001 |
0.876
(0.848–0.905) |
<0.001 |
0.880
(0.851–0.910) |
<0.001 |
0.875
(0.848–0.904) |
<0.001 |
Heart rate
(per 10-beats/min increase) |
0.907
(0.873–0.942) |
<0.001 |
0.968
(0.929–1.009) |
0.129 |
0.970
(0.931–1.012) |
0.155 |
0.965
(0.926–1.006) |
0.093 |
Creatinine
(per 0.1-mg/dL increase) |
1.008
(1.004–1.013) |
<0.001 |
1.014
(1.009–1.019) |
<0.001 |
1.014
(1.008–1.019) |
<0.001 |
1.013
(1.008–1.018) |
<0.001 |
Total bilirubin
(per 1.0-mg/dL increase) |
1.096
(1.014–1.184) |
0.021 |
1.041
(0.935–1.160) |
0.460 |
1.069
(0.962–1.187) |
0.218 |
1.051
(0.943–1.171) |
0.367 |
Sodium
(per 1.0-mmol/L increase) |
0.952
(0.932–0.972) |
<0.001 |
0.976
(0.953–1.000) |
0.047 |
0.980
(0.956–1.004) |
0.094 |
0.976
(0.953–0.999) |
0.041 |
CRP
(per 1-mg/dL increase) |
1.010
(1.003–1.017) |
0.007 |
1.003
(0.991–1.015) |
0.596 |
0.994
(0.974–1.015) |
0.579 |
1.004
(0.993–1.016) |
0.466 |
Hemoglobin
(per 1.0-mg/dL increase) |
0.997
(0.973–1.020) |
0.772 |
1.004
(0.997–1.010) |
0.275 |
1.005
(0.999–1.010) |
0.134 |
1.004
(0.997–1.010) |
0.292 |
BNP
(per 10-pg/mL increase) |
1.000
(1.000–1.000) |
<0.001 |
1.000
(1.000–1.000) |
0.001 |
1.000
(1.000–1.000) |
0.007 |
1.000
(1.000–1.000) |
0.003 |
CI, confidence interval; HF, heart failure; HR, hazard ratio. Other abbreviations as in Table 1.
Discussion
Analysis of the present AHF cohort revealed that corrected normal/hypercalcemia was independently associated with an adverse outcome. This was related to the finding that pseudo-hypocalcemia, especially hypoalbuminemia, was independently associated with an adverse outcome. Moreover, patients with pseudo-hypocalcemia required a longer hospital stay. These findings underscore the importance of evaluating the corrected serum Ca concentration in patients with AHF. The mechanisms by which corrected normal/hypercalcemia led to adverse outcomes requires further consideration.
Serum Ca Concentrations and Hypocalcemia in HF
Maintenance of the extracellular Ca within the normal range is tightly regulated by Ca itself and several hormones, including parathyroid hormone and 1.25-dihydroxy vitamin D3. These regulatory systems can balance Ca concentrations in the intestinal tract, kidneys, and bones.7–9
Several conditions, including malignancy, kidney disease, parathyroid disease, the use of diuretics, and vitamin D disturbances, disturb normal serum Ca homeostasis and cause either hypo- or hypercalcemia.
The prognostic impact of Ca levels in patients with HF remains controversial. The Ca levels in these patients depend on various elements (e.g., type of HF [preserved or reduced LVEF], phase of HF [outpatients, hospitalized patients, and AHF patients], and comorbidities [CKD, coronary artery disease, and metabolic syndrome]).11,18–21
Hypocalcemia has conventionally received attention as a prognostic factor because HF patients easily develop kidney disease as a complication and are treated with diuretics,1,2
which induces hypocalcemia. Hypocalcemia has been reported to be associated with mortality in patients with chronic HF.11,18,21
Changes in serum Ca concentrations may interfere with myocardial function and cause electrical instability, which may adversely affect the prognosis of patients with HF. Furthermore, the risk of development of arrhythmia may be increased by electrolyte imbalance. The force–frequency relationship in the myocardium was impaired in patients with end-stage HF, and became pronounced with a reduction in free Ca. Liu et al reported that baseline hypocalcaemia predicted cardiac rehospitalization and death through left ventricle and skeletal muscle function pathways in patients with HF with preserved ejection fraction (HFpEF).21
The cohort in that study consisted of patients with preserved LVEF and stable outpatients. However, the prognostic value of hypocalcemia was not demonstrated in our AHF cohort. It was hypothesized that kidney disease would induce hypocalcemia;18
thus, hypocalcemia may lead to adverse outcomes in AHF. However, in the present study corrected hypocalcemia was not associated with kidney disease (e.g., CKD) or increased serum creatinine. Serum albumin concentrations easily change with the patient’s condition during the acute phase. Therefore, appropriate correction could be more important in patients with AHF than in those with stable compensated HF.
Normal/Hypercalcemia in AHF
High serum Ca concentrations have been reported to be strongly associated with mortality in patients with coronary artery disease (stable coronary artery disease and myocardial infarction).12,22
The pathobiological mechanisms through which high Ca concentrations are involved in the development of cardiovascular mortality are likely to extend beyond indirect pathways through associations with cardiovascular risk factors. In particular, Ca may exert a direct effect on vascular calcification by inducing smooth muscle cell mineralization23
or it may interact with other factors of bone metabolism (e.g., phosphate, vitamin D, parathyroid hormone), which, in turn, could enhance vascular calcification.24,25
Thus, elevated serum Ca concentrations may promote cardiovascular disease and atherogenesis through vascular calcification and increased coagulability. Ca supplementation is reported to be associated with an increased risk of myocardial infarction.26
Moreover, serum Ca concentrations were suggested to be associated with the risk of left ventricular hypertrophy.27
Because a relationship between Ca homeostasis in the myocardium and diastolic dysfunction has already been reported,28
increased serum Ca concentrations may lead to diastolic HF. Studies in the past decade have demonstrated the prognostic impact of increased serum Ca concentrations in patients with HF.11,19,20,29
HF is sometimes recognized as the final stage of cardiovascular disease; thus, the prognostic impact may be suggested based on the abovementioned mechanisms. The high degree of vascular calcification in AHF patients may be one of the reasons why patients with normal/hypercalcemia had poor mortality rates in the present study.
Although some hypothesized mechanisms through which elevated serum Ca may affect prognosis have been reported, they have not been completely proven. The results of the present study are important in this regard. The inclusion of patients with pseudo-hypocalcemia due to hypoalbuminemia in the corrected normal/hypercalcemia group may have affected the prognostic impact of AHF. Serum Ca concentrations included ionized Ca and Ca bound to serum protein (e.g., albumin). Malnutrition in AHF patients is a major issue in aging societies; thus, we are likely to misdiagnose hypocalcemia in emergency situations. The careful evaluation of ionized Ca levels using a calculating system is required.
The serum albumin concentration can be easily obtained through a routine laboratory test. Thus, we have a lot of evidence regarding serum albumin concentrations in patients with AHF.30,31
The presence of hypoalbuminemia is useful for identifying extremely sick patients with AHF. Previous studies evaluating the nutritional status of AHF patients using various tools (i.e., albumin, total cholesterol, Controlling Nutritional Status [CONUT] score, prognostic nutritional index [PNI]) indicated that malnutrition is an independent predictor of mortality, HF progression, HF events, and adverse outcomes.14,15,30,32,33
The PNI was calculated using the following formula:34
PNI = 10 × serum albumin (g/dL) + 0.005 × lymphocyte (/μL)
with lower values indicating worse nutritional status, and the CONUT score was calculated using a scoring system consisting of serum albumin, lymphocytes, and total cholesterol (range 0–12; higher scores indicate worse nutritional status).35
Therefore, serum albumin concentrations are one of the components of these nutrition evaluation tools. Hypoalbuminemia was associated with adverse outcomes from the perspective of nutrition.36
We concluded that corrected normal/hypercalcemia was associated with the prognosis of patients with AHF, including all-cause death, because the corrected normal/hypercalcemia group included patients with pseudo-hypocalcemia due to hypoalbuminemia.
Study Limitations
The present study has several limitations. First, serum albumin concentrations are an independent predictor of adverse outcomes in patients with AHF, as shown in
Figure 5. If we just only consider the prognostic value in AHF patients, it may be sufficient to only use serum albumin concentrations. Therefore, a simple methodology to risk stratify patients is to evaluate the only serum albumin concentrations. However, the main focus of the present study was to investigate the clinical significance of serum Ca concentrations. It may be confusing for readers. Second, the study only enrolled patients who were admitted to the ICU, with AHF patients who were admitted to general wards excluded from the study. This exclusion may have reduced the generalizability of the study findings. Third, clear criteria regarding the dose of high-flow oxygen, inotropes, and diuretics were not proposed. Thus, the admission criteria may have differed each year. The treating physician ultimately decided whether a patient should be admitted to the ICU or a general ward. Patient bias may have affected this decision. Fourth, the study was performed in a single center, and it was not a prospective randomized controlled trial. We did not evaluate the key factors associated with the main results (e.g., phosphate, vitamin D, parathyroid hormone). It is therefore possible that unmeasured variables affected the results. Fifth, because LVEF was measured during the acute phase, it was not adequately evaluated in cases of severe orthopnea. The method of LVEF measurement was different in each patient (Teichholz or Simpson’s methods). The difference in method may have affected the LVEF values in the present study. Sixth, although we revealed that elevated corrected normal/hypercalcemia was associated with prognosis, how the Ca levels were managed was not stated. Further studies regarding treatments targeting serum Ca concentrations in patients with AHF may be required. Finally, because this was a retrospective study, the timing of sampling may have differed in each patient. We were able to evaluate serum Ca concentrations determined within 1 day of admission in all patients enrolled in the study: although samples were obtained within 30 min after admission for the 652 patients who were admitted after May 2011, serum Ca in the remaining patients were evaluated within 1 day of admission. Thus, for patients who were admitted before April 2011, it is not clear whether the data were obtained after interventions for AHF.
Conclusions
Among patients with AHF, those with the corrected normal/hypercalcemia experienced adverse outcomes, including all-cause death. Because pseudo-hypocalcemia and hypoalbuminemia were also independently associated with adverse outcomes, patients with AHF whose original data show complicating hypocalcemia should be correctly re-evaluated using serum albumin concentrations.
Acknowledgments
The authors are grateful to the staff of the ICU and the Medical Records Office at Chiba Hokusoh Hospital, Nippon Medical School, for collecting the medical data.
Sources of Funding
This study did not receive any specific funding.
Disclosures
The authors declare no conflicts of interest in relation to the present study.
IRB Information
This study was approved by the Research Ethics Committee of Nippon Medical School Chiba Hokusoh Hospital (Reference no. 543-1).
References
- 1.
Ronco C, Di Lullo L. Cardiorenal syndrome. Heart Fail Clin 2014; 10: 251–280.
- 2.
Shirakabe A, Kobayashi N, Okazaki H, Matsushita M, Shibata Y, Goda H, et al. Trends in the management of acute heart failure requiring intensive care. Am J Cardiol 2020; 125: 427–435.
- 3.
Aldahl M, Jensen AC, Davidsen L, Eriksen MA, Moller Hansen S, Nielsen BJ, et al. Associations of serum potassium levels with mortality in chronic heart failure patients. Eur Heart J 2017; 38: 2890–2896.
- 4.
Yoshioka K, Matsue Y, Kagiyama N, Yoshida K, Kume T, Okura H, et al. Recovery from hyponatremia in acute phase is associated with better in-hospital mortality rate in acute heart failure syndrome. J Cardiol 2016; 67: 406–411.
- 5.
Okazaki H, Shirakabe A, Hata N, Yamamoto M, Kobayashi N, Shinada T, et al. New scoring system (APACHE-HF) for predicting adverse outcomes in patients with acute heart failure: Evaluation of the APACHE II and Modified APACHE II scoring systems. J Cardiol 2014; 64: 441–449.
- 6.
Van Hemelrijck M, Michaelsson K, Linseisen J, Rohrmann S. Calcium intake and serum concentration in relation to risk of cardiovascular death in NHANES III. PLoS One 2013; 8: e61037.
- 7.
Palmer SC, Hayen A, Macaskill P, Pellegrini F, Craig JC, Elder GJ, et al. Serum levels of phosphorus, parathyroid hormone, and calcium and risks of death and cardiovascular disease in individuals with chronic kidney disease: A systematic review and meta-analysis. JAMA 2011; 305: 1119–1127.
- 8.
Lehmann G, Ott U, Kaemmerer D, Schuetze J, Wolf G. Bone histomorphometry and biochemical markers of bone turnover in patients with chronic kidney disease Stages 3–5. Clin Nephrol 2008; 70: 296–305.
- 9.
Blaine J, Chonchol M, Levi M. Renal control of calcium, phosphate, and magnesium homeostasis. Clin J Am Soc Nephrol 2015; 10: 1257–1272.
- 10.
Krim SR, Campbell P, Lavie CJ, Ventura H. Micronutrients in chronic heart failure. Curr Heart Fail Rep 2013; 10: 46–53.
- 11.
Jensen AC, Polcwiartek C, Sogaard P, Mortensen RN, Davidsen L, Aldahl M, et al. The association between serum calcium levels and short-term mortality in patients with chronic heart failure. Am J Med 2019; 132: 200–208.e201.
- 12.
Grandi NC, Brenner H, Hahmann H, Wusten B, Marz W, Rothenbacher D, et al. Calcium, phosphate and the risk of cardiovascular events and all-cause mortality in a population with stable coronary heart disease. Heart 2012; 98: 926–933.
- 13.
Shirakabe A, Hata N, Kobayashi N, Okazaki H, Matsushita M, Shibata Y, et al. The prognostic impact of malnutrition in patients with severely decompensated acute heart failure, as assessed using the Prognostic Nutritional Index (PNI) and Controlling Nutritional Status (CONUT) score. Heart Vessels 2018; 33: 134–144.
- 14.
Cheng YL, Sung SH, Cheng HM, Hsu PF, Guo CY, Yu WC, et al. Prognostic Nutritional Index and the risk of mortality in patients with acute heart failure. J Am Heart Assoc 2017; 6: e004876.
- 15.
Iwakami N, Nagai T, Furukawa TA, Sugano Y, Honda S, Okada A, et al. Prognostic value of malnutrition assessed by Controlling Nutritional Status score for long-term mortality in patients with acute heart failure. Int J Cardiol 2017; 230: 529–536.
- 16.
Ponikowski P, Voors AA, Anker SD, Bueno H, Cleland JG, Coats AJ, et al. 2016 ESC Guidelines for the diagnosis and treatment of acute and chronic heart failure: The Task Force for the Diagnosis and Treatment of Acute and Chronic Heart Failure of the European Society of Cardiology (ESC). Developed with the special contribution of the Heart Failure Association (HFA) of the ESC. Eur J Heart Fail 2016; 18: 891–975.
- 17.
Moe S, Drueke T, Cunningham J, Goodman W, Martin K, Olgaard K, et al. Definition, evaluation, and classification of renal osteodystrophy: A position statement from Kidney Disease: Improving Global Outcomes (KDIGO). Kidney Int 2006; 69: 1945–1953.
- 18.
Miura S, Yoshihisa A, Takiguchi M, Shimizu T, Nakamura Y, Yamauchi H, et al. Association of hypocalcemia with mortality in hospitalized patients with heart failure and chronic kidney disease. J Card Fail 2015; 21: 621–627.
- 19.
Li J, Wu N, Dai W, Jiang L, Li Y, Li S, et al. Association of serum calcium and heart failure with preserved ejection fraction in patients with type 2 diabetes. Cardiovasc Diabetol 2016; 15: 140.
- 20.
Lutsey PL, Alonso A, Michos ED, Loehr LR, Astor BC, Coresh J, et al. Serum magnesium, phosphorus, and calcium are associated with risk of incident heart failure: The Atherosclerosis Risk in Communities (ARIC) Study. Am J Clinical Nutr 2014; 100: 756–764.
- 21.
Liu F, Zhang H, Li Y, Lu X. Hypocalcaemia predicts 12-month re-hospitalization in heart failure. Eur J Clin Invest
2020: e13261.
- 22.
Lind L, Skarfors E, Berglund L, Lithell H, Ljunghall S. Serum calcium: A new, independent, prospective risk factor for myocardial infarction in middle-aged men followed for 18 years. J Clin Epidemiol 1997; 50: 967–973.
- 23.
Giachelli CM. Vascular calcification mechanisms. J Am Soc Nephrol 2004; 15: 2959–2964.
- 24.
Peacock M. Calcium metabolism in health and disease. Clin J Am Soc Nephrol 2010; 5(Suppl 1): S23–S30.
- 25.
Yamamoto H, Kitagawa T, Kunita E, Utsunomiya H, Senoo A, Nakamoto Y, et al. Impact of the coronary artery calcium score on mid- to long-term cardiovascular mortality and morbidity measured with coronary computed tomography angiography. Circ J 2018; 82: 2342–2349.
- 26.
Reid IR, Bolland MJ. Calcium supplements: Bad for the heart? Heart 2012; 98: 895–896.
- 27.
Li J, Wu N, Li Y, Ye K, He M, Hu R. Cross-sectional analysis of serum calcium levels for associations with left ventricular hypertrophy in normocalcemia individuals with type 2 diabetes. Cardiovasc Diabetol 2015; 14: 43.
- 28.
Zile MR, Gaasch WH. Abnormal calcium homeostasis: One mechanism in diastolic heart failure. J Am Coll Cardiol 2011; 58: 155–157.
- 29.
Cubbon RM, Thomas CH, Drozd M, Gierula J, Jamil HA, Byrom R, et al. Calcium, phosphate and calcium phosphate product are markers of outcome in patients with chronic heart failure. J Nephrol 2015; 28: 209–215.
- 30.
Bonilla-Palomas JL, Gamez-Lopez AL, Moreno-Conde M, Lopez-Ibanez MC, Anguita-Sanchez M, Gallego de la Sacristana A, et al. Hypoalbuminemia in acute heart failure patients: Causes and its impact on hospital and long-term mortality. J Card Fail 2014; 20: 350–358.
- 31.
Nakayama H, Koyama S, Kuragaichi T, Shiba M, Fujiwara H, Takatsu Y, et al. Prognostic value of rising serum albumin during hospitalization in patients with acute heart failure. Am J Cardiol 2016; 117: 1305–1309.
- 32.
Uthamalingam S, Kandala J, Daley M, Patvardhan E, Capodilupo R, Moore SA, et al. Serum albumin and mortality in acutely decompensated heart failure. Am Heart J 2010; 160: 1149–1155.
- 33.
Arques S. Serum albumin and heart failure: Recent advances on a new paradigm. Ann Cardiol Angeiol 2011; 60: 272–278 (in French).
- 34.
Onodera T, Goseki N, Kosaki G. Prognostic nutritional index in gastrointestinal surgery of malnourished cancer patients. Nihon Geka Gakkai Zasshi 1984; 85: 1001–1005 (in Japanese).
- 35.
Ignacio de Ulibarri J, Gonzalez-Madrono A, de Villar NG, Gonzalez P, Gonzalez B, Mancha A, et al. CONUT: A tool for controlling nutritional status. First validation in a hospital population. Nutr Hosp 2005; 20: 38–45.
- 36.
Nakano H, Omote K, Nagai T, Nakai M, Nishimura K, Honda Y, et al. Comparison of mortality prediction models on long-term mortality in hospitalized patients with acute heart failure: The importance of accounting for nutritional status. Circ J 2019; 83: 614–621.