Abstract
Background:
The optimal site for measuring computed tomography (CT)-derived fractional flow reserve (FFRCT) to detect significant coronary artery disease (CAD) remains unknown. We investigated how diagnostic performance changes with FFRCT
measurement site.
Methods and Results:
The diagnostic performance of FFRCT, measured 1–2 cm distal to the stenosis vs. a far-distal site, in detecting significant CAD with invasive fractional flow reserve ≤0.8 was evaluated in 254 diseased vessels from 146 patients with stable or suspected CAD diagnosed by coronary CT angiography. Receiver operating characteristic curve analysis revealed a significantly larger area under the curve for FFRCT
measured 1–2 cm distal to the stenosis than at a far-distal site (0.829 vs. 0.791, respectively; P=0.0305). The rate of reclassification of positive FFRCT
was 19% for measurements made 1–2 cm distal to the stenosis, and diagnostic accuracy for FFRCT
0.71–0.80 improved from 36% to 58% (P=0.0052). Vessel-based diagnostic accuracy of FFRCT
1–2 cm distal to the stenosis and at a far-distal site was 75% and 65%, respectively (P<0.0001), with corresponding sensitivity of 87% and 94% (P=0.0039), specificity of 60% and 29% (P<0.0001), a positive predictive value of 73% and 62% (P=0.028), and a negative predictive value of 78% and 79% (P=0.958).
Conclusions:
Our data suggest measuring FFRCT
1–2 cm distal to the stenosis has better diagnostic performance for detecting physiologically significant CAD.
Coronary computed tomography angiography (CCTA) has become widely used in clinical settings. Its diagnostic performance has improved considerably, making it possible to non-invasively evaluate coronary artery lesions. In this context, improvements in computational fluid dynamics technology have allowed for the assessment of coronary ischemia using CCTA data.
Fractional flow reserve (FFR) derived from CCTA (FFRCT®; HeartFlow, Redwood City, CA, USA) is a computed CCTA-derived FFR that has been used in various clinical fields.1–8
FFRCT
has enabled both morphological and functional evaluation using one modality, showing higher specificity than conventional CCTA.1,2,5
FFRCT
values are generally obtained from far-distal sites of the diseased vessel, but it is known that overestimation of functional ischemia is possible.9–11
Recently, an expert panel recommended that FFRCT
values measured 1–2 cm distal to the stenosis be used to assess the hemodynamic significance of lesions,11
resulting in potentially improved diagnostic accuracy.9,12
The aim of the present study was to investigate how diagnostic performance for detecting functional ischemia changes according to the measurement site of FFRCT.
Methods
Study Design and Population
This was a single-center retrospective analysis conducted in the Shin-Koga Hospital. Data were collected for 437 patients with a stable or suspected coronary artery disease (CAD) diagnosed by CCTA who were enrolled in the Assessing Diagnostic Value of Noninvasive FFRCT
in Coronary Care (ADVANCE) Registry13
from July 2015 to October 2018. Of these 437 patients, 146 who underwent invasive FFR testing during invasive coronary angiography (ICA) within 1 month of registry enrollment were included in the present study (Figure 1). Physicians in charge of the invasive FFR testing were blinded to the results of FFRCT.
This study was approved by the Institutional Review Board of Shin-Koga Hospital, and written informed consent was obtained from all participants.
CCTA
CCTA was performed using a 320-detector row computed tomography (CT) scanner (Aquilion ONE ViSION; Canon Medical Systems, Tochigi, Japan). All patients received sublingual nitroglycerin and, if necessary, oral metoprolol 20 mg and/or intravenous landiolol 0.125 mg/kg to achieve a target heart rate of ≤60 beats/min. CT images were acquired at tube voltages of 100, 120, and 135 kV, following the standard protocol. The coronary artery calcium score was calculated using a non-enhanced scan protocol with the following parameters: 120 kV, 150 mA, and thickness 3 mm. The location of the lesions was determined using a 17-segment model by a CT radiologist. Significant stenosis was defined as coronary stenosis ≥50% of a major epicardial artery with a diameter ≥2.0 mm on CCTA, with the severity of the stenosis defined as moderate (stenosis 50–69%) or severe (stenosis 70–99%).14
Measurement and Analysis of FFRCT
CCTA raw data were transferred to core laboratory (HeartFlow) for analysis. The scientific rationale underpinning the computation of FFRCT
has been described in detail elsewhere.4
The FFRCT
indicates the approximate FFR value for each point on major coronary arteries >2 mm in diameter, including the side branches. In the present study, an independent physician blinded to the invasive FFR results performed FFRCT
measurements on an interactive website. FFRCT
values were obtained both 1–2 cm distal to the lower border of the stenosis, as per the recommendations of the expert panel,11
and at a far-distal site corresponding to the site where the invasive FFR was measured for each diseased vessel. To determine the point 1–2 cm distal to the lesion, a point 1–2 cm distal to the lesion was first identified on the workstation during CCTA analysis. Based on this information, a point 1–2 cm distal to the lesion was identified on the 3D analysis preview image of the FFRCT
on the dedicated website, and the FFRCT
was measured at this point. In the case of diffuse lesions and multiple lesions, the FFRCT
was measured 1–2 cm distal to the most severe site and the most proximal lesion, respectively.
ICA and Invasive FFR
ICA was performed by a physician using a standard technique. Invasive FFR was measured using a pressure wire (Pressure WireTM; Abbott Vascular, Santa Clara, CA, USA). Maximal hyperemia was induced by intravenous adenosine infusion (150–180 µg/kg/min) via the forearm or by intracoronary injection of papaverine (8–12 mg) or nicorandil (2 mg). FFR was measured at the far-distal site for all vessels with significant stenosis on CCTA, with values ≤0.80 representing physiologically significant CAD.
Statistical Analysis
The diagnostic performance of FFRCT
measured 1–2 cm distal to the stenosis and at the far-distal site was compared using the area under the curve (AUC) from receiver operating characteristic (ROC) curve analysis; Comparisons of AUCs were made using the DeLong method. The McNemar test was used to compare the reclassification rates of FFRCT
positivity based on FFRCT
values measured 1–2 cm distal to the stenosis and at the far-distal site. In addition, the McNemar test was used to compare the sensitivity, specificity, and accuracy of FFRCT
measured 1–2 cm distal to the stenosis and at the far-distal site. Fisher’s exact test and Chi-squared tests were used to compare the positive predictive value (PPV), negative predictive value (NPV), and other optimal proportions. Continuous data are expressed as the mean±SD or as the median with interquartile range (IQR). Categorical data are expressed as frequencies (%).
All analyses were performed using SPSS version 24.0 for Windows (SPSS Inc., Chicago, IL, USA) and R version 3.6.1 (R Foundation for Statistical Computing, Vienna, Australia). Statistical significance was set at 2-tailed P<0.05.
Results
The characteristics of the 146 patients examined in this study are presented in
Table 1. Approximately 98 (67%) patients were male, with a mean age of 70±10 years. According to the CCTA findings, 53 (36%) patients were diagnosed with single-vessel disease, whereas 93 (64%) patients were found to have multivessel disease (MVD), including left main trunk disease (LMTD). In addition, the CAD – Reporting and Data System (RADS) classification system was used: 84 (57%) patients were diagnosed as CAD-RADS 3, 46 (32%) were diagnosed as CAD-RADS 4A, and 16 (11%) were diagnosed as CAD-RADS 4B. The median Agatston score was 353 Hounsfield units (IQR 143–846 Hounsfield units).
Table 1.
Baseline Characteristics
| Patient characteristics (n=146) |
| Age (years) |
70±10 |
| Male sex |
98 (67) |
| Body mass index (kg/m2) |
24±3 |
| Hypertension |
107 (73) |
| Hyperlipidemia |
93 (64) |
| Diabetes |
63 (43) |
| Smoker |
89 (61) |
| Creatinine (mg/dL) |
0.96±0.88 |
| HbA1c (%) |
6.4±0.9 |
| LDL-C (mg/dL) |
122±30 |
| HDL-C (mg/dL) |
51±14 |
| Triglyceride (mg/dL) |
164±123 |
| Symptoms |
| Typical angina |
57 (39) |
| Atypical angina |
52 (36) |
| No symptom |
37 (25) |
| Patient-based CCTA findings (n=146) |
| Vessel severity |
| SVD |
53 (36) |
| MVD including LMTD |
93 (64) |
| CAD-RADS |
| 3 |
84 (57) |
| 4A |
46 (32) |
| 4B |
16 (11) |
| Agatston score (Hounsfield units) |
353 [143–846] |
| Interval between CCTA and ICA (days) |
21 [18–24] |
| Vessel-based CCTA findings (n=254) |
| Distribution of diseased vessels |
| LAD |
134 (53) |
| LCx |
61 (24) |
| RCA |
59 (23) |
| Lesion severity |
| Intermediate stenosis (50–69%) |
130 (51) |
| Severe stenosis (70–99%) |
124 (49) |
| Invasive FFR findings (n=254) |
| Invasive FFR |
0.79 [0.70–0.87] |
| Positive FFR (≤0.8) |
141 (56) |
Values are expressed as n (%) or the mean±SD or median [interquartile range]. CAD-RADS, Coronary Artery Disease – Reporting and Data System; CCTA, coronary computed tomography angiography; FFR, fractional flow reserve; HDL-C, high-density lipoprotein cholesterol; ICA, invasive coronary angiography; LAD, left ascending artery; LCx, left circumflex artery; LDL-C, low-density lipoprotein cholesterol; LMTD, left main trunk disease; MVD, multivessel disease; RCA, right coronary artery; SVD, single-vessel disease.
Among the entire population, 254 vessels were confirmed as having significant stenosis. Of these, 134 (53%) involved the left anterior descending artery, 61 (24%) involved the left circumflex artery, and 59 (23%) involved the right coronary artery. Regarding lesion severity, 130 (51%) and 124 (49%) vessels were considered to have intermediate and severe stenosis, respectively. The median interval from CCTA to ICA was 21 days (IQR 18–24 days), and the median invasive FFR value was 0.79 (IQR 0.70–0.87). The distribution of invasive FFR values in the examined diseased vessels is shown in the
Supplementary Figure. In all, 56% of examined vessels had physiologically significant CAD with an FFR ≤0.8, indicating that many patients with relatively severe stenosis were included in the present study.
Diagnostic Performance of FFRCT
Measured 1–2 cm Distal to the Stenosis in Detecting Physiologically Significant CAD
FFRCT
measurements 1–2 cm distal to the stenosis and at the far-distal site were obtained for a total of 246 diseased vessels. Based on ROC analysis, the AUC of the FFRCT
values was significantly greater for measurements made 1–2 cm distal to the stenosis than at the far-distal site (0.829 [95% CI 0.779–0.879] vs. 0.791 [95% CI 0.736–0.847], respectively; P=0.0305;
Figure 2).
The FFRCT
was positive in 83% and 66% of vessels for measurements taken at the far-distal site and 1–2 cm distal to the stenosis, respectively (P<0.0001). The reclassification rate of positive FFRCT
was 19% for measurements made 1–2 cm distal to the stenosis (Figure 3); therefore, particularly in the FFRCT
range 0.71–0.80, which was considered a gray zone, diagnostic accuracy improved from 36% to 58% (P=0.0052; improvement rate 61%;
Figure 4).

In vessel-based diagnostic performance for detecting physiologically significant CAD, FFRCT
measured 1–2 cm distal to the stenosis compared with FFRCT
measured at the far-distal site had a sensitivity of 87% vs. 94% (P=0.0039), a specificity of 60% vs. 29% (P<0.0001), a PPV of 73% vs. 62% (P=0.028), a NPV of 78% vs. 79% (P=0.958), and an accuracy of 75% vs. 65% (P<0.0001), respectively; the false-negative rates for FFRCT
measured 1–2 cm distal to the stenosis and at the far-distal site were 13% and 7% (P<0.0001), respectively, with corresponding false-positive rates of 40% and 71% (P=0.004), respectively (Table 2;
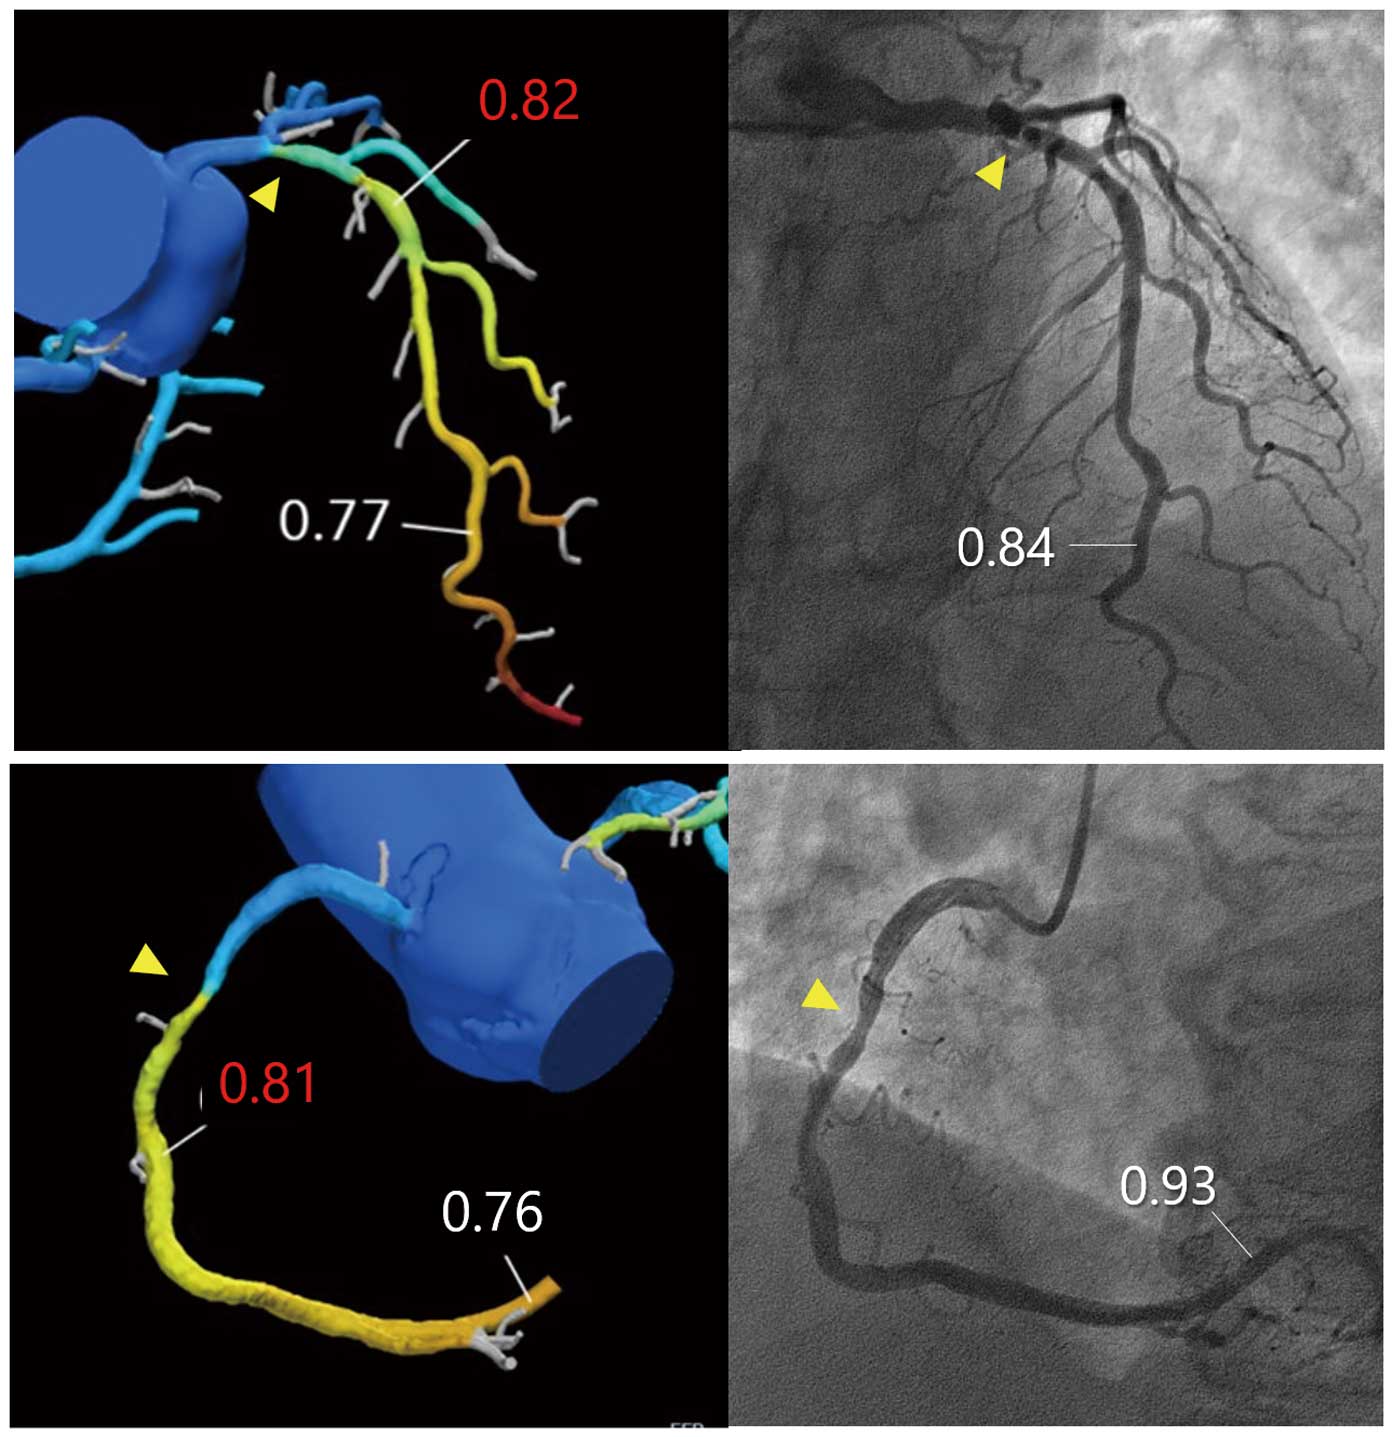
Figure 5). Two representative cases are shown in
Figure 6.
Table 2.
Vessel-Based Diagnostic Performance of Computed Tomography Angiography-Derived Fractional Flow Reserve According to Measurement Site (Far-Distal vs. 1–2 cm Distal to Stenosis)
| Overall (n=146) |
Measurement point |
P value |
| Far-distal |
1–2 cm distal to stenosis |
| Sensitivity (%) |
94 (90–96) |
87 (82–91) |
0.004 |
| Specificity (%) |
29 (24–33) |
60 (54–65) |
<0.0001 |
| PPV (%) |
62 (60–64) |
73 (69–76) |
0.028 |
| NPV (%) |
79 (65–88) |
78 (70–85) |
0.958 |
| Accuracy (%) |
65 (61–68) |
75 (69–79) |
<0.0001 |
| False-positive rate (%) |
71 |
40 |
<0.0001 |
| False-negative rate (%) |
7 |
13 |
0.004 |
Unless indicated otherwise, data are given as the median (interquartile range). NPV, negative predictive value; PPV, positive predictive value.
Discussion
In the present study we investigated the optimal measurement site of FFRCT
in the evaluation of physiologically significant CAD with an FFR ≤0.8. Using FFRCT
values measured 1–2 cm distal to the stenosis, the FFRCT
positivity rate was reduced from 83% to 66% (reclassification rate 19%) compared with FFRCT
measured at the conventional distal site, and, in particular, the diagnostic accuracy in the FFRCT
range 0.71–0.80 was improved by 61%. In addition, the overall diagnostic performance of FFRCT
for detecting physiologically significant CAD was significantly improved.
Adequacy of FFRCT
Measured 1–2 cm Distal to the Stenosis
In the present study, we used FFRCT
values measured 1–2 cm distal to the anatomical stenosis rather than using the lowest FFR value measured at the far-distal site, the currently accepted site for evaluating diseased vessels. FFRCT
values (usually the lowest FFR value measured at the far-distal site of the diseased vessel) have been shown to be reliably correlated with invasive FFR values.1,5
However, it has been reported that, in addition to assessing decreases in FFR along the length of coronary arteries with diffuse atherosclerosis, FFRCT
assesses the decrease in FFR along the length of the vessels even in the absence of focal stenoses.15
Therefore, the lowest FFRCT
values measured at a far-distal site may sometimes lead to false-positive results, and therefore may not be relevant for clinical decisions regarding ICA.
With regard to the measurement site of FFRCT, Cami et al reported that FFRCT
values measured 10.5 cm distal to the lesion were most indicative of the extent of ischemia in the lesion,10
with an expert panel subsequently recommending that FFRCT
measurements 1–2 cm distal to the stenosis are more appropriate than measurements at conventional distal sites.11
Kueh et al reported that by using FFRCT
values measured 1–2 cm distal to the stenoses, 44% of patients positive for the lowest FFRCT
value were reclassified as negative.9
Moreover, in patients who underwent ICA, revascularization efficiency was better in those with a positive FFRCT
measured 1–2 cm distal to the stenosis than in those considered positive based on the lowest FFRCT
value.9
Omori et al have also demonstrated better diagnostic performance of FFRCT
values measured 1–2 cm distal to the stenosis than those measured in a distant segment, with a significant benefit particularly in the diagnosis of LAD lesions.12
Thus, it seems that using FFRCT
values measured 1–2 cm distal to the stenoses may be more practical than relying on the lowest FFRCT
values in FFRCT
analysis. For this reason, FFRCT
values measured 1–2 cm distal to an anatomical stenoses were used in the present study instead of those measured at far-distal sites.
Impact of Diagnostic Performance Using FFRCT
Measured 1–2 cm Distal to the Anatomical Stenosis for Detecting Physiologically Significant CAD
In a meta-analysis of FFRCT, the overall diagnostic accuracy of FFRCT
was 82%, and this threshold was met when FFRCT
values were below 0.63 or above 0.83. However, for FFRCT
values between 0.64 and 0.82, the diagnostic accuracy is low, especially in the FFRCT
range 0.70–0.80, where diagnostic accuracy drops to approximately 46%; this is a known problem of FFRCT
analysis. Thus, diagnoses based on FFRCT
measured conventionally at far-distal sites are overestimated, and decisions based on FFRCT
alone may lead to overtreatment. In fact, in clinical practice, it is felt that a relatively large number of patients cannot be revascularized on the basis of decisions based on FFRCT
alone. A remedy for this problem, as described by the expert panel,11
is to change the point at which FFRCT
is measured to 1–2 cm distal to the anatomical stenosis. This approach has been shown to improve overestimation, leading to improved diagnostic accuracy and more efficient revascularisation.9,12
In the present study, using FFRCT
values measured 1–2 cm distal to the stenosis reduced the FFRCT
positivity rate from 83% to 66% (reclassification rate 19%) compared with the use of values measured at distal sites. This benefit was particularly marked in the FFRCT
range 0.7–0.8, which is considered a grey zone in FFRCT
assessment, with a 61% increase in accuracy in this zone. As a result, there were significant increases in specificity and the PPV, resulting in an improvement in overall diagnostic accuracy. Although the diagnostic sensitivity was slightly reduced for FFRCT
measured 1–2 cm distal to the stenosis, this was considered acceptable compared with that reported in previous studies. Thus, we believe that measuring FFRCT
1–2 cm distal to the stenosis will become a valid solution to improve the diagnostic accuracy of FFRCT
analysis.
Usefulness of FFRCT
as a Screening Method for Significant CAD in Clinical Settings
Stress myocardial perfusion imaging (MPI) has traditionally been used as a first-line non-invasive functional assessment in patients with suspected CAD, and the clinical prognosis in patients with normal findings is good, with few adverse cardiovascular events.16,17
However, in patients with MVD or LMTD, which may induce “balanced ischemia”, the diagnostic performance of stress MPI is reduced, and consequently patients with severe CAD may be overlooked. In addition, recent reports have suggested that stress MPI using invasive FFR as a reference standard has low diagnostic sensitivity,18
and there is a risk of overlooking severe disease while screening in clinical settings.
In contrast, FFRCT
has a high diagnostic sensitivity based on invasive FFR and has a high NPV,18
making it a useful screening method for patients with CAD, including patients with severe CAD. The previously published PLATFORM study showed that FFRCT
analysis prior to ICA can reduce unnecessary catheterization without compromising the diagnosis of patients with significant stenosis, resulting in a reduction in healthcare costs.7
However, the specificity and PPV of FFRCT
analysis are low, and many false-positives are recorded. Therefore, reconsideration of the measurement site for FFRCT
in the present study may lead to improved diagnostic accuracy of FFRCT
analysis, especially specificity and PPV. It has also been reported that reconsideration of the cut-off value of FFRCT
may improve diagnostic accuracy,19
and future large-scale studies that consider reconsideration of the measurement site or cut-off value are desirable.
Study Limitations
The present study has several limitations. First, this study was a retrospective single-center study with a relatively small number of patients. Second, the present study is a subanalysis of the ADVANCE Registry, which included patients who underwent invasive CAG based on the results of FFRCT; therefore, a large number of patients with significant stenosis were enrolled in the registry, whereas patients with non-significant stenosis were excluded, leading to a significant bias in terms of patient selection. In fact, in previous similar reports, only 20–30% of enrolled patients had severe stenosis >70%, with most remaining patients having intermediate stenosis. However, in the present study, approximately half the patients had severe stenosis, and this proportion is thought to be considerably higher than in previous reports. Basically, intermediate stenosis, for which ischemia is difficult to determine, is considered the indication for FFRCT
analysis, it may be necessary to investigate more patients with intermediate stenoses in future studies.
Third, coronary artery calcification is an important factor related to the overestimation of CAD in CCTA. The patients enrolled in this study had higher Agatston scores than those reported previously, and we may have included more patients with severe coronary calcification unsuitable for FFRCT
analysis in the present study. Finally, although this study examined the diagnostic accuracy of FFRCT
values measured 1–2 cm distal to the anatomical stenosis, there are few reports on similar examinations. Therefore, the generalization of our findings to clinical practice should be made with caution.
Because of these limitations, further large-scale studies with a large number of patients are needed to confirm our results.
Conclusions
The use of FFRCT
values measured 1–2 cm distal to the anatomical stenosis allowed for a significant reclassification of patients with positive FFRCT
measured at far-distal sites and significantly increased accuracy in the “gray zone” of FFRCT
(0.71–0.80), resulting in a significant improvement in the diagnostic performance of FFRCT.
Acknowledgment
The authors thank Editage (www.editage.com) for English language editing a version of this manuscript.
Sources of Funding
This study did not receive any specific funding.
Disclosures
All authors have no conflicts of interest to disclose.
IRB Information
This study was approved by the Institutional Review Board of Shin-Koga Hospital (Approval no. 2018-05-14).
Data Availability
The deidentified participant data will not be shared.
Supplementary Files
Please find supplementary file(s);
http://dx.doi.org/10.1253/circrep.CR-21-0093
References
- 1.
Koo BK, Erglis A, Doh JH, Daniels DV, Jegere S, Kim HS, et al. Diagnosis of ischemia-causing coronary stenoses by noninvasive fractional flow reserve computed from coronary computed tomographic angiograms: Results from the prospective multicenter DISCOVER-FLOW (Diagnosis of Ischemia-Causing Stenoses Obtained Via Noninvasive Fractional Flow Reserve) study. J Am Coll Cardiol 2011; 58: 1989–1997.
- 2.
Min JK, Leipsic J, Pencina MJ, Berman DS, Koo BK, van Mieghem C, et al. Diagnostic accuracy of fractional flow reserve from anatomic CT angiography. JAMA 2012; 308: 1237–1245.
- 3.
Min JK, Berman DS, Budoff MJ, Jaffer FA, Leipsic J, Leon MB, et al. Rationale and design of the DeFACTO (Determination of Fractional Flow Reserve by Anatomic Computed Tomographic AngiOgraphy) study. J Cardiovasc Comput Tomogr 2011; 5: 301–309.
- 4.
Taylor CA, Fonte TA, Min JK. Computational fluid dynamics applied to cardiac computed tomography for noninvasive quantification of fractional flow reserve: Scientific basis. J Am Coll Cardiol 2013; 61: 2233–2241.
- 5.
Norgaard BL, Leipsic J, Gaur S, Seneviratne S, Ko BS, Ito H, et al. Diagnostic performance of noninvasive fractional flow reserve derived from coronary computed tomography angiography in suspected coronary artery disease: The NXT trial (Analysis of Coronary Blood Flow Using CT Angiography: Next Steps). J Am Coll Cardiol 2014; 63: 1145–1155.
- 6.
Douglas PS, Pontone G, Hlatky MA, Patel MR, Norgaard BL, Byrne RA, et al. Clinical outcomes of fractional flow reserve by computed tomographic angiography-guided diagnostic strategies vs. usual care in patients with suspected coronary artery disease: The prospective longitudinal trial of FFR(CT): Outcome and resource impacts study. Eur Heart J 2015; 36: 3359–3367.
- 7.
Hlatky MA, De Bruyne B, Pontone G, Patel MR, Norgaard BL, Byrne RA, et al. Quality-of-life and economic outcomes of assessing fractional flow reserve with computed tomography angiography: PLATFORM. J Am Coll Cardiol 2015; 66: 2315–2323.
- 8.
Curzen NP, Nolan J, Zaman AG, Norgaard BL, Rajani R. Does the routine availability of CT-derived FFR influence management of patients with stable chest pain compared to CT angiography alone?: The FFRCT RIPCORD study. JACC Cardiovasc Imaging 2016; 9: 1188–1194.
- 9.
Kueh SH, Mooney J, Ohana M, Kim U, Blanke P, Grover R, et al. Fractional flow reserve derived from coronary computed tomography angiography reclassification rate using value distal to lesion compared to lowest value. J Cardiovasc Comput Tomogr 2017; 11: 462–467.
- 10.
Cami E, Tagami T, Raff G, Fonte TA, Renard B, Gallagher MJ, et al. Assessment of lesion-specific ischemia using fractional flow reserve (FFR) profiles derived from coronary computed tomography angiography (FFRCT) and invasive pressure measurements (FFRINV): Importance of the site of measurement and implications for patient referral for invasive coronary angiography and percutaneous coronary intervention. J Cardiovasc Comput Tomogr 2018; 12: 480–492.
- 11.
Norgaard BL, Fairbairn TA, Safian RD, Rabbat MG, Ko B, Jensen JM, et al. Coronary CT angiography-derived fractional flow reserve testing in patients with stable coronary artery disease: Recommendations on interpretation and reporting. Radiol Cardiothorac Imaging 2019; 1: e190050.
- 12.
Omori H, Hara M, Sobue Y, Kawase Y, Mizukami T, Tanigaki T, et al. Determination of the optimal measurement point for fractional flow reserve derived from CT angiography using pressure wire assessment as reference. AJR Am J Roentgenol 2021; 216: 1492–1499.
- 13.
Fairbairn TA, Nieman K, Akasaka T, Norgaard BL, Berman DS, Raff G, et al. Real-world clinical utility and impact on clinical decision-making of coronary computed tomography angiography-derived fractional flow reserve: Lessons from the ADVANCE Registry. Eur Heart J 2018; 39: 3701–3711.
- 14.
Leipsic J, Abbara S, Achenbach S, Cury R, Earls JP, Mancini GJ, et al. SCCT guidelines for the interpretation and reporting of coronary CT angiography: A report of the Society of Cardiovascular Computed Tomography Guidelines Committee. J Cardiovasc Comput Tomogr 2014; 8: 342–358.
- 15.
Rabbat MG, Berman DS, Kern M, Raff G, Chinnaiyan K, Koweek L, et al. Interpreting results of coronary computed tomography angiography-derived fractional flow reserve in clinical practice. J Cardiovasc Comput Tomogr 2017; 11: 383–388.
- 16.
Beller GA, Zaret BL. Contributions of nuclear cardiology to diagnosis and prognosis of patients with coronary artery disease. Circulation 2000; 101: 1465–1478.
- 17.
Hachamovitch R, Berman DS, Shaw LJ, Kiat H, Cohen I, Cabico JA, et al. Incremental prognostic value of myocardial perfusion single photon emission computed tomography for the prediction of cardiac death: Differential stratification for risk of cardiac death and myocardial infarction. Circulation 1998; 97: 535–543.
- 18.
Sand NPR, Veien KT, Nielsen SS, Norgaard BL, Larsen P, Johansen A, et al. Prospective comparison of FFR derived from coronary CT angiography with SPECT perfusion imaging in stable coronary artery disease: The ReASSESS study. JACC Cardiovasc Imaging 2018; 11: 1640–1650.
- 19.
Matsumura-Nakano Y, Kawaji T, Shiomi H, Kawai-Miyake K, Kataoka M, Koizumi K, et al. Optimal cutoff value of fractional flow reserve derived from coronary computed tomography angiography for predicting hemodynamically significant coronary artery disease. Circ Cardiovasc Imaging 2019; 12: e008905.