Abstract
Background:
Pulmonary hypertension (PH) is characterized by dysregulation of small pulmonary arteries. In addition to endostatin (ES), placenta growth factor (PlGF), vascular endothelial growth factor-A (VEGF-A), and the anti-angiogenesis isoform of VEGF-A (VEGF-A165b) are associated with PH. However, the usefulness of these biomarkers in PH in unknown. We investigated whether these 4 biomarkers are related to PH classification.
Methods and Results:
Between July 2015 and August 2017, 33 control patients and 107 PH patients were enrolled in the study. Among the PH patients, 48 had pulmonary arterial hypertension (PAH), 5 had left heart disease-associated PH (LHD-PH), 4 had lung disease-associated PH (LD-PH), and 50 had chronic thromboembolic PH (CTEPH). Among the PAH patients, 16 had idiopathic PAH (IPAH) and 17 had connective tissue disease-associated PAH (CTD-PAH). PlGF, total VEGF-A, and VEGF-A165b levels were measured in the control and PH groups. ES was only measured in the PH group. VEGF-A165b levels were significantly higher in the LD-PH group than in the PAH, LHD-PH, and CTEPH groups (all P<0.001). PlGF levels were significantly higher in the CTD-PAH group than in the IPAH and control groups. ES levels were significantly correlated with the 6-min walk distance (P<0.001), B-type natriuretic peptide (P<0.001), and pulmonary vascular resistance (P=0.008).
Conclusions:
ES could detect CTD-PAH in PAH and may be an indicator of PH severity. VEGF-A165b was useful in detecting LD-PH.
Pulmonary hypertension (PH) is a pathophysiological disorder that may involve multiple clinical conditions and can complicate the majority of cardiovascular and respiratory diseases.1
PH is generally divided into 5 groups according to the cause of PH, as follows: Group 1, pulmonary arterial hypertension (PAH); Group 2, PH due to left heart disease (LHD-PH); Group 3, PH due to chronic lung disease and/or hypoxia (LD-PH); Group 4, chronic thromboembolic PH (CTEPH); and Group 5, PH due to unclear multifactorial mechanisms.2
Group 1 PH includes idiopathic PAH (IPAH) and hereditary PAH (HPAH), as well as PAH associated with conditions such as connective tissue disease (CTD-PAH), congenital heart disease (CHD-PAH), and cirrhosis and portal hypertension (PoPH).3
At present, B-type natriuretic peptide (BNP) and N-terminal pro BNP (NT-proBNP) are considered useful biomarkers for the diagnosis of PH.4
However, BNP and NT-proBNP reflect cardiac wall stress due to high pulmonary arterial pressure of both PAH and LHD-PH.5
Therefore, other biomarkers that are specific for PH and do not depend on cardiac wall stress are needed.
PAH progression depends on the remodeling of the endothelium and smooth muscle cells of the pulmonary artery, which is known to be closely related to angiogenesis.6
Therefore, angiogenic and angiostatic factors, such as endostatin (ES), placenta growth factor (PlGF), vascular endothelial growth factor-A (VEGF-A), and the anti-angiogenesis isoform of VEGF-A (VEGF-A165b), which are thought to be associated with the development and progression of PH, may be potential biomarkers.7–10
The aim of the present study was to verify the usefulness of serum ES (sES), PlGF, VEGF-A and VEGF-A165b concentrations in classifying the etiology of PH, as well as their correlation with disease severity in patients with PH.
Methods
Study Subjects
In all, 107 consecutive patients with PH diagnosed by right heart catheterization (RHC) were enrolled in this study from July 2013 to June 2017. The exclusion criteria were infection, cancer, use of VEGF-targeted drugs, and hemodialysis. PH was divided into 5 groups according to the guidelines, namely PAH (Group 1), LHD-PH (Group 2), LD-PAH (Group 3), CTEPH (Group 4), and PH caused by unknown mechanisms (Group 5). Group 1 was further divided into 4 subgroups: IPAH, CTD-PAH, CHD-PAH, and PoPH. PH was defined as mean pulmonary arterial pressure (mPAP) ≥25 mmHg at rest, and PAH was defined as both mPAP ≥25 mmHg and pulmonary artery wedge pressure (PAWP) ≤15 mmHg. Among the PH patients, those with PAWP >15 mmHg were classified as Group 2; those with a percent predicted forced expiratory volume in 1 second (FEV 1.0%) <70% or total lung volume (TLC) <60% in pulmonary function tests, and lung disease (e.g., chronic obstructive pulmonary disease [COPD] or idiopathic pulmonary fibrosis [IPF]) that was identified by computed tomography (CT) were classified as Group 3; and patients who developed a mismatch in ventilation-perfusion scintigraphy and who had a thrombus identified by contrast CT were classified as Group 4. Patients who were allocated to Group 5 were excluded from the study. The remaining patients who had not been allocated to Groups 2–5 were classified as Group 1.
Based on physical findings, the results of blood tests, echocardiography, and radiographic findings, patients in Group 1 were subdivided into CTD-PAH, CHD-PAH, and PoPH. IPAH was defined as any patient in whom the cause of PH could not be determined. Patients who had a family history of IPAH were defined as having HPAH. Forty patients had not received any pulmonary artery dilators at the time of referral (i.e., treatment-naive patients).
This study was approved by the Ethics Review Board of Nagoya University Graduate School of Medicine (Approval no. 2017-0099 and 2015-0142). The study was performed in accordance with the Declaration of Helsinki and the ethical standards of the responsible committee on human experimentation at the Nagoya University Graduate School of Medicine.
Data and Sample Collection
Patients’ clinical characteristics and data were collected retrospectively from their medical records. The extracted data included the date of diagnosis, age, sex, underlying disease, height, weight, World Health Organization (WHO) functional class (FC), vital signs, and results of laboratory tests, echocardiography, radiographic tests, and cardiac catheterization.
Measurement of Total VEGF-A and VEGF-A165b
Serum total VEGF-A (sVEGF-A) concentrations were determined using an ELISA kit (Human VEGF Quantikine ELISA Kit, DVE00; R&D Systems, Minneapolis, MN, USA) according to the manufacturer’s instructions. The limit of detection of the assay was 9pg/mL, with intra- and interassay coefficients of variation (CVs) of 4.5% and 7.0%, respectively. Serum VEGF-A165b (sVEGF-A165b) concentrations were also determined using an ELISA kit (Human Vascular Endothelial Growth Factor-165b ELISA Kit, MBS720132; MyBiosource, San Diego, CA, USA). The limit of detection of this assay was 1pg/mL, with intra- and interassay CVs both being <10%.
Measurement of ES and PlGF
sES concentrations were determined using a human Solid Phase Sandwich ELISA (R&D System, Wiesbaden, Germany). The analytical sensitivity of this kit is 0.063 ng/mL (assay range 0.031–10 ng/mL), with and intra-assay CV of 5.5%. Recombinant human PlGF was obtained from the Cobas system.
Statistical Analysis
All PAH patients were diagnosed by RHC. The significance of differences between the 4 groups were assessed using Chi-squared or Kruskal-Wallis tests for categorical variables, and a t-test or Welch test for continuous variables. Patient characteristics at baseline are reported as the mean±SD for continuous variables or as proportions with percentages for categorical variables. One-way analysis of variance (ANOVA), Tukey’s post hoc test, Chi-squared test, or the Kruskal-Wallis test were used for comparisons between groups, as appropriate. Correlation analyses for biomarker concentrations were conducted using Pearson’s or Spearman’s coefficient, as appropriate. Two-sided P<0.05 was considered statistically significant. Statistical analyses were performed using IBM SPSS Statistics 21.0 (IBM, Armonk, NY, USA).
Results
Patient Characteristics and Hemodynamics
The clinical characteristics and hemodynamics of the patient population and each group are presented in
Table 1. Of the 107 PH patients, 48 (44.9%) were in Group 1, 5 (4.7%) were in Group 2, 4 (3.7%) were in Group 3, and 50 (46.7%) were in Group 4. There were significant differences among the groups in terms of age, sex, and plasma hemoglobin concentrations; 85% and 58% of patients in Groups 1 and 4, respectively, were female. Hemoglobin levels were significantly higher in Group 3 than in the other groups. With regard to hemodynamics, there were significant differences among the groups in diastolic pulmonary pressure (dPAP), cardiac index (CI), mean right pressure (mRAP), and PAWP. dPAP and CI were significantly higher in Group 1, and mRAP was significantly lower in Group 3. There were no significant differences in the other indicators among the groups.
Table 1.
Characteristics and Hemodynamics of Patients With PH
| Variables |
Group 1
(n=48) |
Group 2
(n=5) |
Group 3
(n=4) |
Group 4
(n=50) |
P value |
| Age (years) |
49.4±17.8 |
62.0±9.4 |
69.0±5.1 |
62.1±14.5 |
0.001 |
| Female sex (%) |
85 |
0 |
0 |
58 |
<0.001 |
| BMI (kg/m2) |
23.5±5.7 |
24.2±3.7 |
23.0±1.9 |
23.8±5.0 |
0.978 |
| SBP (mmHg) |
124.6±24.1 |
146.4±25.0 |
129.3±19.1 |
127.3±19.8 |
0.219 |
| DBP (mmHg) |
63.5±11.2 |
67.4±3.2 |
63.5±7.7 |
63.8±9.6 |
0.883 |
| Heart rate (beats/min) |
74.3±12.9 |
73.0±17.6 |
57.5±7.3 |
73.9±13.6 |
0.120 |
| WHO functional class |
| I |
1 (2.1) |
0 (0) |
0 (0) |
3 (6.0) |
|
| II |
22 (45.8) |
3 (60.0) |
0 (0) |
19 (38.0) |
|
| III |
23 (47.9) |
2 (40.0) |
4 (100.0) |
24 (48.0) |
|
| IV |
2 (4.2) |
0 (0) |
0 (0) |
4 (8.0) |
|
| Laboratory test |
| Hemoglobin (g/dL) |
12.3±1.9 |
12.0±1.5 |
15.7±1.7 |
13.2±2.2 |
0.005 |
| Platelets (×103/μL) |
204.0±76.1 |
184.2±95.8 |
180.5±35.4 |
231.7±64.3 |
0.127 |
| Uric acid (mg/dL) |
6.0±2.1 |
6.1±1.2 |
5.6±1.2 |
6.0±1.7 |
0.977 |
| eGFR (mL/min/1.73 m2) |
81.8±29.7 |
67.7±25.3 |
68.1±21.9 |
74.2±26.2 |
0.060 |
| BNP (pg/mL) |
111.1±355.3 |
144.9±90.8 |
62.2±5.9 |
124.5±230.0 |
0.970 |
| 6MWD (m) |
410.6±141.0 |
|
344.5±36.1 |
426.9±121.9 |
0.655 |
| Peak V̇O2 (mL/kg/min) |
15.8±5.9 |
19.5 |
|
14.5±3.9 |
0.664 |
| Hemodynamics |
| sPAP (mmHg) |
60.7±20.6 |
60.6±15.8 |
55.0±14.5 |
61.5±18.3 |
0.934 |
| dPAP (mmHg) |
23.4±9.4 |
20.4±3.8 |
21.3±8.2 |
18.6±6.0 |
0.033 |
| mPAP (mmHg) |
37.5±12.4 |
34.2±7.5 |
33.8±7.8 |
33.8±7.8 |
0.616 |
| Cardiac index (L·min−1·m−2) |
2.70±0.79 |
1.99±0.48 |
1.96±0.24 |
2.33±0.59 |
0.010 |
| RAP (mmHg) |
5.90±3.00 |
12.40±5.81 |
6.00±4.08 |
5.87±3.89 |
0.002 |
| PVR (mmHg) |
7.73±5.51 |
4.74±3.35 |
5.74±1.75 |
7.57±4.33 |
0.523 |
| PAWP (mmHg) |
8.73±3.33 |
20.40±5.08 |
13.80±5.19 |
9.18±3.62 |
<0.001 |
| Echocardiogram parameters |
| TRPG (mmHg) |
56.2±20.4 |
63.7±18.7 |
56.5±11.9 |
60.4±23.8 |
0.779 |
| TAPSE (mm) |
19.0±3.8 |
14.0 |
17.7±5.4 |
18.5±4.4 |
0.612 |
| s’ (mm) |
11.4±2.4 |
|
10.5±3.2 |
11.7±2.8 |
0.764 |
| RVFAC (%) |
36.1±10.3 |
|
27.9±9.8 |
36.2±12.6 |
0.606 |
Data are given as the mean±SD, median (45–75%), or n (%). 6MWD, 6-min walk distance; BMI, body mass index; BNP, B-type natriuretic peptide; DBP, diastolic blood pressure; dPAP, diastolic pulmonary artery pressure; eGFR, estimated glomerular filtration rate; Group 1, pulmonary arterial hypertension; Group 2, pulmonary hypertension (PH) due to left heart disease; Group 3, PH due to chronic lung disease and/or hypoxia; Group 4, chronic thromboembolic pulmonary hypertension; mPAP, mean pulmonary artery pressure; PAWP, pulmonary artery wedge pressure; PVR, pulmonary vascular resistance; RAP, right atrial pressure; RVFAC, right ventricular fractional area change; SBP, systolic blood pressure; sPAP, systolic pulmonary artery pressure; TAPSE, tricuspid annular plane systolic excursion; TRPG, tricuspid regurgitation pressure gradient; WHO, World Health Organization.
The clinical characteristics and hemodynamics of the Group 1 patient population and subgroups are presented in
Table 2. In Group 1, 16 patients had IPAH, 17 had CTD-PAH, 6 had CHD-PAH, and 5 had PoPH. There were significant differences in age and plasma platelet levels, and in the 6-min walk distance (6MWD) between the subgroups. Patients with CTD-PAH were older and had a significantly shorter 6MWD. With regard to hemodynamics, systolic pulmonary arterial pressure and mean pulmonary arterial pressure (mPAP) differed significantly among the subgroups. mPAP was significantly higher in the IPAH subgroup and pulmonary vascular resistance (PVR) tended to be higher in the IPAH than in the other subgroups. There were no significant differences in the other indicators among the subgroups.
Table 2.
Characteristics and Hemodynamics of the Subgroups in Group 1 (PAH)
| Variables |
IPAH
(n=16) |
CTD-PH
(n=17) |
ACHD-PH
(n=6) |
PoPH
(n=5) |
P value |
| Age (years) |
41.3±16.0 |
57.4±18.9 |
40.7±17.9 |
51.6±6.4 |
0.040 |
| Female sex (%) |
81 |
100 |
67 |
60 |
0.077 |
| BMI (kg/m2) |
23.3±5.6 |
24.6±6.5 |
20.2±3.4 |
25.1±6.2 |
0.420 |
| SBP (mmHg) |
126.3±25.9 |
130.1±27.3 |
67.0±8.0 |
57.4±8.6 |
0.355 |
| DBP (mmHg) |
61.4±12.1 |
66.1±12.6 |
88.1±8.8 |
57.4±8.6 |
0.348 |
| Heart rate (beats/min) |
70.0±12.4 |
77.6±14.3 |
71.2±13.7 |
80.3±5.1 |
0.282 |
| WHO functional class |
| I |
0 (0.0) |
0 (0.0) |
1 (6.7) |
0 (0) |
|
| II |
10 (62.5) |
6 (31.6) |
7 (46.7) |
4 (80.0) |
|
| III |
5 (31.3) |
12 (63.2) |
7 (46.7) |
1 (20.0) |
|
| IV |
1 (6.3) |
1 (5.3) |
0 (0) |
0 (0) |
|
| Laboratory tests |
| Hemoglobin (g/dL) |
13.0±1.8 |
11.6±1.6 |
13.6±1.5 |
12.0±2.9 |
0.070 |
| Platelets (103/μL) |
232.7±63.4 |
212.7±90.2 |
193.7±48.0 |
115.8±35.2 |
0.025 |
| Uric acid (mg/dL) |
5.7±2.7 |
6.3±1.6 |
6.1±1.9 |
5.7±2.3 |
0.864 |
| BNP (pg/mL) |
51.2±115.0 |
76.9±79.8 |
47.8±33.8 |
17.8±8.7 |
0.632 |
| 6MWD (m) |
471.2±171.6 |
219.0±49.6 |
478.1±99.3 |
454.5±57.1 |
0.016 |
| Peak V̇O2 (mL/kg/min) |
16.7±7.3 |
12.7±4.4 |
16.0 |
17.8±6.8 |
0.732 |
| Hemodynamics |
| sPAP (mmHg) |
69.3±18.5 |
54.6±17.4 |
63.8±24.9 |
41.4±15.1 |
0.024 |
| dPAP (mmHg) |
25.6±9.8 |
21.3±6.9 |
28.2±14.2 |
17.0±6.8 |
0.138 |
| mPAP (mmHg) |
42.0±11.3 |
34.0±9.6 |
41.7±17.8 |
26.4±9.5 |
0.037 |
| Cardiac index (L·min−1·m−2) |
2.56±0.74 |
2.63±0.80 |
2.73±0.67 |
3.50±1.00 |
0.140 |
| RAP (mmHg) |
5.39±2.87 |
6.60±3.55 |
6.17±2.64 |
5.40±2.51 |
0.695 |
| PVR (mmHg) |
10.44±7.80 |
6.63±3.00 |
6.98±3.30 |
3.37±1.33 |
0.051 |
| PAWP (mmHg) |
8.13±2.94 |
9.12±3.62 |
7.83±3.13 |
7.80±2.6 |
0.727 |
| Echocardiogram parameters |
| TRPG (mmHg) |
62.6±18.6 |
53.6±23.2 |
64.2±14.0 |
45.0±11.3 |
0.253 |
| TAPSE (mm) |
19.6±4.4 |
19.0±3.4 |
18.0±5.2 |
19.3±2.7 |
0.869 |
| s’ (mm) |
11.2±2.1 |
11.3±2.6 |
10.6±2.2 |
12.8±3.5 |
0.539 |
| RVFAC (%) |
33.7±10.4 |
38.7±8.3 |
35.9±11.2 |
41.6±12.2 |
0.408 |
Data are given as the mean±SD, median (45–75%), or n (%). ACHD-PH, adult congenital heart disease-associated pulmonary hypertension; CTD-PAH, connective tissue disease-associated pulmonary arterial hypertension (PAH); IPAH, idiopathic PAH; PoPH, cirrhosis and portal hypertension. Other abbreviations as in Table 1.
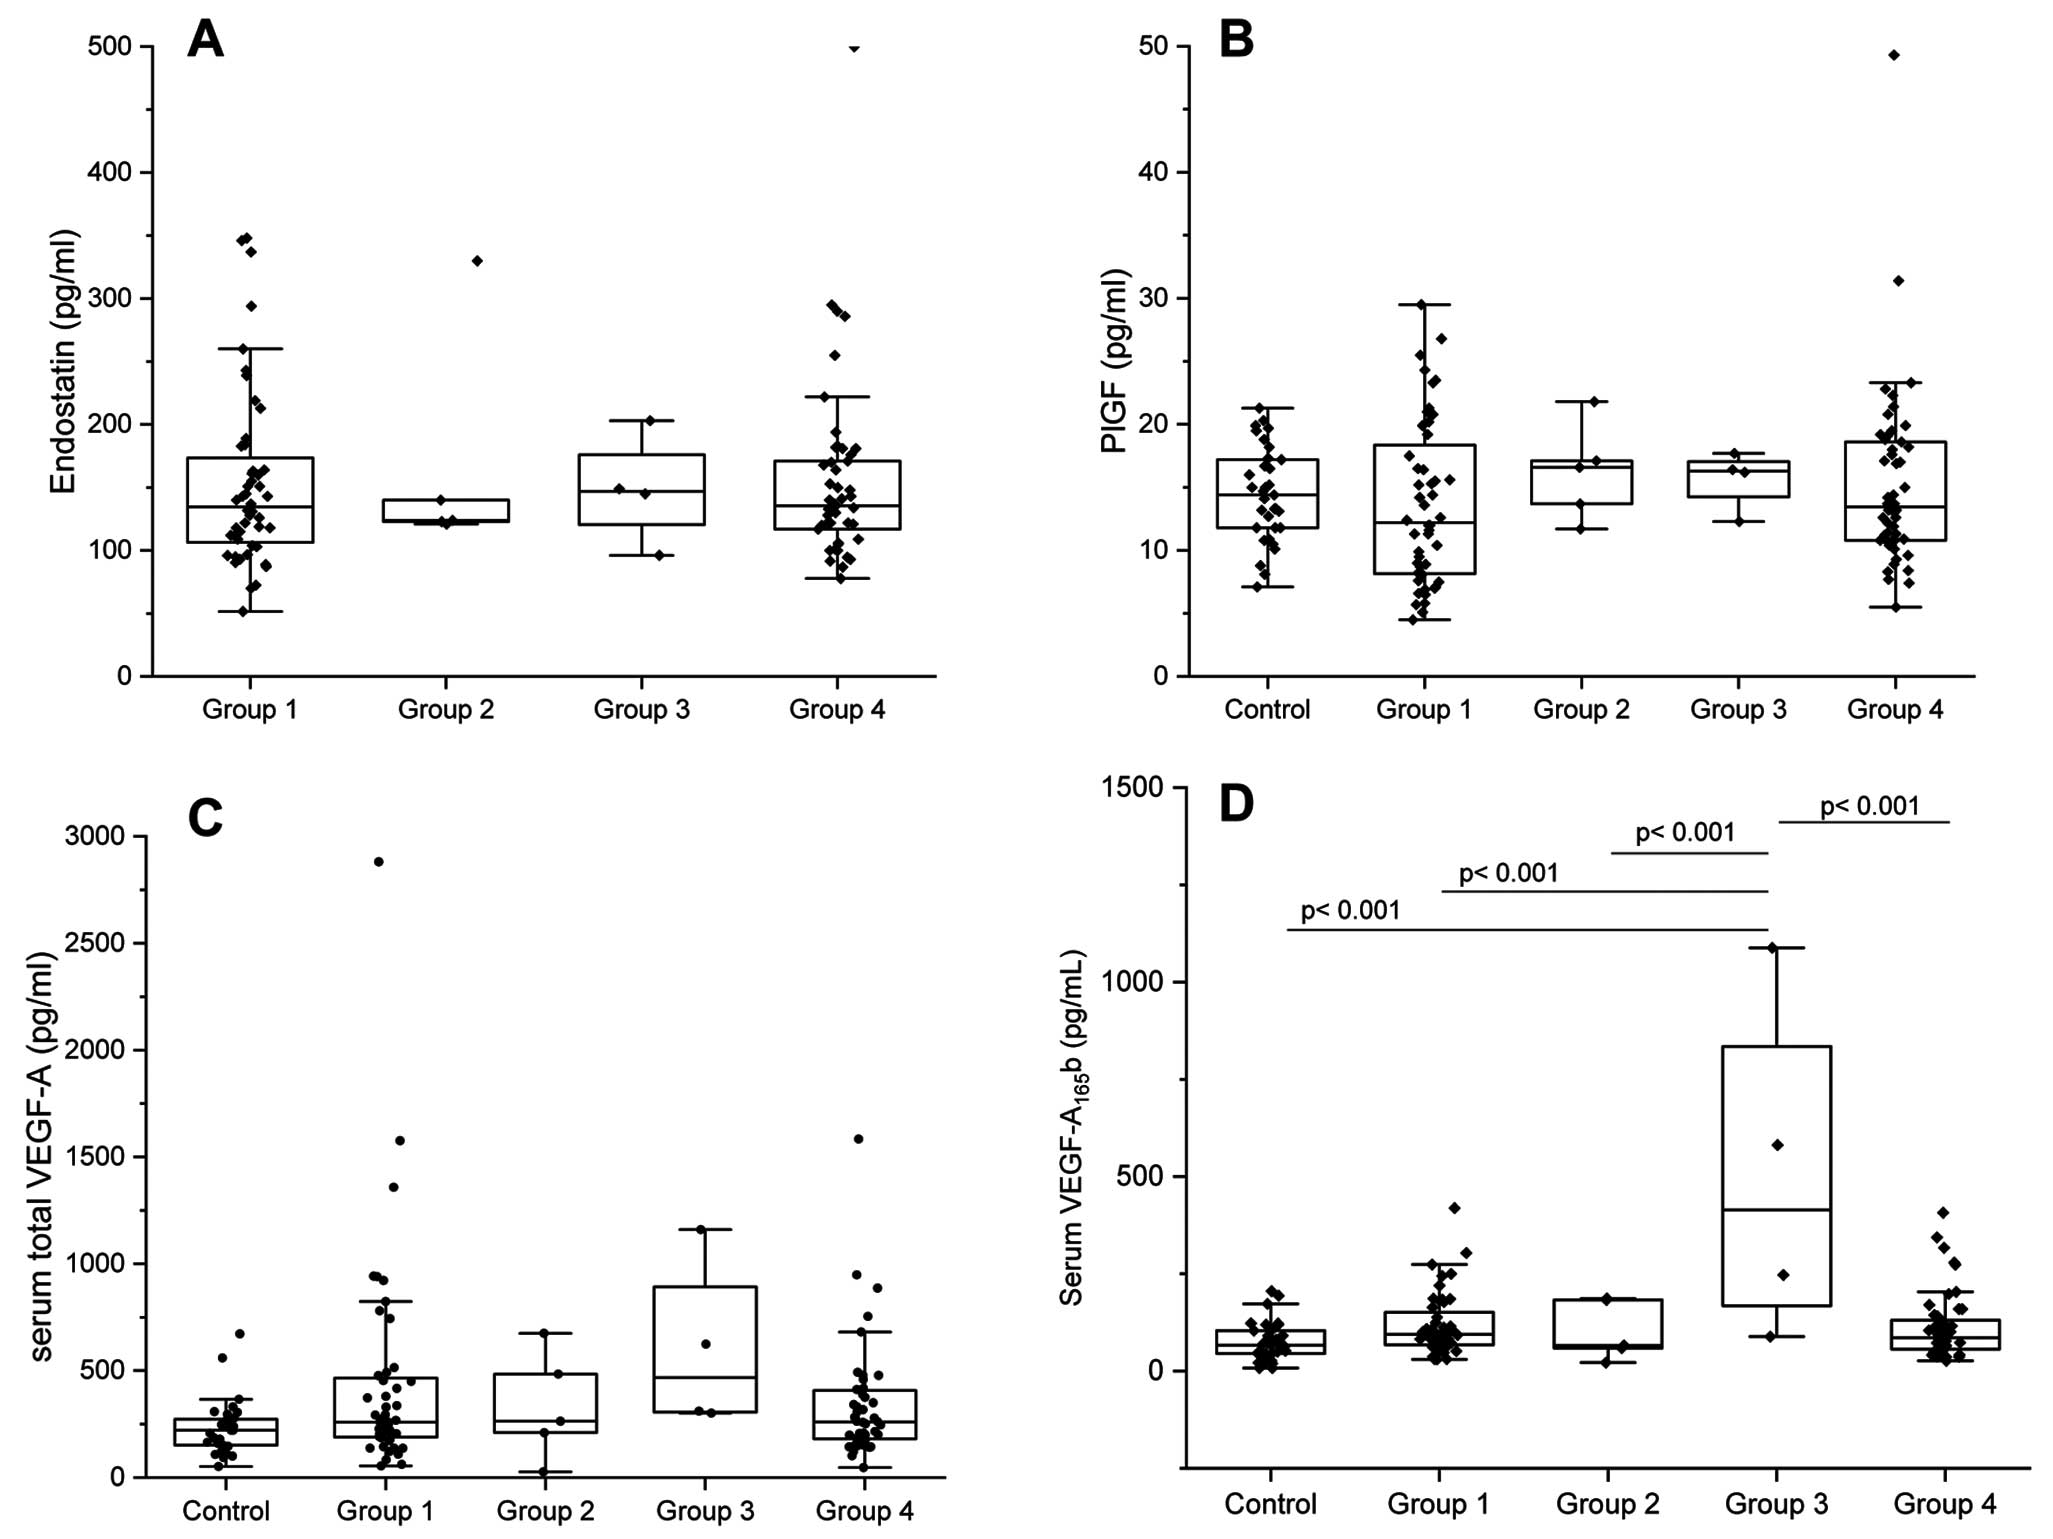
Comparisons of sES, sPlGF, sVEGF-A, and sVEGF-A165b among the groups are shown in
Figure 1. There were no significant differences in sVEGF-A, sPlGF, and sES among Groups 1–4. However, sVEGF-A165b was significantly higher in Group 3 than in the other groups (P<0.001 for all).
Comparisons of Serum Biomarker Levels Among Group 1 Subgroups
Comparisons of sES, sPlGF, sVEGF-A, and sVEGF-A165b among the Group 1 subgroups are shown in
Figure 2. There were no significant differences in sVEGF-A among the subgroups. However, sVEGF-A165b was significantly higher in the CTD-PAH and CHD-PAH groups compared with the control cohort (CTD-PAH, P=0.015; CHD-PAH, P=0.009). sPlGF was significantly higher in patients with CTD-PAH than IPAH (P<0.001). Compared with the control cohort, there were significant increases in PlGF in both the IPAH or HPAH and CTD-PAH groups. sES was significantly higher in patients with CTD-PAH than PoPH.
Relationship Between Biomarkers and Hemodynamics or Exercise Tolerance
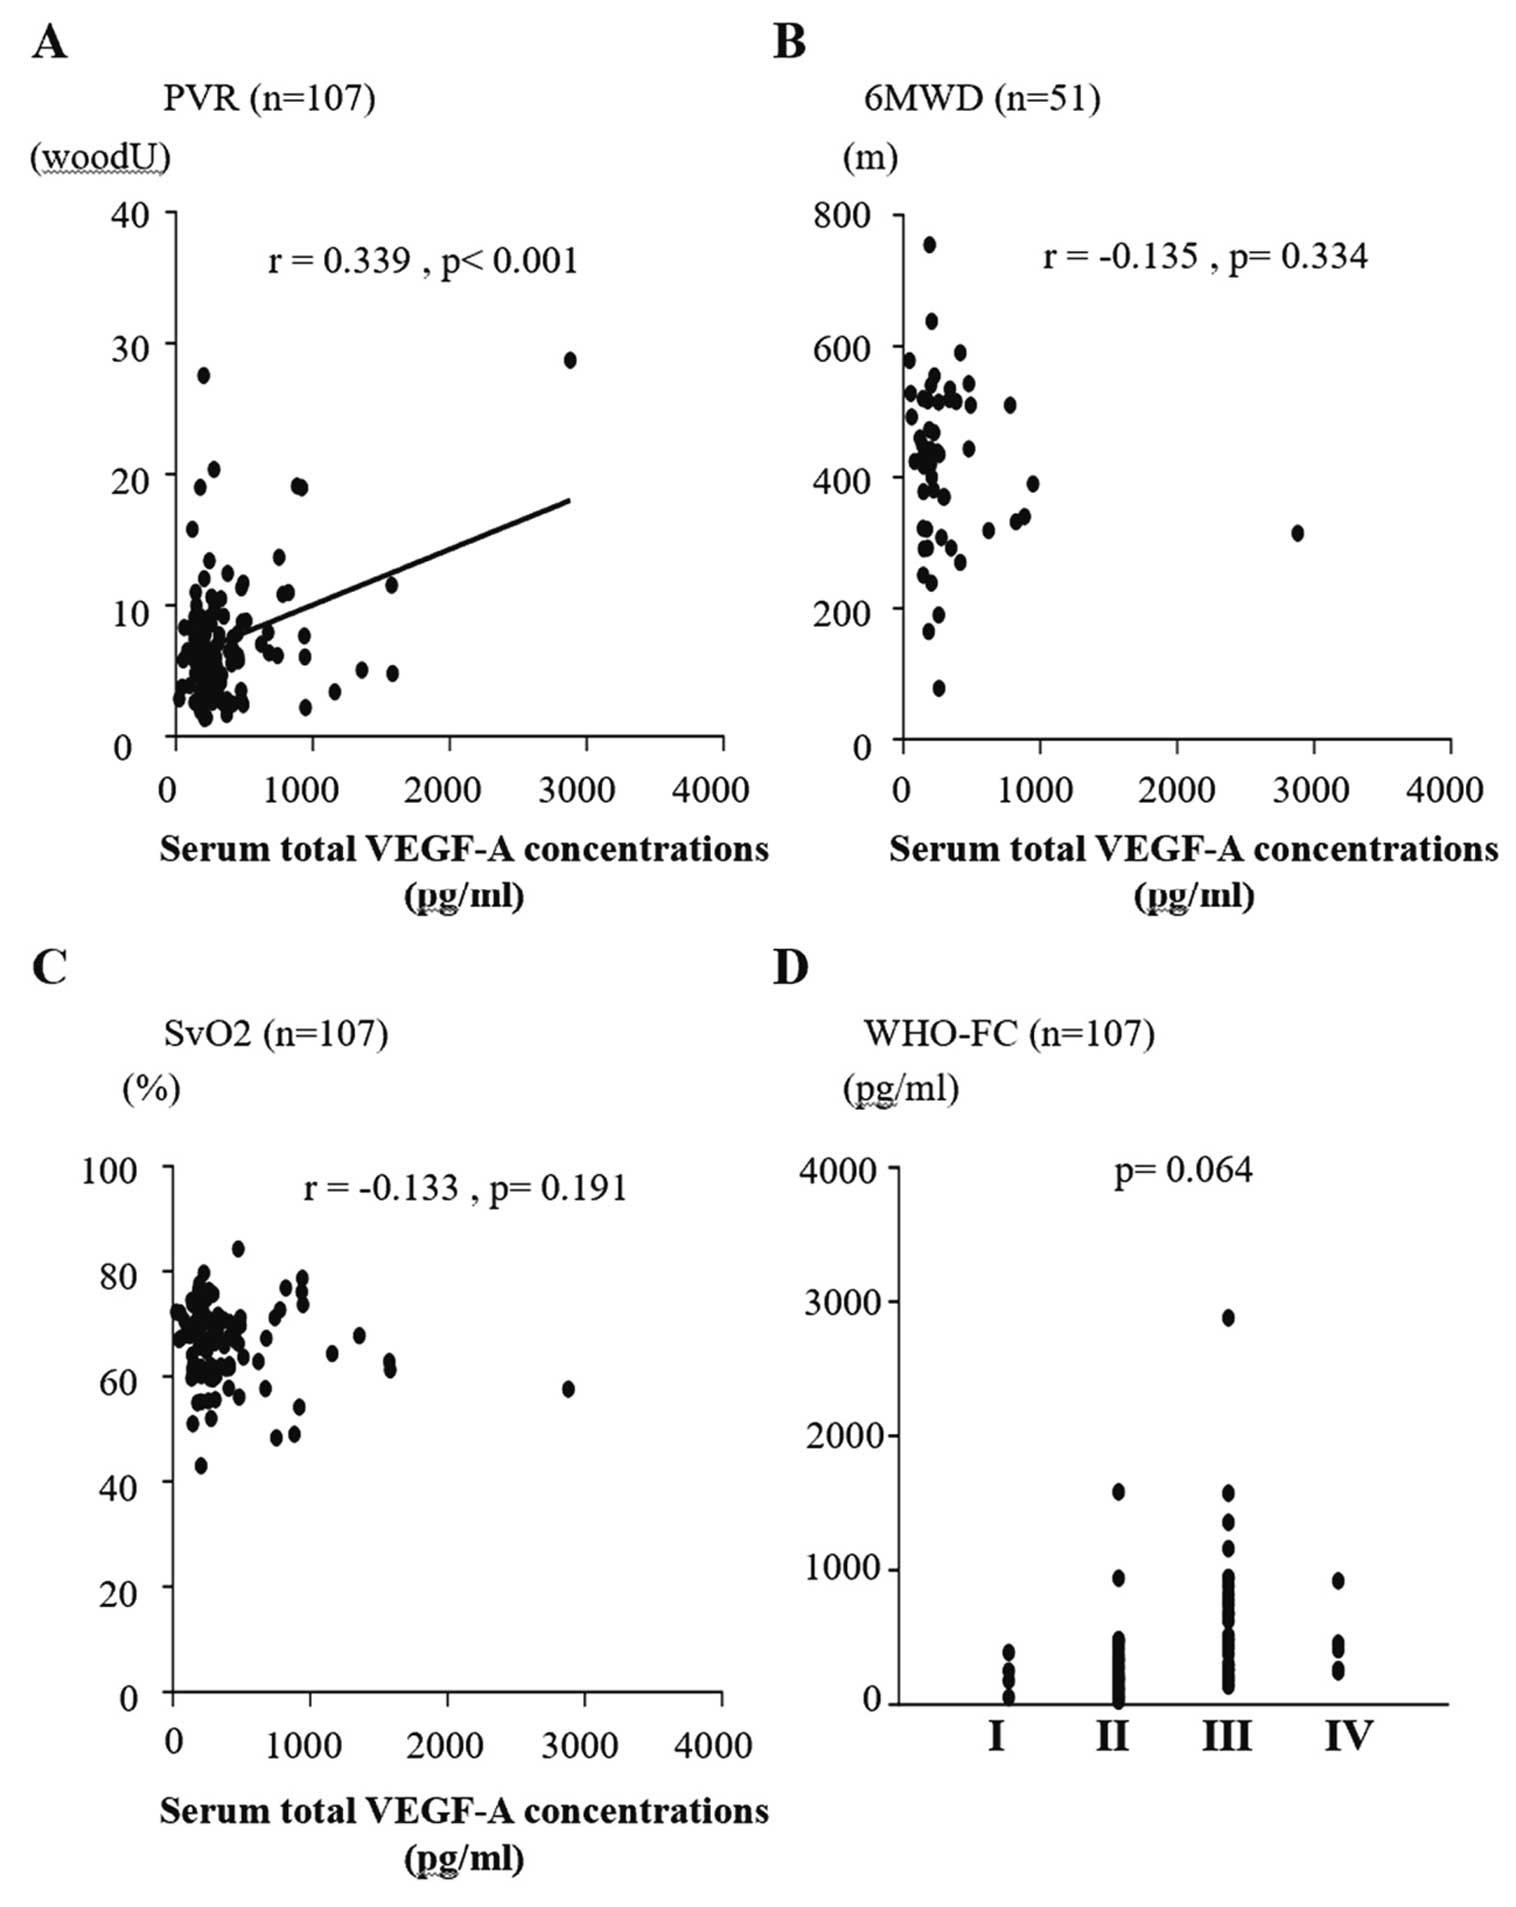
Correlation analysis was used to determine the relationship between each biomarker and hemodynamics or exercise tolerance. As shown in
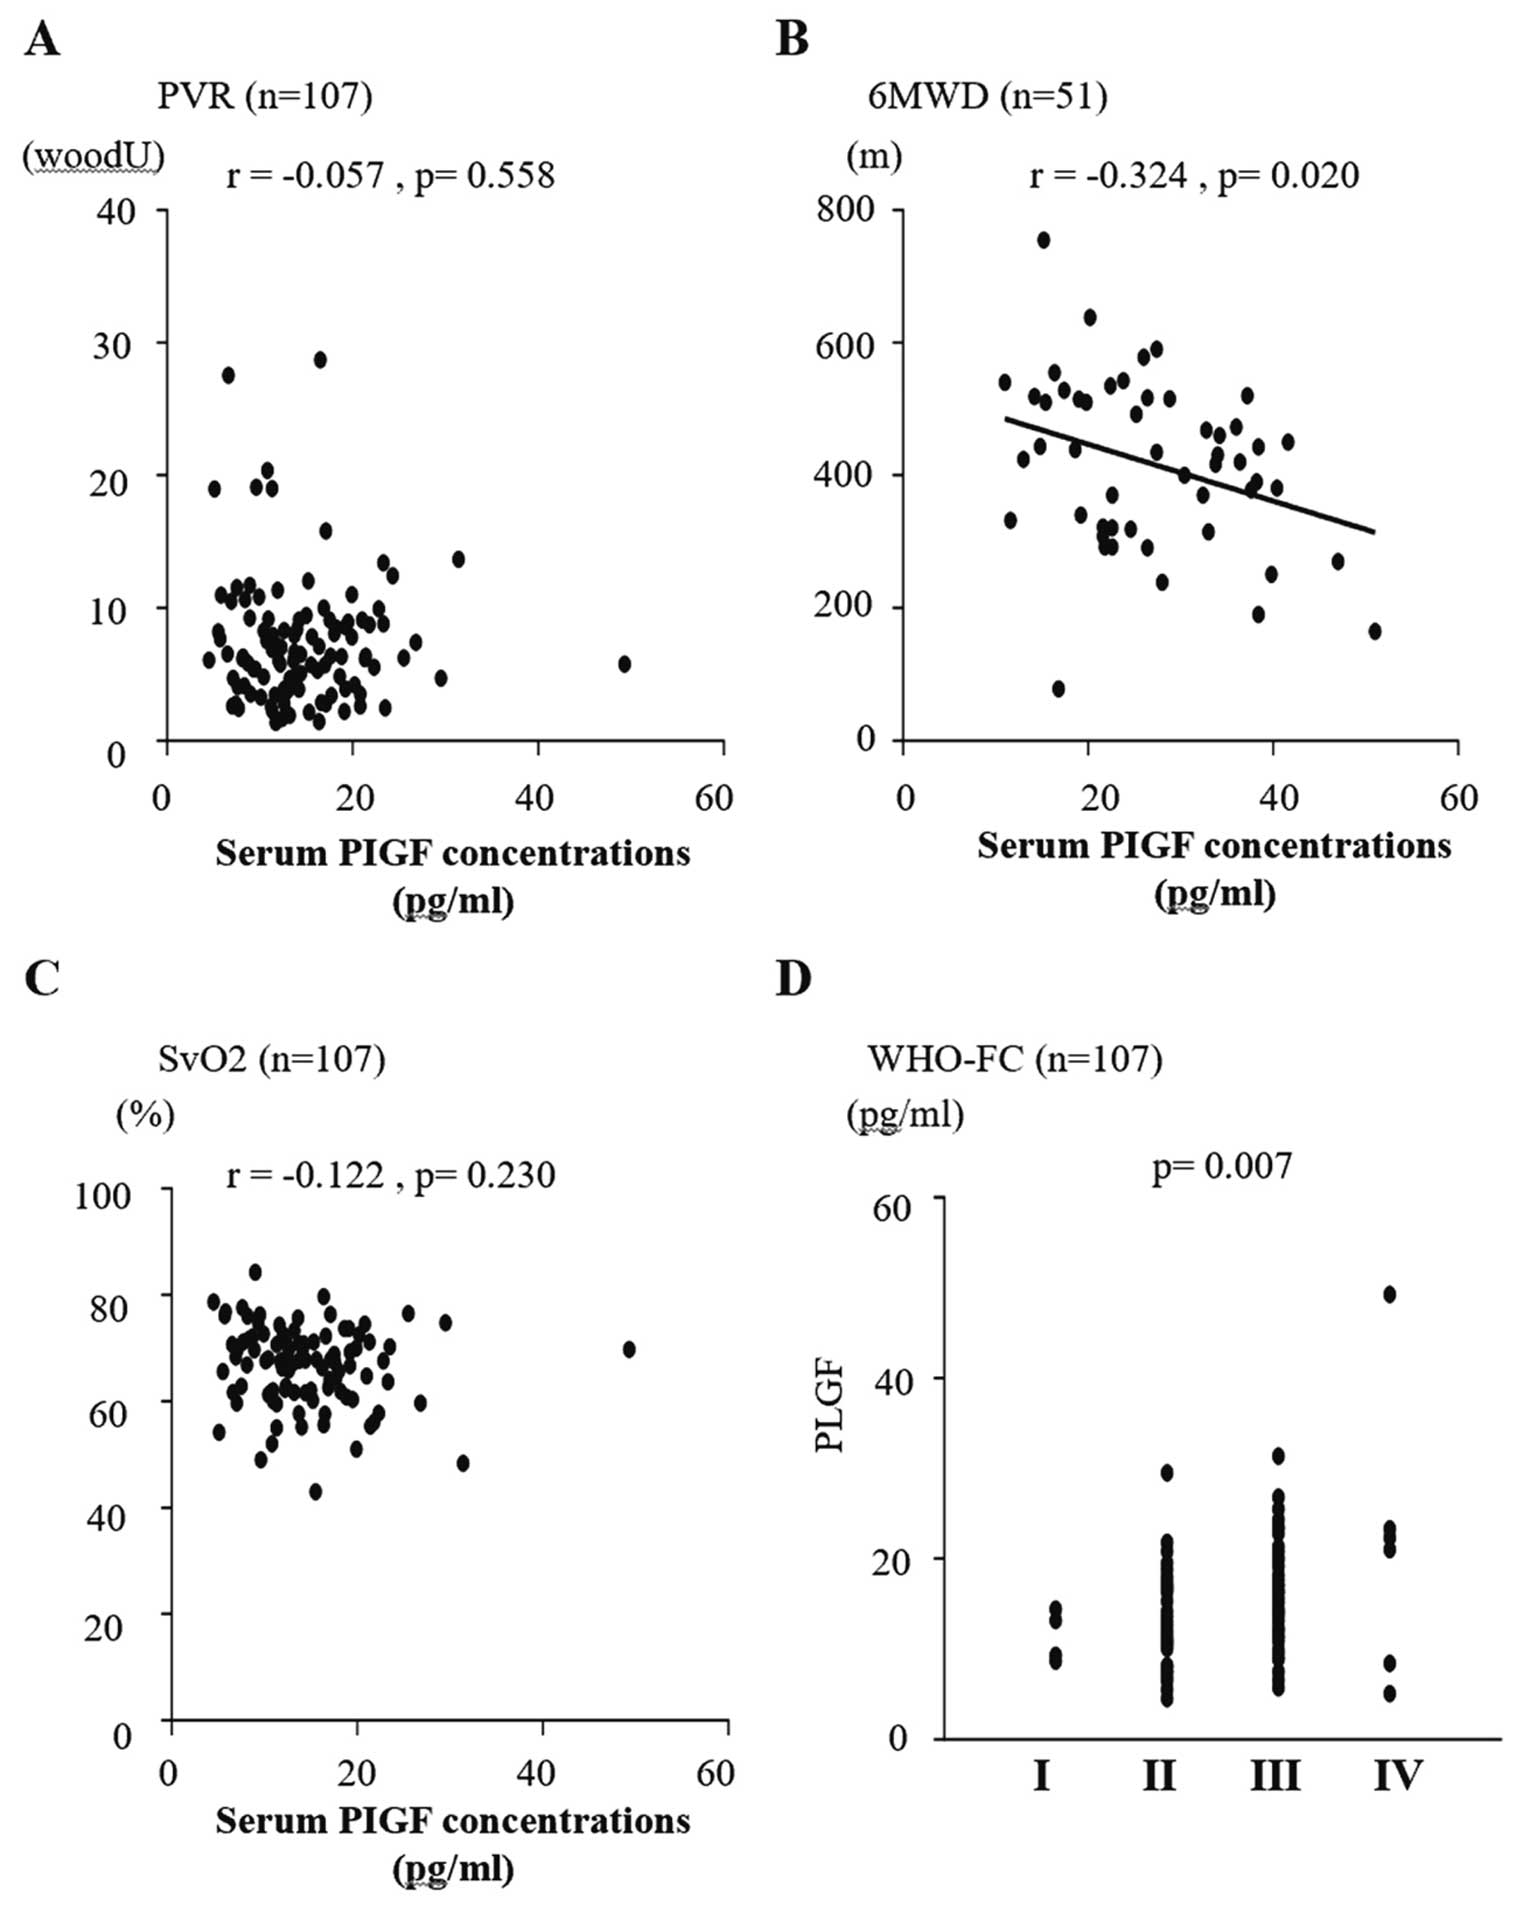
Figure 3, sVEGF-A was correlated with PVR (r=0.339; P=0.001). sVEGF-A165b was not correlated with any other hemodynamic parameters or with exercise tolerance. sPlGF was correlated with 6MWD (r=−0.324; P=0.020) and BNP levels (r=0.377; P<0.001), and there was a significant difference in WHO-FC (P=0.007;
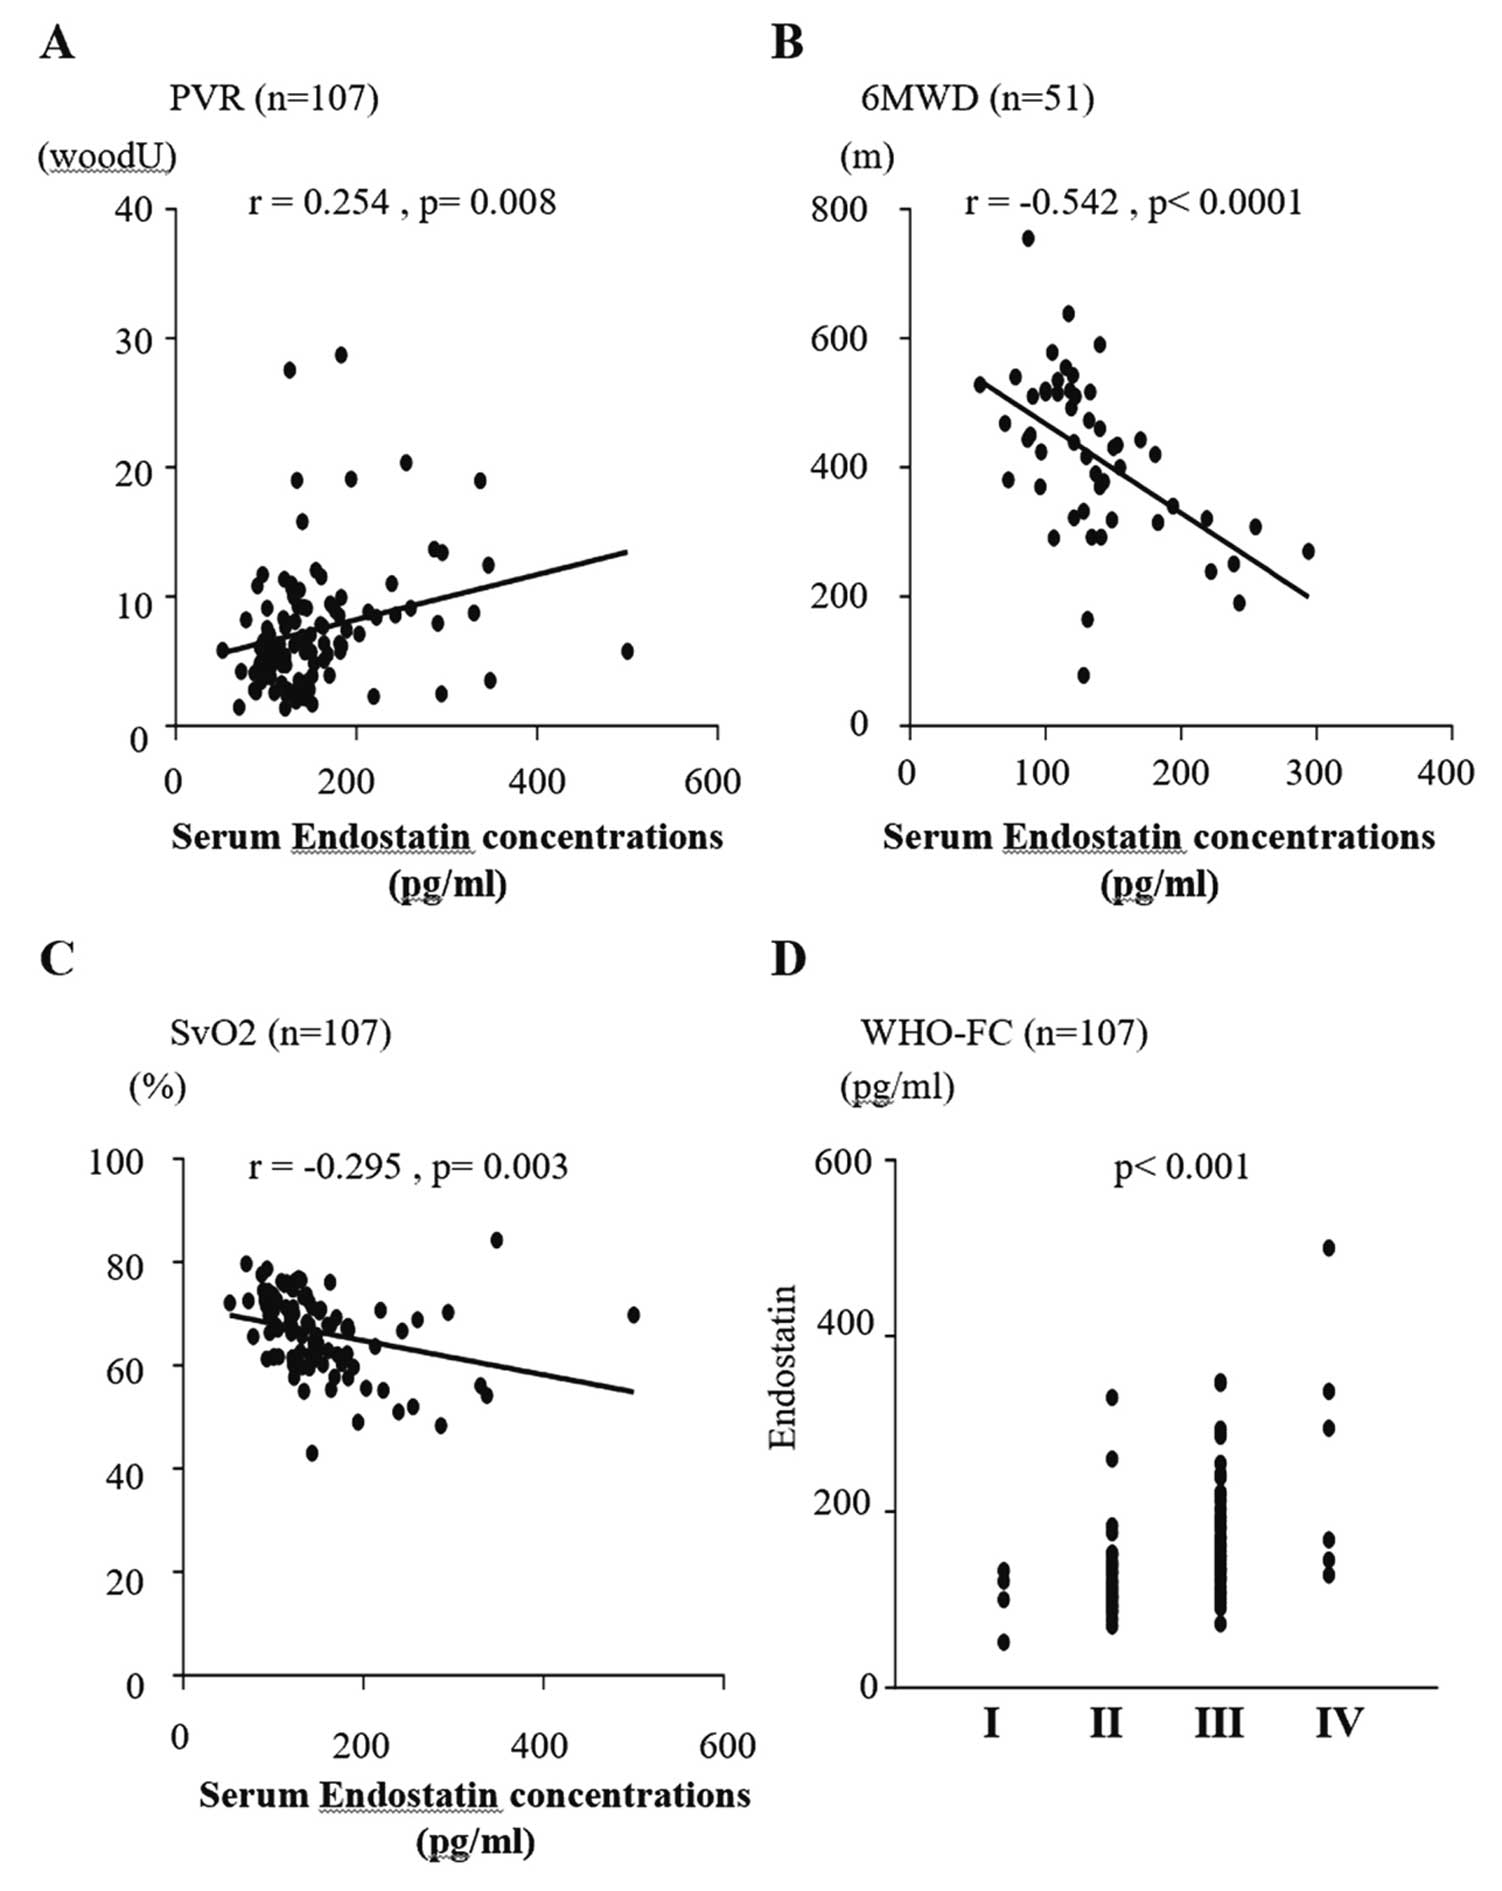
Figure 4). sES was also significantly correlated with 6MWD (r=−0.542, P<0.001) and BNP levels (r=0.531; P<0.001), and there was a significant difference in WHO-FC (P<0.001). As shown in
Figure 5, there was a weak but statistically significant correlation between sES and both PVR (r=0.254; P=0.008) and mixed venous oxygen saturation (SvO2; r=−0.295; P=0.003).
Discussion
PAH is a refractory disease that, at present, has no cure. Proper treatment needs to estimate risk stratification and find the right causes leading to the development of PH.11
However, it is often difficult to clearly distinguish the cause of PH because of overlapping etiology of PH in the clinical setting, specifically overlapping lung disease with connective tissue disease, left heart disease with IPAH, and CTD-PAH with IPAH. Biomarkers to evaluate PH may help obtain a proper diagnosis and treatment. BNP/NT-proBNP levels are useful biomarkers that reflect cardiac wall stress in PH.5
However, there are few biomarkers to classify causes of PH. In the present study we focused on serum concentrations of angiogenic and angiostatic markers, because the development of PH, as well as lung and connective tissue diseases (which can be causes of PH), is partly attributed to pathological angiogenesis of the pulmonary vessels.6,12,13
The main findings of the present study were that: (1) sES was significantly correlated with hemodynamics as well as symptoms and exercise tolerance; (2) sPlGF was significantly higher in the CTD-PAH group than in the control cohort and the IPAH subgroup of Group 1 PAH; and (3) sVEGF-A165b was significantly higher in the LD-PH (Group 3) group than in the other groups, including the control cohort.
In the present study, sES was significantly correlated not only with WHO-FC and 6MWD, but also PVR and SvO2. A previous study showed that there were significant differences in WHO-FC, NT-proBNP levels, and 6MWD, but not in resting hemodynamics (e.g., mPAP, PVR, RAP, and CI), between high and low sES.7
In the present study, 37.8% of patients were treatment naive, compared with only 15.8% in the previous study.7
Thus, the present study reflected patients’ severity more than the previous report. Recently, risk stratification at diagnosis was recommended by the European Society of Cardiology (ESC) guidelines to determine the treatment strategy for PAH.11
Specifically, a single index is inadequate to estimate the severity and prognosis of PAH. The ESC risk table contains symptoms, exercise tolerance, biomarkers (BNP or NT-proBNP levels), right heart failure (right atrial area or pericardial effusion), and hemodynamics obtained by RHC. sES was correlated with many items that are listed on the risk table. Therefore, sES is an important biomarker reflecting the severity of PH even in the current risk estimation method. Further studies to verify the usefulness of sES in treatment-naive PAH patients are needed.
PlGF, a member of the VEGF family, binds VEGF receptor 1 and is a main effector of proangiogenic signaling, which stimulates the proliferation of endothelial cell and results in PH.14,15
Abnormalities in the regulators of angiogenesis in systemic sclerosis (SSc) play a role in scleroderma vascular disease.13
It was reported that 7–12% of patients with SSc develop PAH during the course of their disease.16–18
In addition, PlGF has been recognized as a marker of the development of PH in SSc.19
In the present study, 7 of 17 Group 1 patients (41%) had SSc-PAH, and this proportion was higher than reported in a previous Japanese epidemiological study.20
These results may reflected the significant increases in sPlGF levels in CTD-PAH. In the subanalysis, the lack of correlations between sPlGF and hemodynamics such as PVR and SvO2
is in agreement with a previous report.8
In contrast, we found significant correlations between sPlGF and both 6MWD and WHO-FC. Thus, sPlGF may partially mirror severity. In cases in which CTD-PAH is complicated by lung disease, such as pulmonary fibrosis and interstitial pulmonary pneumonia, it is difficult to find the main cause of PH. Furthermore, primary Sjogren’s syndrome is known to be underdiagnosed with routine evaluation as a primary cause of PH.21
Combined evaluation of PlGF for CTD-PAH and VEGF-A165b for LD-PH may help with a proper primary diagnosis.
sVEGF-A165b was significantly higher in the LD-PAH (Group 3) group than in the other groups. In particular, the increase in sVEGF-A165b in the LD-PH but not CTEPH (Group 4) group indicates that the cause of PH is not simply hypoxia. Remodeling of lung tissue may have contributed to the increase in sVEGF-A165b. Previous studies reported increases in sVEGF-A165b in IPAH and SSc-associated PAH.10,22
The findings of the present study are consistent with these previous reports. In the present study, VEGF-A165b was measured using samples eluting from serum. Conversely, previous studies used samples from plasma. Platelet aggregation is much less in serum than in plasma, which may have affected the results. Overexpression of VRGF-A165b leads to insufficient angiogenesis in SSc,23
which may have an important role in the development of PH. However, only 7 patients (41% in the CTD-PH group) with SSc were enrolled in the present study. The small number of SSc patients may have affected the results. In normal lung, VEGF-A maintains alveolar structure and function. Alveolar epithelial cell injury in fibrotic interstitial lung disease induces abundant VEGF-A expression in alveolar epithelial cells, macrophages, and the vascular bed, subsequently upregulating VEGF-A165b to protect against fibrogenesis.24
Because fibrotic changes were detected in 75% of LD-PH patients, sVEGF-A165b levels may be predominantly increased in the chronic phase of the disease.
There are limitations to the present study. First, the study population was not very large, and reliable standard deviations for tricuspid annular plane systolic excursion and peak V̇O2
in Group 2 and for peak V̇O2
in adult congenital heart disease were not obtained. Second, ES was not measured in samples from the control cohort because of the limited quantity of blood samples.
In conclusion, sVEGF-A165b has the potential to detect LD-PH among the etiologies of PH, and sES may detect CTD-PAH in PAH. In addition, sES may be a marker to estimate the severity of PH. Because sES was correlated with the main items of the ESC risk table, sES is thought to reflect the severity of PH in recent treatment strategies. Further studies are needed in a treatment-naive cohort to verify the usefulness of sES.
Acknowledgment
The authors would like to thank ELSS, Inc. (https://www.elss.co.jp/en) for English language editing, and express our sincere appreciation to all the patients, collaborating physicians, and other medical staff.
Sources of Funding
This study was supported a Grant-in-Aid for Scientific Research (C) (17K09551) from the Japan Society for the Promotion of Science. This work was also supported by the Actelion Academia Prize 2016 to R.K. The funding organization played no role in study design, in the collection, analysis, and interpretation of the data, in the writing of the report, or in the decision to submit the report for publication.
Disclosures
Y.N. and T.K. belong to a department endowed by Janssen Pharmaceutical Companies of Johnson & Johnson. T.M. is a Senior Advisory Editor for
Circulation Reports. The remaining authors have no conflicts of interest to disclose.
IRB Information
This study was approved by the Ethics Review Board of Nagoya University Graduate School of Medicine (Approval no. 2017-0099 and 2015-0142).
References
- 1.
Chan SY, Loscalzo J. Pathogenic mechanisms of pulmonary arterial hypertension. J Mol Cell Cardiol 2008; 44: 14–30.
- 2.
Simonneau G, Gatzoulis MA, Adatia I, Celermajer D, Denton C, Ghofrani A, et al. Updated clinical classification of pulmonary hypertension. J Am Coll Cardiol 2013; 62(25 Suppl): d34–d41.
- 3.
Hoeper MM, Bogaard HJ, Condliffe R, Frantz R, Khanna D, Kurzyna M, et al. Definitions and diagnosis of pulmonary hypertension. J Am Coll Cardiol 2013; 62(25 Suppl): d42–d50.
- 4.
Warwick G, Thomas PS, Yates DH. Biomarkers in pulmonary hypertension. Eur Respir J 2008; 32: 503–512.
- 5.
Uchiyama N, Yuasa T, Miyata M, Horizoe Y, Chaen H, Kubota K, et al. Correlation of right ventricular wall stress with plasma B-type natriuretic peptide levels in patients with pulmonary hypertension. Circ J 2019; 83: 1278–1285.
- 6.
Al-Husseini A, Kraskauskas D, Mezzaroma E, Nordio A, Farkas D, Drake JI, et al. Vascular endothelial growth factor receptor 3 signaling contributes to angioobliterative pulmonary hypertension. Pulm Circ 2015; 5: 101–116.
- 7.
Damico R, Kolb TM, Valera L, Wang L, Housten T, Tedford RJ, et al. Serum endostatin is a genetically determined predictor of survival in pulmonary arterial hypertension. Am J Respir Crit Care Med 2015; 191: 208–218.
- 8.
Tiede SL, Gall H, Dorr O, dos Santos Guilherme M, Troidl C, Liebetrau C, et al. New potential diagnostic biomarkers for pulmonary hypertension. Eur Respir J 2015; 46: 1390–1396.
- 9.
Taraseviciene-Stewart L, Kasahara Y, Alger L, Hirth P, McMahon G, Waltenberger J. Inhibition of the VEGF receptor 2 combined with chronic hypoxia causes cell death-dependent pulmonary endothelial cell proliferation and severe pulmonary hypertension. FASEB J 2001; 15: 427–438.
- 10.
Suzuki S, Yoshihisa A, Yokokawa T, Misaka T, Sakamoto N, Sugimoto K, et al. Association between levels of anti-angiogenic isoform of vascular endothelial growth factor A and pulmonary hypertension. Int J Cardiol 2016; 222: 416–420.
- 11.
Galie N, Humbert M, Vachiery JL, Gibbs S, Lang I, Torbicki A, et al. 2015 ESC/ERS guidelines for the diagnosis and treatment of pulmonary hypertension: The Joint Task Force for the Diagnosis and Treatment of Pulmonary Hypertension of the European Society of Cardiology (ESC) and the European Respiratory Society (ERS): Endorsed by: Association for European Paediatric and Congenital Cardiology (AEPC), International Society for Heart and Lung Transplantation (ISHLT). Eur Heart J 2016; 37: 67–119.
- 12.
Sands M, Howell K, Costello CM, McLoughlin P. Placenta growth factor and vascular endothelial growth factor B expression in the hypoxic lung. Respir Res 2011; 12: 17.
- 13.
Hummers LK, Hall A, Wigley FM, Simons M. Abnormalities in the regulators of angiogenesis in patients with scleroderma. J Rheumatol 2009; 36: 576–582.
- 14.
Park JE, Chen HH, Winer J, Houck KA, Ferrara N. Placenta growth factor potentiation of vascular endothelial growth factor bioactivity, in vitro and in vivo, and high affinity binding to Flt-1 but not to Flk-l/KDR. J Biol Chem 1994; 269: 25646–25654.
- 15.
Lefevre G, Dauchet L, Hachulla E, Montani D, Sobanski V, Lambert M, et al. Survival and prognostic factors in systemic sclerosis-associated pulmonary hypertension: A systematic review and meta-analysis. Arthritis Rheum 2013; 65: 2412–2423.
- 16.
Tyndall AJ, Bannert B, Vonk M, Airo P, Cozzi F, Carreira PE, et al. Causes and risk factors for death in systemic sclerosis: A study from the EULAR Scleroderma Trials and Research (EUSTAR) database. Ann Rheum Dis 2010; 69: 1809–1815.
- 17.
Hachulla E, Gressin V, Guillevin L, Carpentier P, Diot E, Sibilia J, et al. Early detection of pulmonary arterial hypertension in systemic sclerosis: A French nationwide prospective multicenter study. Arthritis Rheum 2005; 52: 3792–3800.
- 18.
Mukerjee D, St George D, Coleiro B, Knight C, Denton CP, Davar J, et al. Prevalence and outcome in systemic sclerosis associatedpulmonary arterial hypertension: Application of a registry approach. Ann Rheum Dis 2003; 62: 1088–1093.
- 19.
McMahan Z, Schoenhoff F, Van Eyk JE, Wigley FM, Hummers LK. Biomarkers of pulmonary hypertension in patients with scleroderma: A case-control study. Arthritis Res Ther 2015; 17: 201.
- 20.
Shirai Y, Yasuoka H, Okano Y, Takeuchi T, Satoh T, Kuwana M. Clinical characteristics and survival of Japanese patients with connective tissue disease and pulmonary arterial hypertension: A single-centre cohort. Rheumatology (Oxford) 2012; 51: 1846–1854.
- 21.
Sato T, Hatano M, Iwasaki Y, Maki H, Saito A, Minatsuki S, et al. Prevalence of primary Sjogren’s syndrome in patients undergoing evaluation for pulmonary arterial hypertension. PLoS One 2018; 13: e0197297.
- 22.
Hirigoyen D, Burgos PI, Mezzano V, Duran J, Barrientos M, Saez CG, et al. Inhibition of angiogenesis by platelets in systemic sclerosis patients. Arthritis Res Ther 2015; 17: 332.
- 23.
Manetti M, Guiducci S, Romano E, Ceccarelli C, Bellando-Randone S, Conforti ML, et al. Overexpression of VEGF165b, an inhibitory splice variant of vascular endothelial growth factor, leads to insufficient angiogenesis in patients with systemic sclerosis. Circ Res 2011; 109: e14–e26.
- 24.
Barratt SL, Blythe T, Jarrett C, Ourradi K, Shelley-Fraser G, Day MJ, et al. Differential expression of VEGF-Axxx isoforms is critical for development of pulmonary fibrosis. Am J Respir Crit Care Med 2017; 196: 479–493.