Abstract
Background:
Tight junction (TJ) disruption and dysfunction are involved in the progression of arteriosclerosis. miR-501-3p regulates endothelial TJ protein-1, resulting in TJ disruption. Because exosomal microRNAs can travel to distant tissues and influence cell behavior, patients with elevated miR-501-3p may experience accelerated vascular disease progression secondary to miR-501-3p-induced reductions in TJ. This study investigated whether plasma exosome miR-501-3p levels are associated with vascular stiffness, an indicator for arteriosclerotic changes.
Methods and Results:
Fifty-one subjects (mean [±SD] age 70±8 years, 37% male) enrolled in a medical checkup program were recruited to the study. Brachial-ankle arterial pulse wave velocity (baPWV) and plasma exosome miR-501-3p expression were measured. Patients were divided into 2 groups depending on whether their miR-501-3p ∆Ct
values were above (“High”; n=24) or below (“Low”; n=27) the cut-off levels determined by receiver operating characteristic (ROC) curve analysis. Median (interquartile range) baPWV levels were significantly higher in the miR-501-3p High than Low group (1,664 [1,496–1,859] vs. 1,450 [1,353–1,686] cm/s, respectively; P<0.05). Multivariate logistic regression analysis showed a significant association between increased baPWV and High miR-501-3p expression (odds ratio 4.66). At follow-up visits (mean 62 months later), baPWV remained significantly higher in the miR-501-3p High than Low group (1,830 [1,624–2,056] vs. 1,620 [1,377–1,816] cm/s, respectively; P<0.05).
Conclusions:
High expression levels of exosome miR-501-3p contribute to arteriosclerotic changes.
In recent publications, arterial endothelial cell junctions have been reported to be involved in the progression of arteriosclerosis. It is well known that cell-cell interactions influence the regulation of endothelial cellular stiffness,1
and recent in vitro studies have clarified that inhibition of connexin43 leads to inhibition of tight junction protein-1 (also known as zonula occludens-1 [ZO-1]), increasing cellular stiffness.2
Further, a high-fat diet, known to cause stiffening of the vascular wall,3
increases vascular permeability by disrupting ZO-1 in vivo.4
These data suggest that loss of tight junction function can augment arteriosclerosis changes.
MicroRNAs (miRNAs) are small, single-stranded RNAs with a length of approximately 22 nucleotides; miRNAs typically repress mRNA expression by binding to the 3′-untranslated region and thus affect many major (patho)physiological processes. Exosomes are extracellular vesicles secreted from most cell types that contain both mRNAs and miRNAs and can travel to distant tissues to directly influence various aspects of cell behavior, often more rapidly than traditionally recognized methods of local gene expression control.5
For example, exosome-mediated transfer of miRNAs has been shown to regulate various physiological processes in the context of neurological and cardiovascular diseases.6,7
Although an increasing number of studies has highlighted the impact of miRNAs on the development of arterial stiffness, no treatment or biomarker has yet been established in clinical practice.8
Thus, the search for clinically optimal miRNA-based treatments and biomarkers for vascular diseases is ongoing. We recently provided the first evidence that miR-501-3p regulates ZO-1 in endothelial cells, leading to disruption of tight junctions.9
As mentioned above, recent studies suggest that loss of tight junction function can augment arteriosclerotic changes. Accordingly, we believe that miR-501-3p may be a strong candidate for the development of new strategies for the treatment of vascular disease. Hypothetically, exosome-derived miR-501-3p-induced loss of tight junction function could lead to accelerated arteriosclerotic progression. However, to date there is no information available regarding the effects of exosome-derived miR-501-3p on these processes. In the present study, we investigated whether plasma exosome miR-501-3p was correlated with increased arterial wall stiffness in subjects who attended a medical checkup program.
Methods
Study Population
Subjects who attended the medical checkup program Anti-Aging Doc were recruited for the study.10
As described previously,10
the Anti-Aging Doc program is specifically designed to evaluate aging-related disorders, including atherosclerosis, cardiovascular disease, physical function, and mild cognitive impairment. The program is provided to all residents of Ehime Prefecture, Japan, and participants attend voluntary medical checkups.
The present study was approved by the Institutional Review Board of Ehime University Graduate School of Medicine (Reference no. 17-3R2-K8) and complied with the ethical principles of the Declaration of Helsinki.
Subjects who had sufficient stocked blood samples for the extraction of microRNAs (500 µL plasma) and who had undergone testing of arterial brachial-ankle pulse wave velocity (baPWV), were consecutively recruited to the study from those attending the Anti-Aging Center at Ehime University Hospital (May 2006–August 2016). Subjects in general attend the Anti-Aging Doc program once a year.
Measurement of baPWV
As described in detail previously, baPWV was measured after a 10 min rest using an automatic waveform analyzer (Omron Healthcare, Kyoto, Japan) while subjects were in a supine position.10,11
baPWV was calculated from the time interval between the wave fronts of the brachial and ankle waveforms (∆Tba) and the path length from the brachium to ankle. The path length from the suprasternal notch to the brachium (Lb) or ankle (La) was obtained using the following formulas:
Lb = 0.2195 × height × 2.0734
La = 0.8129 × height + 12.328
baPWV was then calculated as (La−Lb)/∆Tba on both the right and left side, with the mean of the 2 sides used in the present analysis.
Blood Biochemistry
Venous blood samples were collected the morning before the measurement of baPWV, following an overnight fast.10
Blood was stored according to the normal workflow protocols at Ehime University Hospital.
Extraction of miRNA From Plasma Exosomes
ExoRNeasy Serum Plasma Kits (Catalog no. 77044; Qiagen, Valencia, CA, USA) were used to extract plasma exosome RNAs according to the manufacturer’s instructions. Because there is currently no clear consensus on what should be used as a normalization control for miRNA expression profiling in human plasma and serum samples, “
Caenorhabditis elegans
miR-39 (cel-miR-39)” miRNA mimic (Spike-In Control; Catalog no. 219610; Qiagen) was added as an external control during the extraction process.
Quantitative Real-Time Polymerase Chain Reaction
The TaqMan microRNA Reverse Transcription Kit (Catalog no. 4366596; Applied Biosystems, Foster City, CA, USA) was used for miRNA reverse transcription according to the manufacturer’s instructions, as described previously.9
TaqMan Assay Kits (Applied Biosystems) for hsa-miR-501-3p (Catalog no. 002435; Applied Biosystems) and cel-miR-39 (external control for normalization; Catalog no. 000200; Applied Biosystems) were used. ∆Ct
values (i.e., the Ct
value of miR-501-3p minus the Ct
value of cel-miR-39) were calculated for the analysis.
Statistical Analysis
The Shapiro-Wilk test was used to determine whether samples were normally distributed. Depending on the distribution of the data, paired Student’s t-test or the Wilcoxon test was used to analyze the significance of differences between groups. Pearson or Spearman correlation tests were used to analyze correlations between baPWV and other parameters. To determine the independent association between plasma exosome miR-501-3p levels and baPWV, we adjusted for other covariates on baPWV with multivariate linear regression analysis with forced inclusion of the variables of age and systolic and diastolic blood pressure (SBP and DBP, respectively). Univariate and multivariate logistic regression analyses were used to assess plasma exosome miR-501-3p expression levels (cut-off value of ∆Ct=14.19, determined by receiver operating characteristic [ROC] curves), baseline parameters, risk factors, and medications that were correlated with an elevation in baPWV. Note that a cut-off value of baPWV=1,500 cm/s has been used as a sensitive method for detecting silent arteriosclerotic changes in our unit.10
Data are expressed as the mean±SD or as median values with the interquartile range (IQR). Two-sided P<0.05 was considered significant. All analyses were performed using IBM SPSS Statistics Version 21.0 (IBM Corp., Armonk, NY, USA).
Results
Baseline Characteristics and Clinical Parameters
The baseline characteristics of the study subjects are given in
Table 1. Fifty-one subjects (age 70±8 years, 41% male) were included in the analysis. Several subjects had a history of hypertension (33%), diabetes (8%), and dyslipidemia (25%), and some were being treated with medications (Table 1). In general, the group was within normal limits for SBP and DBP, lipid profile, and HbA1c levels for this population (Table 2).
Table 1.
Patient Characteristics for All Subjects (n=51)
| Age (years) |
70.4±8.2 |
| Male sex |
21 (41) |
| Risk factors |
| Hypertension |
17 (33) |
| Diabetes |
4 (8) |
| Dyslipidemia |
13 (25) |
| Medical therapies |
| Antiplatelet agents |
4 (8) |
| ARB |
6 (12) |
| ACEI |
1 (2) |
| Diuretics |
2 (4) |
| CCBs |
10 (20) |
| β-blockers |
1 (2) |
| Statins |
11 (22) |
| Oral hypoglycemic agents |
4 (8) |
Data are given as the mean±SD or n (%). ACEI, angiotensin-converting enzyme inhibitor; ARB, angiotensin II receptor blocker; CCBs, calcium channel blockers.
Table 2.
Clinical Parameters for All Subjects (n=51)
| Body weight (kg) |
55.9±11.1 |
| BMI (kg/m2) |
22.6±3.1 |
| SBP (mmHg) |
124±16 |
| DBP (mmHg) |
71±10 |
| Heart rate (beats/min) |
68 [62–75] |
| PWV (cm/s) |
1,605±266 |
| Plasma exosome miR-501-3pA (ΔCt) |
14.1±1.6 |
| eGFR (mL/min/1.73 m2) |
71.2 [62.8–75.3] |
| Uric acid (mg/dL) |
5.3±1.6 |
| Total cholesterol (mg/dL) |
214±30 |
| HDL-C (mg/dL) |
67±17 |
| LDL-C (mg/dL) |
123±25 |
| Triglycerides (mg/dL) |
97±36 |
| HbA1c (%) |
5.8 [5.6–6.1] |
Data are given as the mean±SD or median [interquartile range]. ACalculated as miR-501-3p ΔCt minus cel-miR-39 ΔCt. BMI, body mass index; DBP, diastolic blood pressure; eGFR, estimated glomerular filtration rate; HDL-C, high-density lipoprotein cholesterol; LDL-C, low-density lipoprotein cholesterol; PWV, pulse wave velocity; SBP, systolic blood pressure.
Figure 1A
shows the ROC curve obtained by plotting varying cut-offs between plasma exosome miR-501-3p values and the presence of arteriosclerotic stiffness changes as estimated by baPWV values. Statistical testing calculated the area under the curve as 0.61. The cut-off ∆Ct
value that maximized sensitivity and specificity was 14.19, leading to sensitivity of 0.60 and specificity of 0.71 (1−specificity=0.29). Depending on whether miR-501-3p ∆Ct
was above or below the cut-off level, subjects were divided into 2 groups: “miR-501-3p Low” (n=27) and “miR-501-3p High” (n=24).

Figure 1B
shows significant differences in miR-501-3p expression between the 2 groups. As indicated in
Table 3, the number of males and the number of subjects with a diagnosis of hypertension were significantly higher in the miR-501-3p High group (P<0.05). DBP was also significantly higher in the miR-501-3p High group (P<0.05), although SBP was not. Further, the miR-501-3p High group contained significantly more subjects treated with calcium channel blockers (P<0.01). There were no significant differences in body weight, body mass index, creatinine, uric acid, cholesterol levels, or HbA1c between the 2 groups. Intriguingly, baPWV levels were significantly higher in the miR-501-3p High than Low group (Figure 1C). Further, the number of subjects with increased baPWV (>1,500 cm/s) was significantly higher in the miR-501-3p High than Low group (Figure 1D).
Table 3.
Comparisons of Various Parameters Between the Low and High miR-501-3p Groups
| |
miR-501-3p |
| Low (n=27) |
High (n=24) |
| Age (years) |
71±7 |
70±10 |
| Male sex |
6 (22) |
15 (63)** |
| SBP (mmHg) |
122±18 |
127±12 |
| DBP (mmHg) |
68±10 |
74±9* |
| Heart rate (beats/min) |
68 [61–74] |
69 [65–77] |
| Body weight (kg) |
54.0±10.5 |
57.9±11.5 |
| BMI (kg/m2) |
22.7±3.4 |
22.4±2.9 |
| eGFR (mL/min/1.73 m2) |
71.7 [63.6–76.7] |
67.7 [61.7–75.0] |
| Uric acid (mg/dL) |
5.1±1.7 |
5.5±1.5 |
| Total cholesterol (mg/dL) |
214±27 |
214±35 |
| HDL-C (mg/dL) |
70±17 |
64±17 |
| LDL-C (mg/dL) |
122±21 |
125±30 |
| Triglycerides (mg/dL) |
92±36 |
103±37 |
| HbA1c (%) |
5.8 [5.6–6.0] |
5.8 [5.6–6.1] |
| Risk factors |
| Hypertension |
5 (19) |
12 (50)* |
| Diabetes |
3 (11) |
1 (4) |
| Dyslipidemia |
7 (26) |
6 (25) |
| Medical therapies |
| Antiplatelet agents |
2 (7) |
2 (8) |
| ARB |
3 (11) |
3 (13) |
| ACEI |
0 (0) |
1 (4) |
| Diuretics |
1 (4) |
1 (4) |
| CCBs |
1 (4) |
9 (38)** |
| β-blockers |
0 (0) |
1 (4) |
| Statins |
5 (19) |
6 (25) |
| Oral hypoglycemic agents |
3 (11) |
1 (4) |
Data are given as n (%), the mean±SD or median [interquartile range]. *P<0.05, **P<0.01 compared with the Low miR-501-3p group. Abbreviations as in Tables 1,2.
Univariate logistic regression showed that the presence of SBP >130 mmHg and miR-501-3p High were significantly associated with augmented baPWV (Table 4). Because only 1 subject was being treated with either angiotensin-converting enzyme inhibitors or β-blockers, these factors were not analyzed with univariate logistic regression. As reported previously, multivariate logistic regression analysis adjusted for age continued to show a significant positive association between baPWV and the presence of SBP>130 mmHg (odds ratio [OR] 5.19;
Table 4, Model 1). However, adjustment for the presence of SBP >130 mmHg and age continued to show a significant positive association between baPWV and plasma exosome miR-501-3p (OR 4.66;
Table 4, Model 2). An ROC curve based on predicted probability of logistic regression for this model (miR-501-3p included, Model 2) more accurately predicts increased vascular stiffness than Model 1 (Figure 2A). This indicates that high plasma levels of miR-501-3p contribute to arterial stiffness, along with established factors such as age and blood pressure.
Table 4.
Logistic Regression Analysis of the Elevation of PWV for All Subjects (n=51)
| Variable |
Univariate |
Multivariate |
Model-1 (Hosmer-Lemeshow
test; P=0.40) |
Model-2 (Hosmer-Lemeshow
test; P=0.52) |
| OR (95% CI) |
P value |
OR (95% CI) |
P value |
OR (95% CI) |
P value |
| Age |
1.06 (0.99–1.15) |
0.10 |
1.08 (1.00–1.17) |
0.06 |
1.09 (1.00–1.19) |
<0.05 |
| Male sex |
1.75 (0.55–5.56) |
0.34 |
|
|
|
|
| SBP ≥130 mmHg |
4.25 (1.15–15.7) |
<0.05 |
5.19 (1.28–21.0) |
<0.05 |
5.63 (1.27–24.9) |
<0.05 |
| DBP ≥80 mmHg |
7.27 (0.83–63.4) |
0.07 |
– |
– |
– |
– |
| Body weight |
0.99 (0.94–1.04) |
0.68 |
– |
– |
– |
– |
| BMI |
0.92 (0.77–1.10) |
0.36 |
– |
– |
– |
– |
| eGFR |
0.98 (0.93–1.02) |
0.33 |
– |
– |
– |
– |
| Uric acid |
1.11 (0.78–1.58) |
0.57 |
– |
– |
– |
– |
| Total cholesterol |
1.01 (0.99–1.03) |
0.46 |
– |
– |
– |
– |
| HDL-C |
1.01 (0.98–1.05) |
0.52 |
– |
– |
– |
– |
| LDL-C |
1.01 (0.98–1.03) |
0.59 |
– |
– |
– |
– |
| Triglycerides |
1.00 (0.98–1.01) |
0.86 |
– |
– |
– |
– |
| HbA1c |
3.09 (0.68–14.0) |
0.15 |
– |
– |
– |
– |
| High plasma exosome miR-501-3p group |
3.75 (1.13–12.4) |
<0.05 |
– |
– |
4.66 (1.18–18.3) |
<0.05 |
| Risk factors |
| Hypertension |
3.25 (0.88–12.0) |
0.08 |
– |
– |
– |
– |
| Diabetes |
2.22 (0.22–23.0) |
0.50 |
– |
– |
– |
– |
| Dyslipidemia |
1.16 (0.32–4.23) |
0.82 |
– |
– |
– |
– |
| Medical therapies |
| Antiplatelet agents |
0.68 (0.09–5.24) |
0.71 |
– |
– |
– |
– |
| ARB |
0.67 (0.12–3.68) |
0.64 |
– |
– |
– |
– |
| ACEI |
– |
– |
– |
– |
– |
– |
| Diuretic |
0.69 (0.04–11.7) |
0.80 |
– |
– |
– |
– |
| CCBs |
3.46 (0.65–18.3) |
0.15 |
– |
– |
– |
– |
| β-blockers |
– |
– |
– |
– |
– |
– |
| Statins |
1.29 (0.33–5.14) |
0.72 |
– |
– |
– |
– |
| Oral hypoglycemic agents |
2.22 (0.22–23.0) |
0.50 |
– |
– |
– |
– |
CI, confidence interval; OR, odds ratio. Other abbreviations as in Tables 1,2.
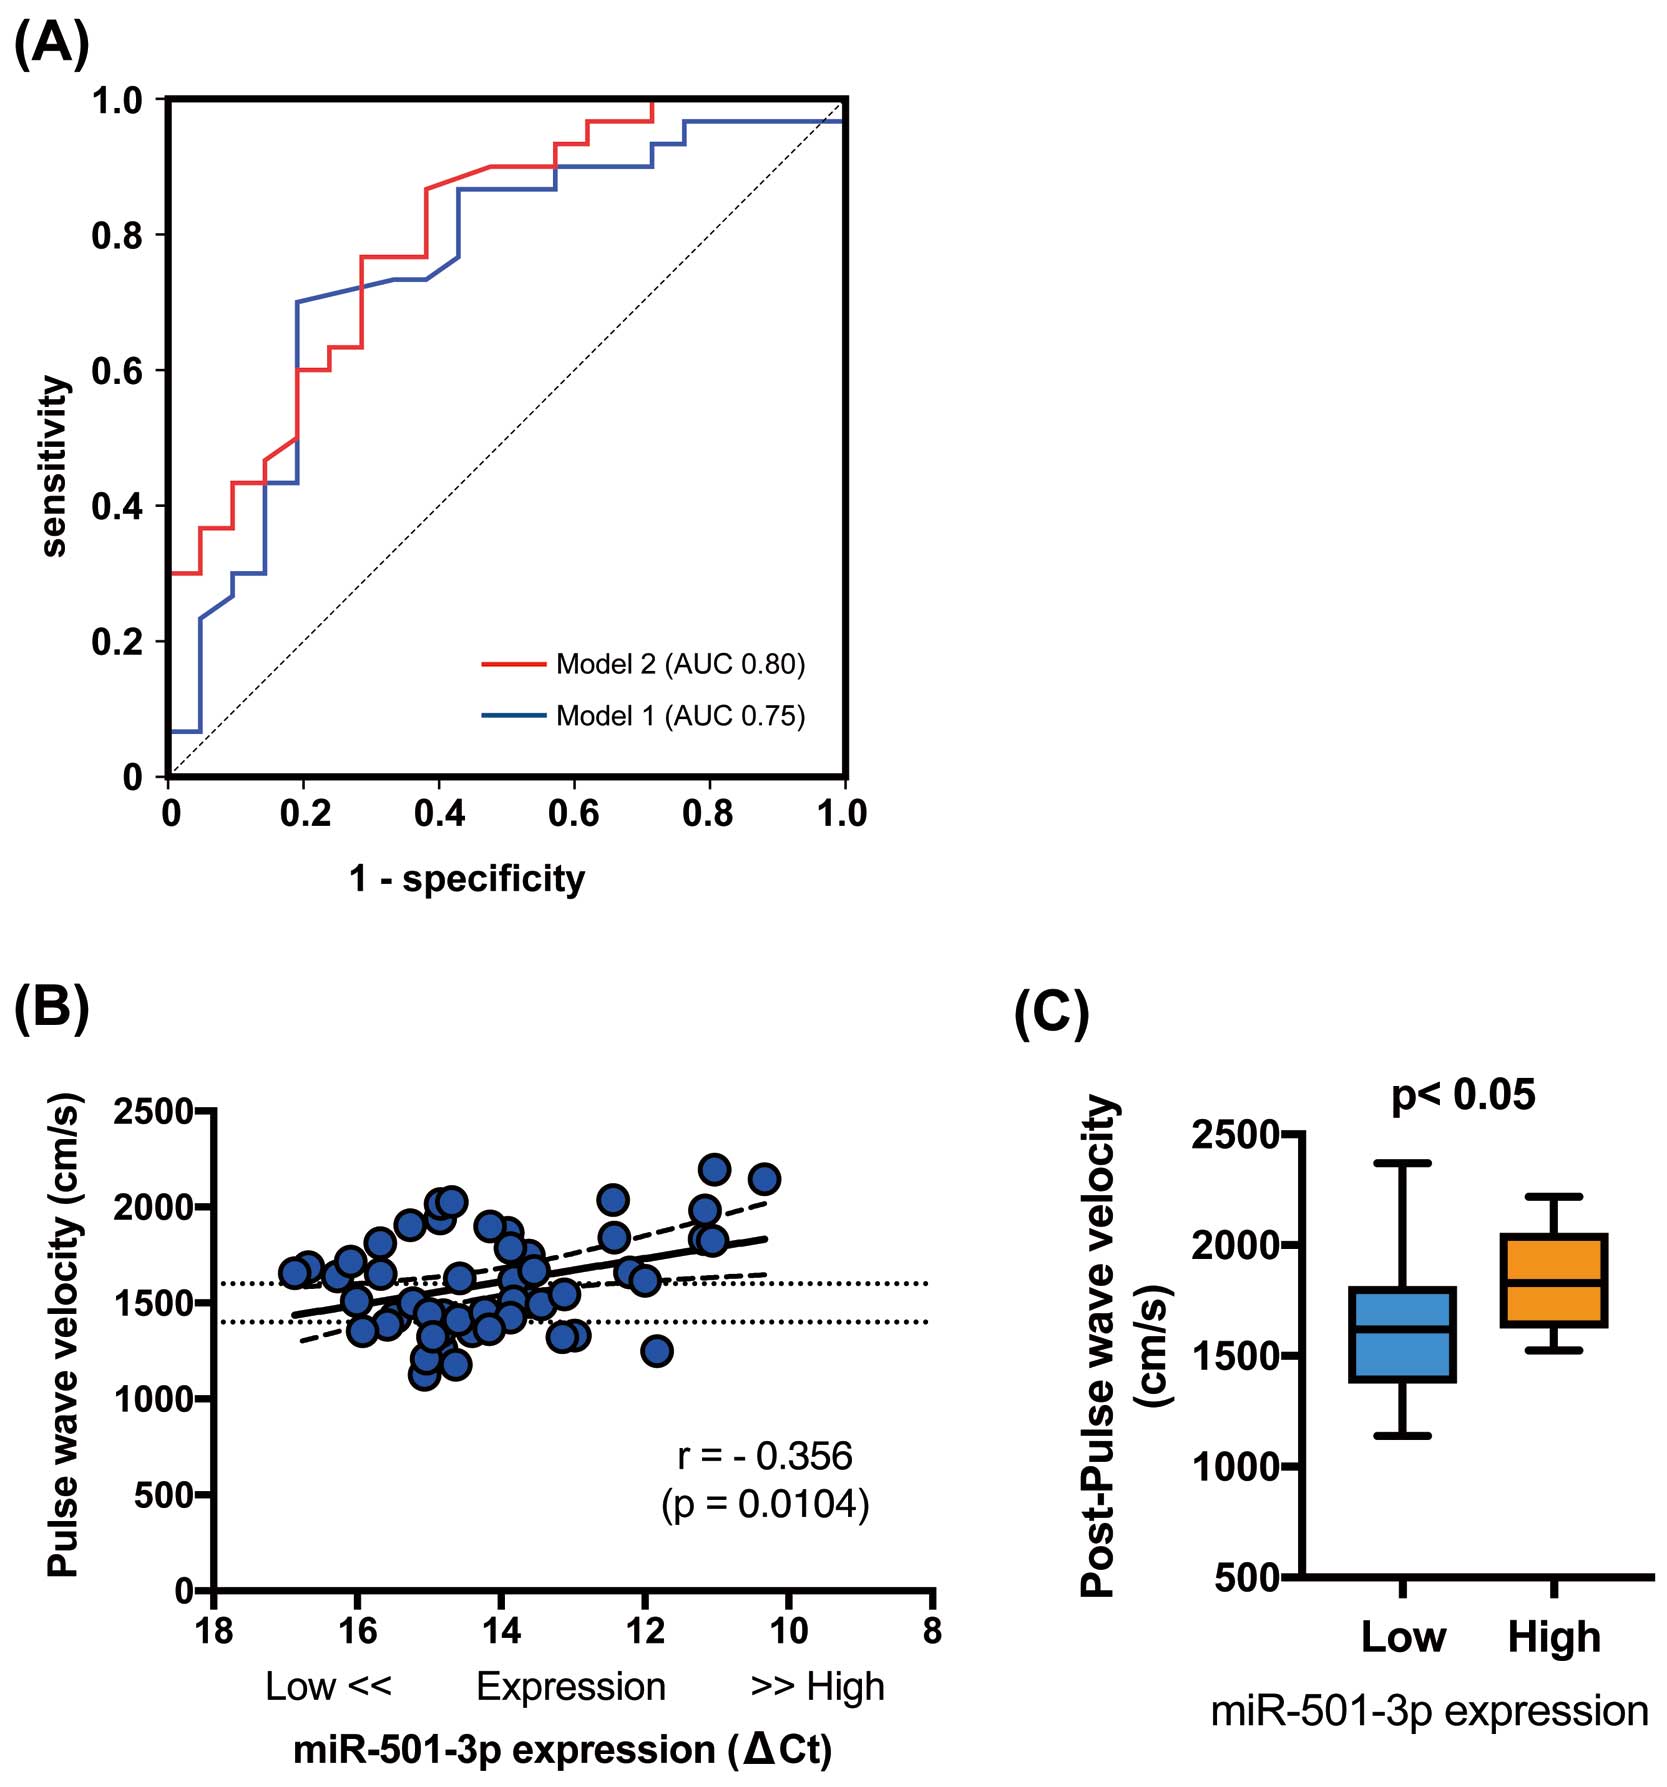
As expected and reported previously, age and both SBP and DBP were positively correlated with baPWV (Table 5). As shown in
Figure 2B, miR-501-3p levels were significantly correlated with baPWV. After adjusting for age, sex, SBP, and DBP, the use of calcium channel blockers, and the presence of hypertension, multivariate linear regression analysis revealed that plasma exosome miR-501-3p was still significantly associated with baPWV (β=−0.264, P<0.05, model R2=0.39;
Table 6). This indicates that subjects with high plasma exosome miR-501-3p expression may be at increased risk of arteriosclerotic progression.
Table 5.
Correlations Between PWV and Each Parameter for All Subjects (n=51)
| Parameter |
r |
P value |
| Age |
0.37 |
<0.01 |
| SBP |
0.52 |
<0.001 |
| DBP |
0.35 |
<0.05 |
| Heart rate |
0.14 |
0.32 |
| Body weight |
−0.08 |
0.60 |
| BMI |
−0.14 |
0.34 |
| eGFR |
−0.15 |
0.31 |
| Uric acid |
0.12 |
0.39 |
| Total cholesterol |
0.06 |
0.66 |
| HDL-C |
0.03 |
0.86 |
| LDL-C |
0.08 |
0.56 |
| Triglycerides |
−0.11 |
0.44 |
| HbA1c |
0.15 |
0.29 |
Abbreviations as in Table 2.
Table 6.
Multiple Linear Regression Analysis for PWV
| Model |
Regression
coefficient (β) |
95% CI |
P value |
| Age |
0.36 |
3.39, 20.0 |
<0.01 |
| SBP |
0.42 |
0.50, 13.7 |
<0.05 |
| DBP |
0.06 |
−9.21, 12.4 |
0.77 |
| Male sex |
0.09 |
−97.8, 193 |
0.52 |
| CCBs |
−0.08 |
−272, 170 |
0.64 |
| Hypertension |
0.04 |
−176, 217 |
0.83 |
| Plasma exosome miR-501-3p (ΔCt) |
−0.26 |
−86.5, −3.49 |
<0.05 |
Model R2=0.39. CCBs, calcium channel blockers; CI, confidence interval; DBP, diastolic blood pressure; PWV, pulse wave velocity; SBP, systolic blood pressure.
According to the Anti-Aging Center protocol, 35 of the previously evaluated subjects returned for re-examination of their baPWV approximately 5 years later (mean follow-up period 62 months). Although both the miR-501-3p High and Low groups showed an age-related increase in arterial stiffness after 5 years, baPWV levels remained significantly higher in the miR-501-3p High than Low group (P<0.05; n=13 and 22, respectively), further suggesting that plasma miR-501-3p may affect arteriosclerotic acceleration (Figure 2C).
Discussion
This study, to the best of our knowledge, is the first to demonstrate that high levels of plasma exosome miR-501-3p are positively correlated with vascular stiffness in human subjects.
Arterial stiffness results from multiple interactions of vessel walls, and the extracellular matrix, with vascular smooth muscle cells and endothelial dysfunction. Increased vascular stiffness, arteriosclerosis, has been implicated in atherosclerosis pathogenesis.12,13
An increasing number of studies has highlighted the effects of miRNAs on the development of arterial stiffness, which is achieved by miRNA modulation of critical pathways and molecules, such as transforming growth factor-β, angiotensin II, matrix metalloproteinase activity, and phenotypic switching of vascular smooth muscle cells.8
For example, miR-181b plays a crucial role in extracellular matrix remodeling, as well as in the regulation of vascular stiffness and blood pressure.14
miR-21 affects angiotensin II-mediated arterial stiffness through the downregulation of phosphatase and tensin homolog (PTEN) and SMAD7.15
Further, several microRNAs, such as miR-143/14516
and miR-221/222,17
are associated with vascular smooth muscle cell proliferation, migration and phenotypic switching. However, microRNA-based mechanisms affecting endothelial cell-cell junctions, and their effects on vascular stiffness and arteriosclerosis, have not been fully elucidated.
We recently examined the regulatory role of miR-501-3p, which limited ZO-1 gene expression, resulting in increased endothelial permeability.9
Ling et al demonstrated that overexpression of miR-501-3p promotes tumor (adenocarcinoma) expansion through down regulation of E-cadherin, which is also a tight junction component.18
ZO-1 disruption was found to increase vascular endothelial cell permeability, altering transmigration of macrophages and leading to inflammation in the vascular wall.4
Thus, high levels of exosome miR-501-3p may accelerate vascular stiffness, possibly through the disruption of tight junctions. Accordingly, subjects with elevated miR-501-3p would be expected to have higher levels of arterial stiffness.
Current cardiovascular risk evaluation is based on clinical judgment and measurement of traditional vital signs, but these are insufficient for full prediction and evaluation of cardiovascular risk. Measurement of pulse wave velocity is a commonly used technique to assess arterial wall stiffness, which is associated with increased risk of future cardiovascular events and can predict atherosclerosis development.19
Measurement of baPWV is a well-standardized, non-invasive, easy-to-use tool that has been used in many studies.10,11
It has been noted recently that downregulation of miR-21 leads to lower arterial stiffness estimated by baPWV in hypertensive patients at baseline, as well as after antihypertensive treatment.20
Further, miR-1185 and miR-765 are reportedly associated with arterial stiffness estimated by baPWV.21,22
However, to date it had not been noted whether microRNA-induced loss of tight junction function may result in clinically accelerated arteriosclerotic progression. The present study, correlating high plasma levels of miR-501-3p with elevated baPWV, suggests that miR-501-3p may alter the progression of arterial stiffness. In this way, it may serve as a risk predictor for disease progression and, potentially, future vascular events.
Study Limitations
This study has several limitations. Because this study was not a prospective study, we cannot prove the cause-and-effect relationship between miR-501-3p and vascular stiffness, although we have already shown that vascular permeability increases via the miR-501-3p/ZO-1 pathway, both in vitro and in vivo.9
Future work will be required to fully evaluate the role of miR-501-3p expression in predicting future progression of vascular stiffness and events, and more clearly defining high and low miR-501-3p expression groups in larger cohorts. It has been demonstrated that baPWV is inherently associated with blood pressure, whereas the cardio-ankle vascular index is independent of blood pressure.23
Therefore, in the present study it was necessary to include blood pressure for adjustment of the multiple linear regression analyses. The cardio-ankle vascular index may prove to be a more valid assessment test in future studies.
Conclusions
In conclusion, high plasma exosome miR-501-3p expression appears to correlate well with vascular stiffness, with an accompanying risk of progressive arteriosclerosis compared with subjects with low miR-501-3p expression, possibly through disruption of tight junctions. Therefore, inhibition of miR-501-3p could represent a new therapeutic approach to prevent future cardiovascular events.
Acknowledgments
The authors thank Chinatsu Hiraoka, Yoko Ochi, Megumi Yoshida, and Hideaki Kato for their excellent support during the study. K.T. expresses gratitude to his family, and especially Haruna Toyama, for their warm encouragement and full support.
Sources of Funding
This study was supported, in part, by a Grant-in-Aid for Scientific Research (C) (JSPS KAKENHI Grant no. 20K07805).
Disclosures
The authors have no conflicts of interest to declare.
IRB Information
This study was approved by the Institutional Review Board of Ehime University Graduate School of Medicine (Reference no. 17-3R2-K8).
References
- 1.
Stroka KM, Aranda-Espinoza H. Effects of morphology vs. cell-cell interactions on endothelial cell stiffness. Cell Mol Bioeng 2011; 4: 9–27.
- 2.
Okamoto T, Kawamoto E, Takagi Y, Akita N, Hayashi T, Park EJ, et al. Gap junction-mediated regulation of endothelial cellular stiffness. Sci Rep 2017; 7: 6134.
- 3.
Foote CA, Castorena-Gonzalez JA, Ramirez-Perez FI, Jia G, Hill MA, Reyes-Aldasoro CC, et al. Arterial stiffening in Western diet-fed mice is associated with increased vascular elastin, transforming growth factor-beta, and plasma neuraminidase. Front Physiol 2016; 7: 285.
- 4.
Chattopadhyay R, Dyukova E, Singh NK, Ohba M, Mobley JA, Rao GN. Vascular endothelial tight junctions and barrier function are disrupted by 15(S)-hydroxyeicosatetraenoic acid partly via protein kinase C epsilon-mediated zona occludens-1 phosphorylation at threonine 770/772. J Biol Chem 2014; 289: 3148–3163.
- 5.
Toyama K, Mogi M, Tsao PS. microRNA-based biomarker for dementia. Aging (Albany NY) 2019; 11: 1329–1330.
- 6.
Xia X, Wang Y, Huang Y, Zhang H, Lu H, Zheng JC. Exosomal miRNAs in central nervous system diseases: Biomarkers, pathological mediators, protective factors and therapeutic agents. Prog Neurobiol 2019; 183: 101694.
- 7.
Wang X, Dong Y, Fang T, Wang X, Chen L, Zheng C, et al. Circulating microRNA-423-3p improves the prediction of coronary artery disease in a general population: Six-year follow-up results from the China-Cardiovascular Disease Study. Circ J 2020; 84: 1155–1162.
- 8.
Nanoudis S, Pikilidou M, Yavropoulou M, Zebekakis P. The role of MicroRNAs in arterial stiffness and arterial calcification: An update and review of the literature. Front Genet 2017; 8: 209.
- 9.
Toyama K, Spin JM, Deng AC, Huang TT, Wei K, Wagenhauser MU, et al. MicroRNA-mediated therapy modulating blood-brain barrier disruption improves vascular cognitive impairment. Arterioscler Thromb Vasc Biol 2018; 38: 1392–1406.
- 10.
Ochi N, Tabara Y, Igase M, Nagai T, Kido T, Miki T, et al. Silent cerebral microbleeds associated with arterial stiffness in an apparently healthy subject. Hypertens Res 2009; 32: 255–260.
- 11.
Toyama K, Sugiyama S, Oka H, Iwasaki Y, Sumida H, Tanaka T, et al. Combination treatment of rosuvastatin or atorvastatin, with regular exercise improves arterial wall stiffness in patients with coronary artery disease. PLoS One 2012; 7: e41369.
- 12.
Kothapalli D, Liu SL, Bae YH, Monslow J, Xu T, Hawthorne EA, et al. Cardiovascular protection by ApoE and ApoE-HDL linked to suppression of ECM gene expression and arterial stiffening. Cell Rep 2012; 2: 1259–1271.
- 13.
Schaefer A, Te Riet J, Ritz K, Hoogenboezem M, Anthony EC, Mul FP, et al. Actin-binding proteins differentially regulate endothelial cell stiffness, ICAM-1 function and neutrophil transmigration. J Cell Sci 2014; 127: 4470–4482.
- 14.
Hori D, Dunkerly-Eyring B, Nomura Y, Biswas D, Steppan J, Henao-Mejia J, et al. miR-181b regulates vascular stiffness age dependently in part by regulating TGF-beta signaling. PLoS One 2017; 12: e0174108.
- 15.
Lorenzen JM, Schauerte C, Hubner A, Kolling M, Martino F, Scherf K, et al. Osteopontin is indispensible for AP1-mediated angiotensin II-related miR-21 transcription during cardiac fibrosis. Eur Heart J 2015; 36: 2184–2196.
- 16.
Zhang YN, Xie BD, Sun L, Chen W, Jiang SL, Liu W, et al. Phenotypic switching of vascular smooth muscle cells in the “normal region” of aorta from atherosclerosis patients is regulated by miR-145. J Cell Mol Med 2016; 20: 1049–1061.
- 17.
Chistiakov DA, Sobenin IA, Orekhov AN, Bobryshev YV. Human miR-221/222 in physiological and atherosclerotic vascular remodeling. Biomed Res Int 2015; 2015: 354517.
- 18.
Ling Q, Xu X, Ye P, Xie H, Gao F, Hu Q, et al. The prognostic relevance of primary tumor location in patients undergoing resection for pancreatic ductal adenocarcinoma. Oncotarget 2017; 8: 15159–15167.
- 19.
Chung J, Kim HL, Lee JP, Lim WH, Seo JB, Kim SH, et al. Association of the serum osteoprotegerin level with target organ damage in patients at high risk of coronary artery disease. Circ J 2020; 85: 69–76.
- 20.
Parthenakis F, Marketou M, Kontaraki J, Patrianakos A, Nakou H, Touloupaki M, et al. Low levels of microRNA-21 are a marker of reduced arterial stiffness in well-controlled hypertension. J Clin Hypertens (Greenwich) 2017; 19: 235–240.
- 21.
Deng H, Song Z, Xu H, Deng X, Zhang Q, Chen H, et al. MicroRNA-1185 promotes arterial stiffness through modulating VCAM-1 and E-selectin expression. Cell Physiol Biochem 2017; 41: 2183–2193.
- 22.
Liao YC, Wang YS, Hsi E, Chang MH, You YZ, Juo SH. MicroRNA-765 influences arterial stiffness through modulating apelin expression. Mol Cell Endocrinol 2015; 411: 11–19.
- 23.
Shirai K, Utino J, Otsuka K, Takata M. A novel blood pressure-independent arterial wall stiffness parameter; cardio-ankle vascular index (CAVI). J Atheroscler Thromb 2006; 13: 101–107.
