Abstract
Background: Cardiovascular disease (CVD) screening entails precise event prediction to orient risk stratification, resource allocation, and insurance policy. We used random survival forests (RSF) to identify markers of incident CVD among Japanese adults enrolled in an employer-mandated screening program.
Methods and Results: We examined biomarker, health history, medication use, and lifestyle data from 155,108 adults aged ≥40 years. The occurrence of coronary artery disease (CAD) or atherosclerotic CVD (ASCVD) events was examined over 6 years of follow-up. The analysis used RSF to identify predictors, then investigated simplified RSF models with fewer predictors for individual-level risk prediction. Data were split into training (70%) and test (30%) datasets. At baseline, the median patient age was 47 years (interquartile range 41–56 years), with 65% males. In all, 1,642 CAD and 2,164 ASCVD events were observed. RSF identified history of heart disease, age, self-reported blood pressure medication, HbA1c, fasting blood sugar, and high-density lipoprotein as important markers of both endpoints. RSF analyses with only the top 20 predictors demonstrated good performance, with areas under the curve of >84% for CAD and >82% for ASCVD in test data across 6 years.
Conclusions: We present a machine learning technique for accurate assessment of cardiovascular risk using employer-mandated annual health checkup information. The algorithm produces individual-level risk curves over time, empowering clinicians to efficiently implement prevention strategies in a low-risk population.
Screening for cardiovascular disease (CVD) in middle age is enhanced by precise prediction of future risk. Accurate, easily calculable estimates of CVD and other risks are necessary in order to stratify risk groups, govern resource allocation, and craft medical insurance and public health policies. Many such risk estimation algorithms have been developed, from the Framingham score1 and American College of Cardiology (ACC)/American Heart Association (AHA) 10-year risk model2 to increasingly more complex methods. In particular, the rise of artificial intelligence and machine learning has produced algorithms that incorporate rich data to identify unique and unrecognized markers of incident CVD.3–5 Employer-mandated healthcare programs and universal health insurance coverage of Japanese citizens facilitates regular annual health checkups, providing a valuable source of serial health data.
The adult population of Japan is among those populations with quality health status, including higher life expectancy and lower CVD mortality.6 In Japan, the age-standardized death rate per 100,000 due to ischemic heart disease in 2008 was 31.2, less than half of that in the US (81.2).7 Risk scores developed in Western nations may overestimate risk in people from different racial groups, living in different countries or environments; for example, the Framingham score has been shown to perform poorly in Japanese American men.8 The reduced performance of risk scores across distinct populations may be secondary to different lifestyle choices, genetic predisposition, and socioeconomic factors, among others.9 Alternative risk scores developed specifically for Japanese individuals have had various limitations, including only targeting CVD mortality as the outcome while ignoring other non-fatal, yet clinically significant outcomes, geographically localized samples, and a lack of data on key factors such as the use of antihypertensive medication.10–12 Despite global advances in cardiovascular risk prediction, as recently as 2017 it was proposed that “it is necessary to develop and validate applicable risk prediction tools in the Japanese population”.6
Many prior applications of machine learning tools have focused on higher-risk cohorts rather than healthy populations. Yet latent, unidentified risk is a substantial concern; approximately half of all myocardial (MI) and cerebral (strokes) infarctions occur in people not predicted to be at risk for CVD.13 Therefore, the strength and flexibility of machine learning should be leveraged in lower-risk populations to investigate early risk factors for CVD. One such machine learning technique, random survival forests (RSFs), is well suited to time-to-event analysis in datasets with many predictors. RSFs can accommodate non-linear effects and highly correlated variables, enhancing performance while retaining interpretability.14
With that aim in view, we present an analysis of data collected through a yearly screening program for a large, geographically diverse Japanese employee health system cohort with regular annual checkups. We used RSFs to: (1) identify the most important markers of incident CVD in this low-risk population; and (2) generate an algorithm through which individualized risk predictions for up to 6 years may be calculated.
Methods
Study Population
The present study examined current and former employee health data collected by Toshiba Corporation in Japan between 2011 and 2017. All ethical guidelines, including the World Medical Association’s Declaration of Helsinki, were followed for this study. The Johns Hopkins Institutional Review Board Committee approved the conduct of the analysis with a waiver of research consent (Application no. IRB00191622).
The final database comprised 155,108 adults aged ≥40 years, and included data on annual health checkups, medication usage, and inpatient diagnoses. The predictors derived from these sources are listed in the Supplementary Table. Medication data were extracted from an insurance claims database, linked to the health checkup data by individual ID codes, and consolidated into binary indicators for the usage of each therapeutic class within 12 months leading up to the baseline health checkup visit. Therapeutic classes were defined by the first 3 digits of the medication code in the World Health Organization’s National Health Insurance Drug List for Japan. Therapeutic classes that were used by <0.05% of participants were omitted.
The final dataset contained 169 predictor variables. The distributions of variables were inspected for consistency and accuracy, with values that were obvious biologically implausible outliers (e.g., very small abdominal circumference, very low or high HbA1c) omitted; most variables had no such outliers, and no variable contained more than 26 outliers.
Adjudication of Outcomes
The inpatient diagnosis database contained data on cardiac outcomes, based on International Classifications of Diseases, Tenth Revision (ICD-10) codes. We defined 2 specific CVD outcomes for this analysis: (1) coronary artery disease (CAD), defined as any of acute ischemic heart disease, MI, angina pectoris, and atherosclerotic heart disease; and (2) atherosclerotic CVD (ASCVD), which included CAD, as well as cerebrovascular events (cerebral infarction and transient cerebral ischemic attack). In the absence of CAD/ASCVD outcomes, a subject’s latest available health checkup was used as the censoring date. We used administrative censoring at 6 years to restrict prediction and inference to a range supported by the observed data.
Statistical Analysis
For analysis, we used RSF to glean information about the relative value of predictor variables. The RSF method has been described in detail elsewhere.15 Briefly, the algorithm aggregates an ensemble of trees to estimate an ensemble hazard and survival function for each distinct constellation of predictor values. Each tree is grown on a bootstrap sample of data, using binary recursive splitting based on the log-rank test statistic to discriminate event risk by selecting a limited number of candidate variables to split on and choosing the optimal split from among them. Missing values are dynamically imputed at the node level as trees are grown. Variable importance was measured using the minimum depth of the maximal subtree method, which quantifies how early a variable is selected during the splitting process. This metric has been shown to be more robust than other candidates (e.g., permutation-based variable importance) for selecting important variables.14 Another key output from the RSF analysis is the estimated ensemble event rate, the average of the ensemble cumulative hazard function across all unique time points for a given covariate value.
Our analyses sought to answer 2 distinct questions. First, which predictors from the database are most associated with cardiovascular outcomes? Second, with the aim of clinical application, can a simplified RSF algorithm be developed with fewer predictors yet equivalent performance? To answer the first question, we used RSF on the full training dataset. To answer the second question, we sequentially added variables to a new RSF in order of their importance in the full RSF, and examined when prediction error (measured as 1 minus Harrell’s concordance index on the out-of-bag data) stabilized. We then compared the predictive performance of appropriate reduced models to that of the full 169-predictor RSF by assessing prediction error and time-dependent area under the curve (AUC) evaluated at each year of follow-up.16 For each outcome, the full data was randomly split into a training set (70%), for tuning and developing the algorithm, and a test set (30%), for validation of the model’s predictive capability. To ensure consistency, we required that the training and test datasets be well balanced (<0.1% difference) on mean age, sex, mean systolic blood pressure, prior heart disease, and number (but not timing) of incident events. Analyses were performed using R version 4.0.3 using the packages randomForestSRC and riskRegression (R Project for Statistical Computing, Vienna, Austria).
Results
Study population characteristics are presented in Table 1. Among the participants, 65% were male and the median age at baseline was 47 years (interquartile range [IQR] 41–56 years). In all, 1,642 CAD and 2,164 ASCVD events occurred during a median follow-up period of 5.9 years (IQR 2.9–6.0 years). Biomarkers were indicative of a relatively healthy and stable population, with only 3% indicating abnormal glycosuria and 7% indicating abnormal proteinuria. Self-reported medication use included 12% reporting antihypertensive medication, 7% reporting lipid lowering medication, and 3% hypoglycemic medication. Anemia was present in 10% of participants, whereas 2% indicated prior heart disease, 1% indicated stroke, and <1% indicated renal failure. Nearly one-quarter of all participants reported current habitual smoking, whereas 59% reported consuming any alcohol.
Table 1. Descriptive Data From Participant Health Check Records (n=155,108)
| Variable |
n (%) or
median [IQR] |
n (%)
missing |
| Female sex |
54,606 (35.2) |
0 (0) |
| Age (years) |
47 [41–56] |
0 (0) |
| Red blood cell count (10,000/μL) |
469 [439–498] |
30,261 (20) |
| Hemoglobin (g/dL) |
14.4 [13.3–15.3] |
30,290 (20) |
| Glutamate oxaloacetate transaminase (IU/L) |
21 [18–26] |
556 (<1) |
| Glutamate pyruvate transaminase (IU/L) |
19 [14–28] |
563 (<1) |
| γ-glutamyl transpeptidase (IU/L) |
27 [18–47] |
607 (<1) |
| Fasting blood sugar (mg/dL) |
93 [87–101] |
10,212 (7) |
| HbA1c (%) |
5.45 [5.25–5.66] |
7,341 (5) |
| Triglycerides (mg/dL) |
94 [65–139] |
604 (<1) |
| HDL (mg/dL) |
60 [50–71] |
535 (<1) |
| LDL (mg/dL) |
123 [103–145] |
1,727 (1) |
| Total cholesterol (mg/dL) |
206 [184–230] |
24,297 (16) |
| SBP (mmHg) |
121 [110–132] |
990 (1) |
| DBP (mmHg) |
76 [68–84] |
976 (1) |
| BMI (kg/m2) |
23 [21–25] |
387 (<1) |
| Abdominal circumference (cm) |
82 [76–88] |
641 (<1) |
| Proteinuria |
| − (<15 mg/dL) |
143,241 (93) |
1,020 (1) |
| ± (≥15 mg/dL) |
6,537 (4) |
|
| + (≥30 mg/dL) |
2,767 (2) |
|
| 2+ (≥100 mg/dL) |
851 (1) |
|
| 3+ (≥300 mg/dL) |
685 (<1) |
|
| 4+ (≥1,000 mg/dL) |
7 (<1) |
|
| Glycosuria |
| − (<50 mg/dL) |
149,446 (97) |
1,032 (1) |
| ± (≥50 mg/dL) |
1,827 (1) |
|
| + (≥100 mg/dL) |
1,404 (1) |
|
| 2+ (≥250 mg/dL) |
635 (<1) |
|
| 3+ (≥500 mg/dL) |
662 (<1) |
|
| 4+ (≥1,000 mg/dL) |
102 (<1) |
|
| Fecal occult blood quality |
| Normal |
37,666 (24) |
0 (0) |
| Abnormal |
1,737 (1) |
|
| Not performed |
115,705 (75) |
|
| Subjective (patient-reported) symptoms |
| Yes |
81,757 (53) |
0 (0) |
| No |
51,403 (33) |
|
| No response |
21,948 (14) |
|
| Objective (physician-reported) symptoms |
| Yes |
54,056 (35) |
0 (0) |
| No |
69,824 (45) |
|
| No response |
31,228 (20) |
|
| ECG |
| Abnormal |
36,277 (23) |
0 (0) |
| Normal |
88,176 (57) |
|
| Not performed |
30,655 (20) |
|
| Chest X-ray |
| Abnormal |
1,280 (1) |
0 (0) |
| Normal |
43,802 (28) |
|
| Not performed |
110,026 (71) |
|
| Chest CT |
| Abnormal |
65 (<1) |
0 (0) |
| Normal |
967 (1) |
|
| Not performed |
154,076 (99) |
|
| Abdominal ultrasound |
| Abnormal |
2,696 (2) |
0 (0) |
| Normal |
19,368 (12) |
|
| Not performed |
133,048 (86) |
|
| Gastrointestinal X-ray |
| Abnormal |
2,095 (1) |
0 (0) |
| Normal |
28,239 (18) |
|
| Not performed |
124,774 (80) |
|
| Gastrointestinal endoscopy |
| Abnormal |
733 (<1) |
0 (0) |
| Normal |
3,863 (2) |
|
| Not performed |
150,512 (97) |
|
| Breast ultrasound |
| Abnormal |
466 (<1) |
0 (0) |
| Normal |
11,840 (8) |
|
| Not performed |
142,802 (92) |
|
| Breast visual inspection |
| Abnormal |
135 (<1) |
0 (0) |
| Normal |
3,298 (2) |
|
| Not performed |
151,675 (98) |
|
| Mammogram |
| Abnormal |
880 (1) |
0 (0) |
| Normal |
10,789 (7) |
|
| Not performed |
143,439 (92) |
|
| Gynecological examination |
| Abnormal |
280 (<1) |
0 (0) |
| Normal |
2,662 (2) |
|
| Not performed |
152,166 (98) |
|
| Metabolic syndrome |
| None |
109,166 (70) |
0 (0) |
| Premetabolic syndrome |
20,144 (13) |
|
| Standard metabolic syndrome |
18,304 (12) |
|
| Not judged |
7,494 (5) |
|
| BP medication |
18,188 (12) |
3,206 (2) |
| Blood sugar medication |
4,662 (3) |
3,269 (2) |
| Lipid-lowering medication |
10,208 (7) |
3,241 (2) |
| Stroke |
1,627 (1) |
17,722 (11) |
| Heart disease |
2,904 (2) |
17,722 (11) |
| Renal failure |
177 (<1) |
64,077 (41) |
| Anemia |
13,424 (10) |
17,815 (11) |
| Current habitual smoking |
37,277 (24) |
2,743 (2) |
| Weight gain from age 20 years |
31,144 (34) |
64,805 (42) |
| Mild exercise |
36,841 (27) |
18,445 (12) |
| Daily walking |
42,598 (31) |
18,368 (12) |
| Fast gating speed |
46,402 (51) |
64,505 (42) |
| Weight fluctuation in past year |
19,985 (22) |
64,569 (42) |
| Eating speed |
| Fast |
43,747 (32) |
18,303 (12) |
| Normal |
84,488 (62) |
|
| Slow |
8,570 (6) |
|
| Eating dinner late |
49,563 (36) |
18,206 (12) |
| Snacking late |
12,008 (13) |
64,308 (41) |
| Skipping breakfast |
23,476 (17) |
18,846 (12) |
| Frequency of drinking |
| None |
57,061 (41) |
17,527 (11) |
| Sometimes |
41,362 (30) |
|
| Daily |
39,158 (28) |
|
| Amount of drinkingA |
| None |
40,234 (30) |
18,735 (12) |
| <1 per day |
37,915 (28) |
|
| 1–2 per day |
34,903 (26) |
|
| 2–3 per day |
15,878 (12) |
|
| >3 per day |
7,443 (5) |
|
| Poor sleep |
54,341 (40) |
18,476 (12) |
| Plans for lifestyle improvement |
| No plan |
24,536 (27) |
65,107 (42) |
| Started >6 months ago |
13,474 (15) |
|
| Started ≤6 months ago |
7,888 (9) |
|
| Will start in ≤6 months |
12,934 (14) |
|
| Will start in >6 months |
31,169 (35) |
|
| Opting into health guidance |
38,209 (43) |
67,130 (43) |
AOne drink was defined as 180 mL sake, 500 mL beer, or 240 mL wine. BMI, body mass index; BP, blood pressure; CT, computed tomography; DBP, diastolic blood pressure; ECG, electrocardiogram; HDL, high-density lipoprotein; LDL, low-density lipoprotein; SBP, systolic blood pressure.
Figure 1 shows the overall CVD-free survival for the full cohort, with only an estimated 2.0% experiencing ASCVD events within the 6 years of follow-up. Table 2 lists the specific diagnostic conditions constituting observed CVD outcomes.
Table 2. Observed Outcomes Used to Define CAD and ASCVD
| Description |
CAD events
(n=1,642) |
ASCVD events
(n=2,164) |
| Angina pectoris |
1,149 |
1,139 |
| Acute MI and subsequent complications |
289 |
289 |
| Other acute ischemic heart diseases |
19 |
18 |
| Chronic ischemic heart disease |
185 |
181 |
| Cerebral infarction |
N/A |
461 |
| Transient cerebral ischemic attacks and related syndromes |
N/A |
76 |
ASCVD, atherosclerotic cardiovascular disease; CAD, coronary artery disease; MI, myocardial infarction; N/A, not applicable.
To optimize the performance of the RSFs, hyperparameter tuning was performed for each outcome to identify optimal node size and the number of variables to test at each split. The RSF error rate stabilized at around 1,200 trees; we grew each training forest with 2,000. The prediction error was 16.5% and 16.9% for CAD and ASCVD, respectively, in the training data, and 16.2% and 18.1% for CAD and ASCVD, respectively in the test data. The top 20 variables identified by the RSF model are listed in Table 3, along with variable importance, measured as the minimum depth to maximal subtree. Seven of the top 10 predictors rank near the top for both outcomes, including history of heart disease, antiplatelet and anticoagulant therapies, age, self-reported blood pressure medication, HbA1c, fasting blood sugar, and high-density lipoprotein. The estimated ensemble event rate as a function of the variables for the top 8 predictors is shown in Supplementary Figure 1.
Table 3. Top 20 Predictors of CAD and ASCVD on Unimputed Training Data by the Random Survival Forest Algorithm
| Outcome: CAD |
Outcome: ASCVD |
| Predictor |
Minimum depth of
maximal subtree |
Predictor |
Minimum depth of
maximal subtree |
| Prior heart disease |
0.884 |
Prior heart disease |
2.494 |
| Antiplatelet and anticoagulant therapies |
1.370 |
Antiplatelet and anticoagulant therapies |
2.774 |
| Age |
2.441 |
Age |
3.104 |
| Self-reported BP medication |
3.984 |
Self-reported BP medication |
4.253 |
| HbA1c |
4.722 |
HbA1c |
4.338 |
| HDL |
4.737 |
SBP |
4.477 |
| Total cholesterol |
4.912 |
Fasting blood sugar |
4.747 |
| Metabolic diagnosis |
5.149 |
HDL |
4.781 |
| Fasting blood sugar |
5.294 |
Vasodilator use |
4.794 |
| Hemoglobin |
5.471 |
DBP |
5.196 |
| SBP |
5.511 |
Glycosuria level |
5.529 |
| Glycosuria level |
5.761 |
Hemoglobin |
5.657 |
| Proteinuria level |
5.770 |
Metabolic diagnosis |
5.708 |
| LDL |
5.955 |
Total cholesterol |
5.830 |
| DBP |
6.005 |
Proteinuria level |
5.862 |
| Stroke |
6.014 |
Sex |
6.004 |
| GOT |
6.534 |
LDL |
6.173 |
| BMI |
6.764 |
Red blood cell count |
6.231 |
| Red blood cell count |
7.018 |
Triglycerides |
6.274 |
| Abdominal circumference |
7.140 |
Postal code |
6.348 |
GOT, glutamic oxaloacetic transaminase. Other abbreviations as in Tables 1,2.
Concordance error rates in reduced RSF submodels dropped steeply until approximately 10 predictors were included, and leveled off fully by 20 predictors (Figure 2). We therefore compared the performance of the full RSF model to both the 10- and 20-variable submodels of easier implementation. With 20 variables, the prediction error was lower than for the full RSF: 16.2% and 16.9% for CAD and ASCVD, respectively, in the training data, and 15.5% and 18.2% for CAD and ASCVD, respectively, in the test data. With 10 variables, the error values rose slightly: 17.1% and 18.1% for CAD and ASCVD, respectively, in the training data, and 16.3% and 20.2% for CAD and ASCVD, respectively, in the test data. The time-varying AUCs for these RSF models are shown in Figure 3. Consistent with the prediction error results, the 20-variable submodel exhibits slightly greater performance than the full 169-variable model or the reduced 10-variable model.

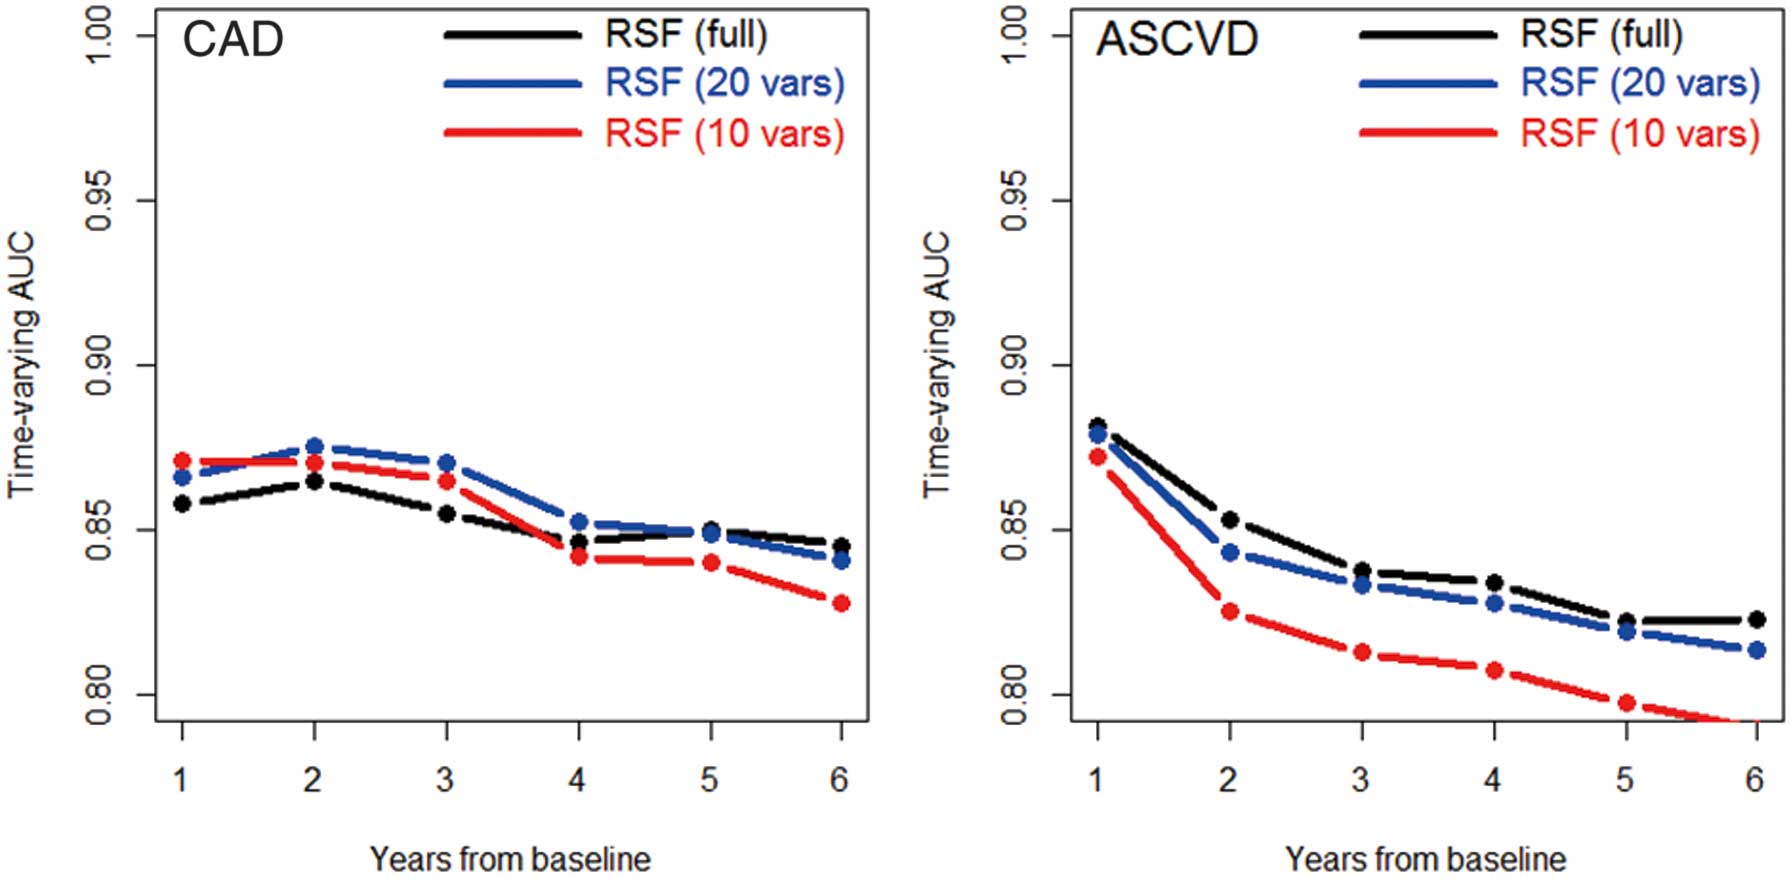
Figure 4 demonstrates a potential implementation of the 20-variable RSF model, showing estimated individual trajectories of event-free survival and percentiles of risk (compared with the distribution of predicted risk in the test data) for 3 participants selected from the test data at varying risk strata. Figure 5 shows the distributions of 3 points on these curves (the probability of an ASCVD event at 1, 3, and 5 years) for all participants in the test data, stratified by whether an event was observed during follow-up or not. Here, the discriminating capability of the model can be seen clearly, as individuals who go on to have events tend to have visibly higher predicted event probabilities across all time points (Figure 5).

Discussion
In this analysis, we leveraged annual health checkup data and the power of machine learning to create a RSF predicting cardiovascular events over 6 years within a large, middle-aged, Japanese health system, achieving an error rate <17% for CAD and <19% for ASCVD, along with AUCs >80%, and providing practical models using the dynamic imputation and variable selection capabilities of RSF that perform similarly to RSF models including all variables. The use of dynamic imputation and a reduced set of input variables allow for efficient real-time implementation. In addition, we were able to accurately estimate person-specific risk trajectories identifying event risk over time.
The measures of accuracy we obtained are comparable to those found using similar approaches in other large studies, including the Hisayama Study17 (C-statistic of 0.81 using Cox model), Japan Public Health Center Study12 (AUC of 0.81 for CAD and 0.78 for ischemic stroke using Fine and Gray model with death as the competing event) and the Multi-Ethnic Study of Atherosclerosis18 (concordance indices of 0.80–0.81 for CAD and ASCVD using an RSF model). As a more direct comparison, we compared the 20-variable RSF model to a Cox model based on the covariates of the Suita score,19 a recently developed risk score for use in the Japanese population. Although this comparison required imputation of missing data for the Cox model, which we performed using the impute.rfsrc function from the randomForestSRC package, we found the AUC of the RSF-based score to be higher across all 6 years by 0.6–1.8% for CAD and by 0.3–1.6% for ASCVD (Supplementary Figure 2). The proportion of individuals at high risk in our population is low compared with Western populations, yet similar to other Japanese cohorts.12,19
Although a strength of the RSF analysis is its ability to assess and compare hundreds of predictors, it is impractical to ask clinicians to input hundreds of data points in order to generate a patient’s risk score. Our analysis revealed that equivalent or better predictions can be obtained using only the 20 strongest predictors, which include mostly easily available metrics, including age, sex, medication use, blood pressure, and lipid measurements. Such distillation of data is important not only for on-the-ground implementation, but also for easier interpretation by physicians and communication with patients. More recent extensions of machine learning have sought to remove the human element from model construction, using automated techniques such as Auto-SKLearn20 and developing complex tools such as AutoPrognosis.5 Although these are valuable and have clear strengths, including far more rapid production of complete models than humanly possible,20 we favored a more hands-on approach to model development in the present study to retain greater control over the procedures and output than a “black-box” methodology would permit.
It is perhaps not surprising that our two strongest predictors, prior heart disease and the use of antiplatelet and anticoagulant medications, are both indicators of pre-existing cardiovascular conditions. Many large studies exclude individuals with history of CVD,5,21 whereas others, such as the Atherosclerosis Risk in Communities study and Cardiovascular Health Study, have included them.22,23 We chose to include them in order to keep our results generalizable to the broader population and to allow the use of our risk prediction tool in all patients. In light of this decision, we caution readers to interpret the results carefully, recognizing that our predictions largely reflect deterioration or recurrence of events in subjects with prior CVD rather than incident events among those who are CVD-naïve. Although our goal was to characterize the risk of future heart disease based on a selected cohort of Japanese employees, for the purpose of primary prevention, those with prior heart disease ought to be excluded. When the analysis was repeated in the subset without prior heart disease, the out-of-bag and test error rates which had been 16–18% for the full cohort as reported above, grew to 20–21%, whereas the top risk factors were largely unchanged aside from the reduced importance of antiplatelet and anticoagulant therapies. Furthermore, although the relationship between past and future cardiac events is strong, characterizing the probability that otherwise-healthy subjects with some cardiac history will go on to have events remains of great interest. A strength of RSF is that each split gives a new random subset of predictors an opportunity to demonstrate their predictive usefulness, so that the high correlation between past and future cardiac events does not automatically obscure the predictive power of other biomarkers and lifestyle factors.14
Our RSF also identified known risk factors, such as older age, male sex, high blood pressure, antihypertensive therapy, dyslipidemia, and HbA1c. These align with results from other large studies; Alaa et al5 identified age and elevated blood pressure among their top 7 variables for both men and women, whereas Weng et al21 identified age, sex, high-density lipoprotein, and HbA1c among their top 6. We also noted the presence of lesser-known predictors, including hemoglobin and red blood cell count, among the top 20 predictors. Although these are not considered traditional risk factors, they have been associated with CVD in other studies.24,25 Importantly, our study did not identify smoking or other lifestyle factors, such as gait speed, as important predictors. Historically, smoking has been observed to confer less increase in CVD risk in Japan relative to other countries.26 Furthermore, the effect of smoking is considered to be cumulative; we did not have pack-year data to investigate this gradient effect. Smokers and non-smokers had similar event rates for the first 3 years of follow-up in univariate analyses, after which smoking began to confer additional risk (Supplementary Figure 3).
Traditional risk calculators offer a single-number summary of risk, generally the percentage chance of incident outcomes by some number of years. We generated individualized risk trajectories in the form of survival curves, from which CVD risk at multiple time points can be extracted. However, in general, the further away one gets from a chosen baseline, the less accurate the predictions made on that baseline data will be. We observed this in our study, as the AUCs dropped from 86–89% to 80–85% between 1 and 6 years from baseline. This comports with previous suggestions that 10-year risk estimates should be re-examined every 4–6 years in specific populations.6 Although it is important to have long-term risk in view, calculations constructed from time-fixed data should be used with caution and regularly updated.
There are a few limitations to this study. One is the lack of a true external dataset for validation of the RSF results. However, separation of a single dataset into training and test data is common practice, and the large volume of our data provides a test set of over 45,000 individuals. Second, the predictors investigated in this study cover only what is available from basic health checkups, which excludes known predictors, such as calcium score and troponin, among other biomarkers, which are measured with less widely available methods. However, as noted above, using only readily available data allows for easy clinical adoption.
In conclusion, using RSF, we were able to determine key variables predictive of ASCVD and CAD events in a Japanese adult population, using data from mandated yearly health checkups. The individualized risk assessments and parsimonious models provided by our algorithm should help guide individuals, health practitioners, and policy makers in personalizing health care choices and identifying higher-risk individuals for secondary screening and early intervention. Further work is needed to confirm the utility of our results in risk prevention among Japanese individuals and to potentially extend our findings to populations worldwide.
Sources of Funding
This study was funded by a grant awarded by Toshiba Corporation to the Johns Hopkins University.
Disclosures
All authors report funding from Toshiba Corporation for the development and completion of this research. S.B. is an employee of Toshiba Corporation.
IRB Information
This study was approved by the Johns Hopkins Institutional Review Board (IRB00191622).
Data Availability
The deidentified participant data will not be shared.
Supplementary Files
Please find supplementary file(s);
https://doi.org/10.1253/circrep.CR-22-0101
References
- 1.
Wilson PW, D’Agostino RB, Levy D, Belanger AM, Silbershatz H, Kannel WB. Prediction of coronary heart disease using risk factor categories. Circulation 1998; 97: 1837–1847, doi:10.1161/01.cir.97.18.183.
- 2.
Goff DC, Lloyd-Jones DM, Bennett G, Coady S, D’Agostino RB, Gibbons R, et al. 2013 ACC/AHA guideline on the assessment of cardiovascular risk. Circulation 2014; 129(25_suppl_2): S49–S73, doi:10.1161/01.cir.0000437741.48606.98.
- 3.
Goldstein BA, Navar AM, Carter RE. Moving beyond regression techniques in cardiovascular risk prediction: Applying machine learning to address analytic challenges. Eur Heart J 2017; 38: 1805–1814, doi:10.1093/eurheartj/ehw302.
- 4.
Shameer K, Johnson KW, Glicksberg BS, Dudley JT, Sengupta PP. Machine learning in cardiovascular medicine: Are we there yet? Heart 2018; 104: 1156–1164, doi:10.1136/heartjnl-2017-311198.
- 5.
Alaa AM, Bolton T, Angelantonio ED, Rudd JHF, van der Schaar M. Cardiovascular disease risk prediction using automated machine learning: A prospective study of 423,604 UK Biobank participants. PLoS One 2019; 14: e0213653, doi:10.1371/journal.pone.0213653.
- 6.
Nojiri S, Daida H. Atherosclerotic cardiovascular risk in Japan. Jpn Clin Med 2017; 8: 1179066017712713, doi:10.1177/1179066017712713.
- 7.
Mendis S, Puska P, Norrving B, World Health Organization, World Heart Federation, World Stroke Organization. Global atlas on cardiovascular disease prevention and control. 2011. https://apps.who.int/iris/handle/10665/44701 (accessed September 7, 2021).
- 8.
D’Agostino RB, Grundy S, Sullivan LM, Wilson P, CHD Risk Prediction Group. Validation of the Framingham coronary heart disease prediction scores: Results of a multiple ethnic groups investigation. JAMA 2001; 286: 180–187, doi:10.1001/jama.286.2.180.
- 9.
Roth GA, Mensah GA, Johnson CO, Addolorato G, Ammirati E, Baddour LM, et al. Global burden of cardiovascular diseases and risk factors, 1990–2019: Update from the GBD 2019 Study. J Am Coll Cardiol 2020; 76: 2982–3021, doi:10.1016/j.jacc.2020.11.010.
- 10.
NIPPON DATA80 Research Group. Risk assessment chart for death from cardiovascular disease based on a 19-year follow-up study of a Japanese representative population. Circ J 2006; 70: 1249–1255, doi:10.1253/circj.70.1249.
- 11.
Nishimura K, Okamura T, Watanabe M, Nakai M, Takegami M, Higashiyama A, et al. Predicting coronary heart disease using risk factor categories for a Japanese urban population, and comparison with the Framingham risk score: The Suita Study. J Atheroscler Thromb 2014; 21: 784–798, doi:10.5551/jat.19356.
- 12.
Yatsuya H, Iso H, Li Y, Yamagishi K, Kokubo Y, Saito I, et al. Development of a risk equation for the incidence of coronary artery disease and ischemic stroke for middle-aged Japanese: Japan public health center-based prospective study. Circ J 2016; 80: 1386–1395, doi:10.1253/circj.CJ-16-0081.
- 13.
Ridker PM, Danielson E, Fonseca FAH, Genest J, Gotto AM, Kastelein JJP, et al. Rosuvastatin to prevent vascular events in men and women with elevated C-reactive protein. N Engl J Med 2008; 359: 2195–2207, doi:10.1056/NEJMoa0807646.
- 14.
Ishwaran H, Kogalur UB, Gorodeski EZ, Minn AJ, Lauer MS. High-dimensional variable selection for survival data. J Am Stat Assoc 2010; 105: 205–217, doi:10.1198/jasa.2009.tm08622.
- 15.
Ishwaran H, Kogalur UB, Blackstone EH, Lauer MS. Random survival forests. Ann Appl Stat 2008; 2: 841–860, doi:10.1214/08-AOAS169.
- 16.
Heagerty PJ, Lumley T, Pepe MS. Time-dependent ROC curves for censored survival data and a diagnostic marker. Biometrics 2000; 56: 337–344, doi:10.1111/j.0006-341x.2000.00337.x.
- 17.
Arima H, Yonemoto K, Doi Y, Ninomiya T, Hata J, Tanizaki Y, et al. Development and validation of a cardiovascular risk prediction model for Japanese: The Hisayama Study. Hypertens Res 2009; 32: 1119–1122, doi:10.1038/hr.2009.161.
- 18.
Ambale-Venkatesh B, Yang X, Wu CO, Liu K, Hundley WG, McClelland R, et al. Cardiovascular event prediction by machine learning: The multi-ethnic study of atherosclerosis. Circ Res 2017; 121: 1092–1101, doi:10.1161/CIRCRESAHA.117.311312.
- 19.
Nakai M, Watanabe M, Kokubo Y, Nishimura K, Higashiyama A, Takegami M, et al. Development of a cardiovascular disease risk prediction model using the Suita Study, a population-based prospective cohort study in Japan. J Atheroscler Thromb 2020; 27: 1160–1175, doi:10.5551/jat.48843.
- 20.
Padmanabhan M, Yuan P, Chada G, Nguyen HV. Physician-friendly machine learning: A case study with cardiovascular disease risk prediction. J Clin Med 2019; 8: 1050, doi:10.3390/jcm8071050.
- 21.
Weng SF, Reps J, Kai J, Garibaldi JM, Qureshi N. Can machine-learning improve cardiovascular risk prediction using routine clinical data? PLoS One 2017; 12: e0174944, doi:10.1371/journal.pone.0174944.
- 22.
The Atherosclerosis Risk in Communities (ARIC) Study: Design and objectives. The ARIC investigators. Am J Epidemiol 1989; 129: 687–702.
- 23.
Fried LP, Borhani NO, Enright P, Furberg CD, Gardin JM, Kronmal RA, et al. The cardiovascular health study: Design and rationale. Ann Epidemiol 1991; 1: 263–276, doi:10.1016/1047-2797(91)90005-W.
- 24.
Chonchol M, Nielson C. Hemoglobin levels and coronary artery disease. Am Heart J 2008; 155: 494–498, doi:10.1016/j.ahj.2007.10.031.
- 25.
Schaffer A, Verdoia M, Cassetti E, Barbieri L, Perrone-Filardi P, Marino P, et al. Impact of red blood cells count and high density lipoproteins with the prevalence and extent of coronary artery disease. J Thromb Thrombolysis 2015; 40: 61–68, doi:10.1007/s11239-015-1174-x.
- 26.
Marmot MG, Syme SL, Kagan A, Kato H, Cohen JB, Belsky J. Epidemiologic studies of coronary heart disease and stroke in Japanese men living in Japan, Hawaii and California: Prevalence of coronary and hypertensive heart disease and associated risk factors. Am J Epidemiol 1975; 102: 514–525, doi:10.1093/oxfordjournals.aje.a112189.


