Abstract
Background: Post hoc analysis of the PARADIGM-HF trial showed that sacubitril/valsartan (S/V) was more effective than enalapril in lowering HbA1c in patients with heart failure and diabetes.
Methods and Results: In the present study, the effect of S/V on glycemic control was retrospectively analyzed in 150 patients (median age 74 years) who were prescribed S/V for the treatment of heart failure and/or hypertension. After a median period of 13 weeks treatment, mean (±SD) HbA1c levels decreased significantly from 6.56±0.68% to 6.49±0.63%. The decrease in HbA1c was evident in patients with (n=111), but not in those without, diabetes. There were no significant changes in renal function after S/V treatment, but systolic blood pressure was significantly reduced from 141±21 to 134±19 mmHg. Ninety patients had N-terminal pro B-type natriuretic peptide (NT-proBNP) tested, and S/V significantly decreased median NT-proBNP concentrations from 1,026 to 618 pg/mL; however, there was no correlation between the degree of decrease in HbA1c and that in NT-proBNP. Multiple regression analysis revealed that being diabetic, rather than having heart failure, was a significant independent variable for a reduction in HbA1c.
Conclusions: Treatment with S/V improved glycemic control in patients with heart failure and/or hypertension, especially in those with concomitant diabetes. This favorable effect on glucose metabolism may be mediated by neprilysin inhibition and is desirable in the treatment of heart failure and hypertension in diabetic patients.
Diabetes and hypertension, 2 major lifestyle-related diseases, are known to be based on insulin resistance and often coexist. In Japan, the frequency of hypertension in diabetic patients has been reported to be approximately twice that in non-diabetic patients, and the prevalence of diabetes in hypertensive patients is 2- to 3-fold higher than in normotensive patients.1 It is well known that both hypertension and diabetes are important risk factors for the development of heart failure. Hypertension is a risk factor for the development of heart failure and cardiovascular events, and blood pressure (BP) control has been reported to significantly reduce these events.2,3 Diabetes and heart failure are also causally related to each other and often coexist, with the prevalence of diabetes in heart failure patients being as high as 35–40%.4 Conversely, the incidence of heart failure in diabetic patients has been reported to be 2.9-fold higher than in non-diabetic patients, even after adjusting for sex and age.5 More importantly, the degree of glycemic control has been shown to be associated not only with the development of heart failure, but also with the prognosis for heart failure.6–8 Therefore, management of diabetes and hypertension is critical to prevent the development of heart failure and improve prognosis.
Treatment with sacubitril/valsartan (S/V), an angiotensin receptor–neprilysin inhibitor, reduced the rates of cardiovascular death or hospitalization for heart failure by 20% and all-cause mortality by 16% in patients with heart failure with reduced ejection fraction (HFrEF) compared with treatment with enalapril, an angiotensin-converting enzyme (ACE) inhibitor.9 Based on the results of that study, the administration of S/V to patients with HFrEF is recommended as Class 1 therapy in guidelines for the management of heart failure in many countries.10–12 A post hoc analysis of the PARADIGM-HF trial showed that S/V reduced HbA1c levels and the need for insulin initiation in patients with HFrEF and diabetes.13 This effect of improving glucose metabolism is desirable in the treatment of heart failure, but it is not clear whether this effect is limited to diabetic patients and whether it is a pharmacological effect of the drug or an indirect effect mediated via improvements in heart failure. However, only a few studies have investigated the effectiveness of S/V in improving blood glucose levels, especially in actual clinical practice.14,15 S/V has been approved for the treatment of hypertension in addition to heart failure in Japan since 2021. Thus, S/V can be used in patients with or without heart failure in Japan, and the effect of heart failure on improvements in blood glucose with S/V can be studied. In the present study, we retrospectively analyzed the effect of S/V on glycemic control in patients with heart failure and/or hypertension.
Methods
This study was conducted in strict adherence with the principles of the Declaration of Helsinki. Informed consent for this retrospective study was obtained via study information publicized on the Internet.
Patients who were prescribed S/V for heart failure and/or hypertension between October 1, 2020, and April 30, 2022, were included in the study. To reduce confounding factors related to glycemic control, patients in whom HbA1c was measured immediately before and approximately 3 months after the commencement of S/V treatment were included. Patients whose other medications were changed and patients who were hospitalized during the study period were excluded. Blood tests and BP measurements were performed in our outpatient clinic as part of regular practice, and the results were extracted retrospectively from electronic medical records. Patients with heart failure were defined as those whose physician diagnosed heart failure at the initial visit and who have continued outpatient treatment. The diagnosis of heart failure was based on subjective symptoms, such as shortness of breath, chest X-ray findings, and elevated B-type natriuretic peptide or N-terminal pro B-type natriuretic peptide (NT-proBNP). Hypertension was defined as BP of 140/90 mmHg or higher and/or the use of medication for hypertension; diabetes was defined as an HbA1c level of 6.5% or higher and/or the use of medication for diabetes.
Statistical Analysis
Continuous variables with a normal distribution are expressed as the mean±SD, whereas those with a skewed distribution are presented as the median with interquartile range (IQR). The distribution of each parameter was tested for normality using the Shapiro-Wilk test. Paired t-tests or Wilcoxon signed-rank tests were used to compare data before and after S/V treatment. Intergroup differences in percentages of demographic parameters were examined by Fisher’s exact test, and comparisons of variables between patients with and without diabetes were made using t-tests or the Mann-Whitney U test. Multiple regression analysis was used to identify factors involved in the reduction in HbA1c after S/V treatment. Differences were considered to be significant at P<0.05.
Results
Of the 472 patients treated with S/V during the study period, 237 underwent HbA1c testing before and after starting treatment. Of these 237 patients, 57 were excluded because of changes in other medications and another 30 were excluded due to inpatient treatment during the study period; thus, 150 patients were included in the present study. The clinical characteristics of the patients and their use of therapeutic agents are presented in Table 1. The median age of patients was 74 years (IQR 68–80 years), 68.9% were male and the median body mass index was 25.3 kg/m2
(IQR 22.5–28.0 kg/m2). Of the 150 patients in the study, 107 had chronic heart failure (50 ischemic, 57 non-ischemic), 126 had hypertension, and 111 had diabetes. Administration of S/V was initiated twice daily in 80 patients to treat heart failure and once daily in 70 patients to treat hypertension. Most patients (95.3%) were switched from angiotensin II receptor blockers (ARBs) or ACE inhibitors. The starting dose of S/V was set by the attending physician according to the dose of ARBs or ACE inhibitors being used. After a median of 13 weeks S/V treatment, HbA1c levels had decreased significantly from 6.56±0.68% to 6.49±0.63% (Figure 1A). Estimated glomerular filtration rate (eGFR) decreased slightly from 55.8±20.5 to 54.5±20.2 mL/min/1.73 m2, but serum potassium concentrations remained unchanged. Systolic, but not diastolic, BP was significantly reduced (from 141.1±21.4/71.0±13.3 to 133.9±19.1/69.7±13.3 mmHg). In multiple regression analysis for reductions in HbA1c, having diabetes was found to be a significant independent variable (Table 2).
Table 1. Baseline Clinical Characteristics
| |
All patients |
Diabetes |
No diabetes |
P value |
| No. patients |
150 |
111 |
39 |
|
| Age (years) |
74 [68–80] |
73 [68–79] |
76 [67–83] |
0.487 |
| Male sex |
104 (68.9) |
73 (65.8) |
31 (79.5) |
0.157 |
| BMI (kg/m2) |
25.3 [22.5–28.0] |
25.7 [22.6–28.1] |
25.0 [21.6–26.6] |
0.300 |
| HbA1c (%) |
| Mean±SD |
6.56±0.68 |
6.82±0.54 |
5.81±0.38 |
0.000 |
| Median [IQR] |
6.5 [6.2–7.0] |
6.7 [6.5–7.1] |
5.8 [5.6–6.1] |
0.000 |
| eGFR (mL/min/1.73 m2) |
55.8±20.5 |
54.8±20.3 |
58.4±21.0 |
0.346 |
| K (mEq/L) |
4.20±0.43 |
4.21±0.44 |
4.18±0.37 |
0.717 |
| Systolic BP (mmHg) |
141.1±21.4 |
143.6±21.3 |
134.0±20.1 |
0.015 |
| Diastolic BP (mmHg) |
71.0±13.3 |
72.0±12.6 |
68.3±14.8 |
0.133 |
| NT-proBNP (pg/mL) |
1,026 [377–2,095] |
996 [382–1,954] |
1,192 [358–2,797] |
0.461 |
| No. patients |
90 |
62 |
28 |
|
| Comorbidities |
| Heart failure |
107 (71.3) |
72 (64.9) |
35 (89.7) |
0.003 |
| HFrEF |
43 |
32 |
11 |
|
| HFmrEF |
28 |
19 |
9 |
|
| HFpEF |
34 |
20 |
14 |
|
| Unknown |
2 |
1 |
1 |
|
| Hypertension |
126 (84.0) |
93 (83.4) |
33 (84.6) |
1.000 |
| Medications |
| Calcium channel blockers |
76 (50.7) |
59 (53.2) |
17 (43.6) |
0.354 |
| β-blockers |
105 (70.0) |
75 (67.6) |
30 (76.9) |
0.315 |
| Diuretics |
79 (52.7) |
58 (52.3) |
21 (53.8) |
1.000 |
| MRA |
34 (22.7) |
23 (20.7) |
11 (28.2) |
0.376 |
| SGLT2i |
73 (48.7) |
70 (63.1) |
3 (7.7) |
0.000 |
| DPP-4i |
68 (45.3) |
68 (61.3) |
N/A |
|
| Metformin |
34 (22.7) |
34 (30.6) |
N/A |
|
| Sulfonylurea |
13 (8.7) |
13 (11.7) |
N/A |
|
| Insulin |
12 (8.0) |
12 (10.8) |
N/A |
|
| GLP-1RA |
6 (4.0) |
6 (5.4) |
N/A |
|
| Other glucose-lowering treatment |
8 (5.3) |
8 (7.2) |
N/A |
|
| Sacubitril/valsartan |
| Dose (mg/day) |
200 [100–200] |
200 [100–200] |
200 [100–200] |
0.975 |
| Period (weeks) |
13 [10–17] |
12 [9–17] |
15 [12–18] |
0.009 |
| Switched from ACEI or ARB |
143 (95.3) |
104 (93.7) |
39 (100) |
0.191 |
Unless indicated otherwise, data are presented as n (%), mean±SD, or median with [IQR]. ACEI, angiotensin converting enzyme inhibitor; ARB, angiotensin II receptor blocker; BMI, body mass index; BP, blood pressure; DPP-4i, dipeptidyl peptidase-4 inhibitor; eGFR, estimated glomerular filtration rate; GLP-1RA, glucagon-like peptide-1 receptor agonist; HFmrEF, heart failure with mildly reduced ejection fraction; HFpEF, heart failure with preserved ejection fraction; HFrEF, heart failure with reduced ejection fraction; IQR, interquartile range; K, serum potassium; MRA, mineralocorticoid receptor antagonist; NT-proBNP, N-terminal pro B-type natriuretic peptide; SGLT2i, sodium-glucose cotransporter 2 inhibitor.
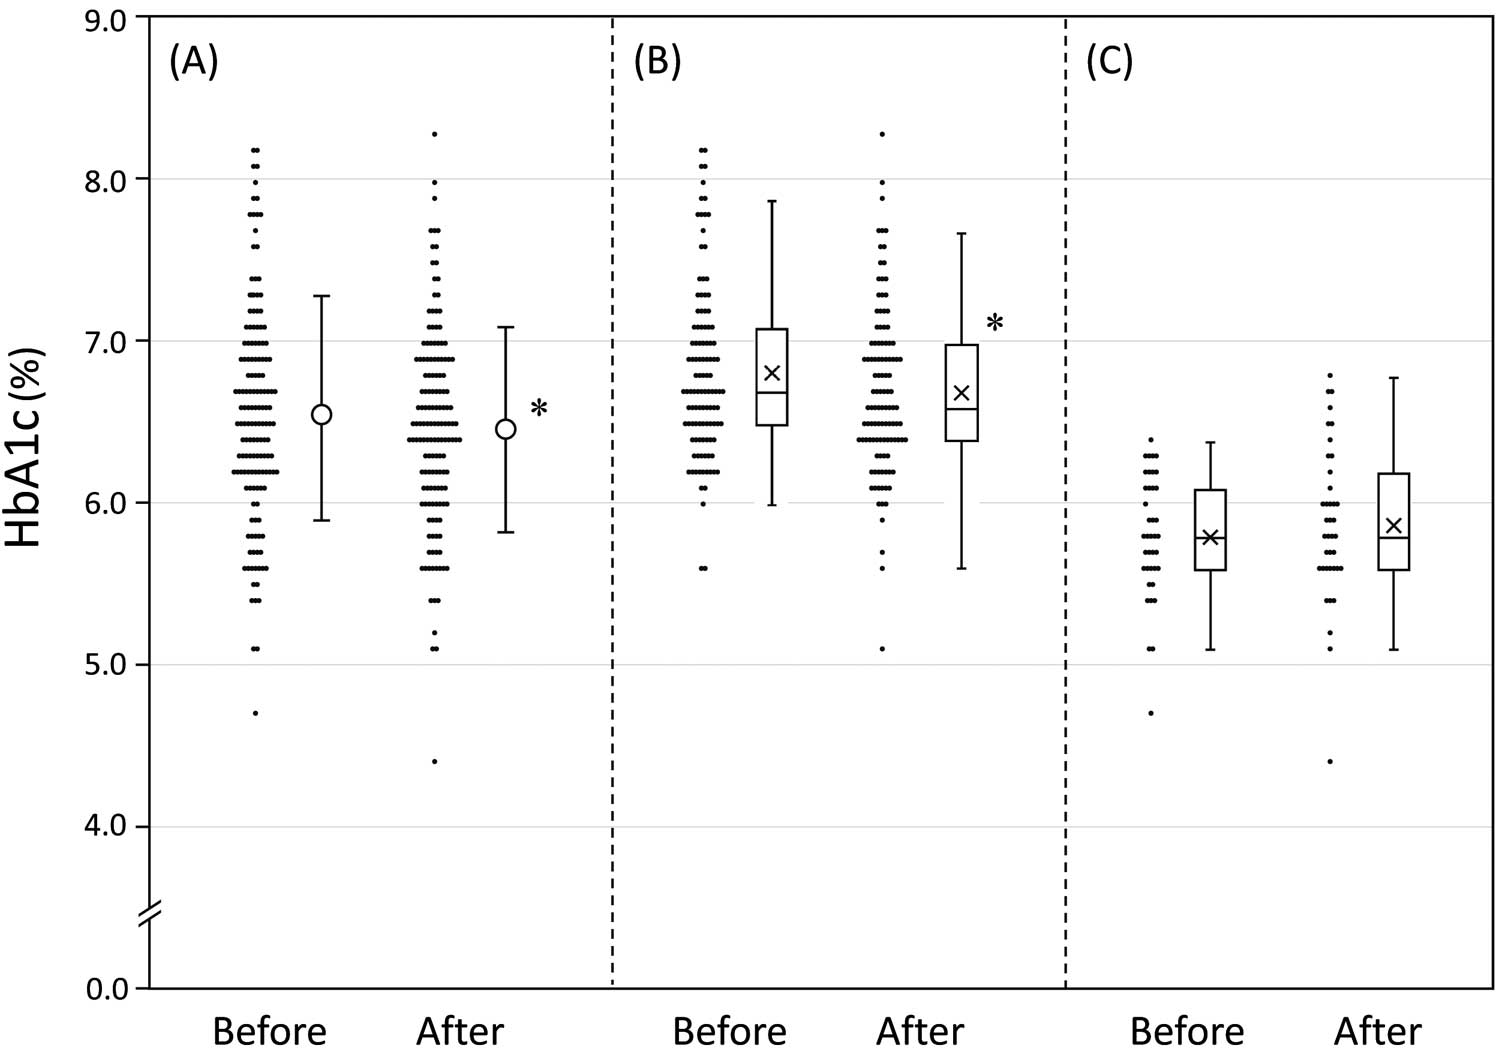
Table 2. Multiple Regression Analysis of Factors Affecting Reductions in HbA1c
| |
Estimate (95% CI) |
P value |
VIF |
| Age |
0.003 (−0.002, 0.008) |
0.273 |
1.48 |
| Female sex |
−0.106 (−0.215, 0.003) |
0.057 |
1.18 |
| BMI |
0.001 (−0.010, 0.012) |
0.840 |
1.30 |
| Heart failure |
0.004 (−0.110, 0.118) |
0.944 |
1.22 |
| Diabetes |
−0.192 (−0.307, −0.078) |
0.001 |
1.17 |
| Hypertension |
0.005 (−0.130, 0.140) |
0.068 |
1.13 |
| Treatment period (weeks) |
−0.005 (−0.016, 0.005) |
0.280 |
1.08 |
| S/V dose (per 100 mg) |
0.003 (−0.002, 0.008) |
0.920 |
1.03 |
BMI, body mass index; CI, confidence interval; S/V, sacubitril/valsartan; VIF, variance inflation factor.
Of the 111 patients with diabetes, 72 had chronic heart failure and 93 had hypertension; S/V was initiated in 54 patients to treat heart failure and in 57 patients to treat hypertension. The medications used to treat diabetes are presented in Table 1; sodium-glucose cotransporter 2 inhibitors were the most common (63.1%), followed by dipeptidyl peptidase (DPP)-4 inhibitors (61.3%) and metformin (30.6%), whereas insulin was used in only 10.8% of patients. When the patients were divided into 2 groups according to the presence or absence of diabetes, HbA1c was no longer normally distributed. After S/V treatment, the median HbA1c level decreased significantly in patients with diabetes, from 6.7% (IQR 6.5–7.1%) to 6.6% (IQR 6.4–7.0%), whereas HbA1c in patients without diabetes remained unchanged (from 5.8% [IQR 5.6–6.1%] to 5.8% [IQR 5.6–6.2%]; Figure 1B,C). Multiple regression analysis for HbA1c reductions in patients with diabetes revealed that the HbA1c level before S/V treatment was a significant independent variable (Table 3, Model 1). That is, the higher the HbA1c before treatment, the stronger the effect of S/V on blood glucose levels, although the association was modest (Figure 2). When one oral medication was added to Model 1 in Table 3, taking metformin was found to be associated with improved glycemic response after S/V administration (Table 3, Model 2). There were no differences in eGFR and serum potassium levels before and after S/V treatment, but systolic BP was significantly reduced in patients with diabetes (143.6±21.3/72.0±12.6 vs. 135.2±19.2/69.7±13.6 mmHg).
Table 3. Multiple Regression Analysis of Factors Affecting Reductions in HbA1c in Patients With Diabetes
| |
Estimate (95% CI) |
P value |
VIF |
| Model 1 |
| Age |
−0.002 (−0.006, 0.007) |
0.940 |
1.46 |
| Female sex |
−0.101 (0.233, 0.297) |
0.128 |
1.32 |
| BMI |
0.0002 (−0.013, 0.013) |
0.973 |
1.30 |
| Heart failure |
0.009 (−0.119, 0.138) |
0.883 |
1.27 |
| HbA1c before S/V treatment |
−0.173 (−0.284, −0.064) |
0.002 |
1.21 |
| Hypertension |
−0.048 (−0.209, 0.114) |
0.559 |
1.20 |
| Insulin use |
−0.065 (−0.25, 0.120) |
0.559 |
1.12 |
| S/V dose (per 100 mg) |
0.070 (−0.009, 0.149) |
0.082 |
1.08 |
| Model 2 |
| Model 1+SGLT2i |
−0.005 (−0.126, 0.116) |
0.935 |
1.15 |
| Model 1+DPP-4i |
−0.069 (−0.183, 0.044) |
0.227 |
1.04 |
| Model 1+metformin |
−0.137 (−0.258, −0.015) |
0.028 |
1.11 |
| Model 1+GLP-1RA |
−0.053 (−0.311, 0.204) |
0.683 |
1.14 |
| Model 1+sulfonylurea |
0.001 (−0.190, −0.192) |
0.990 |
1.28 |
Abbreviations as in Tables 1,2.

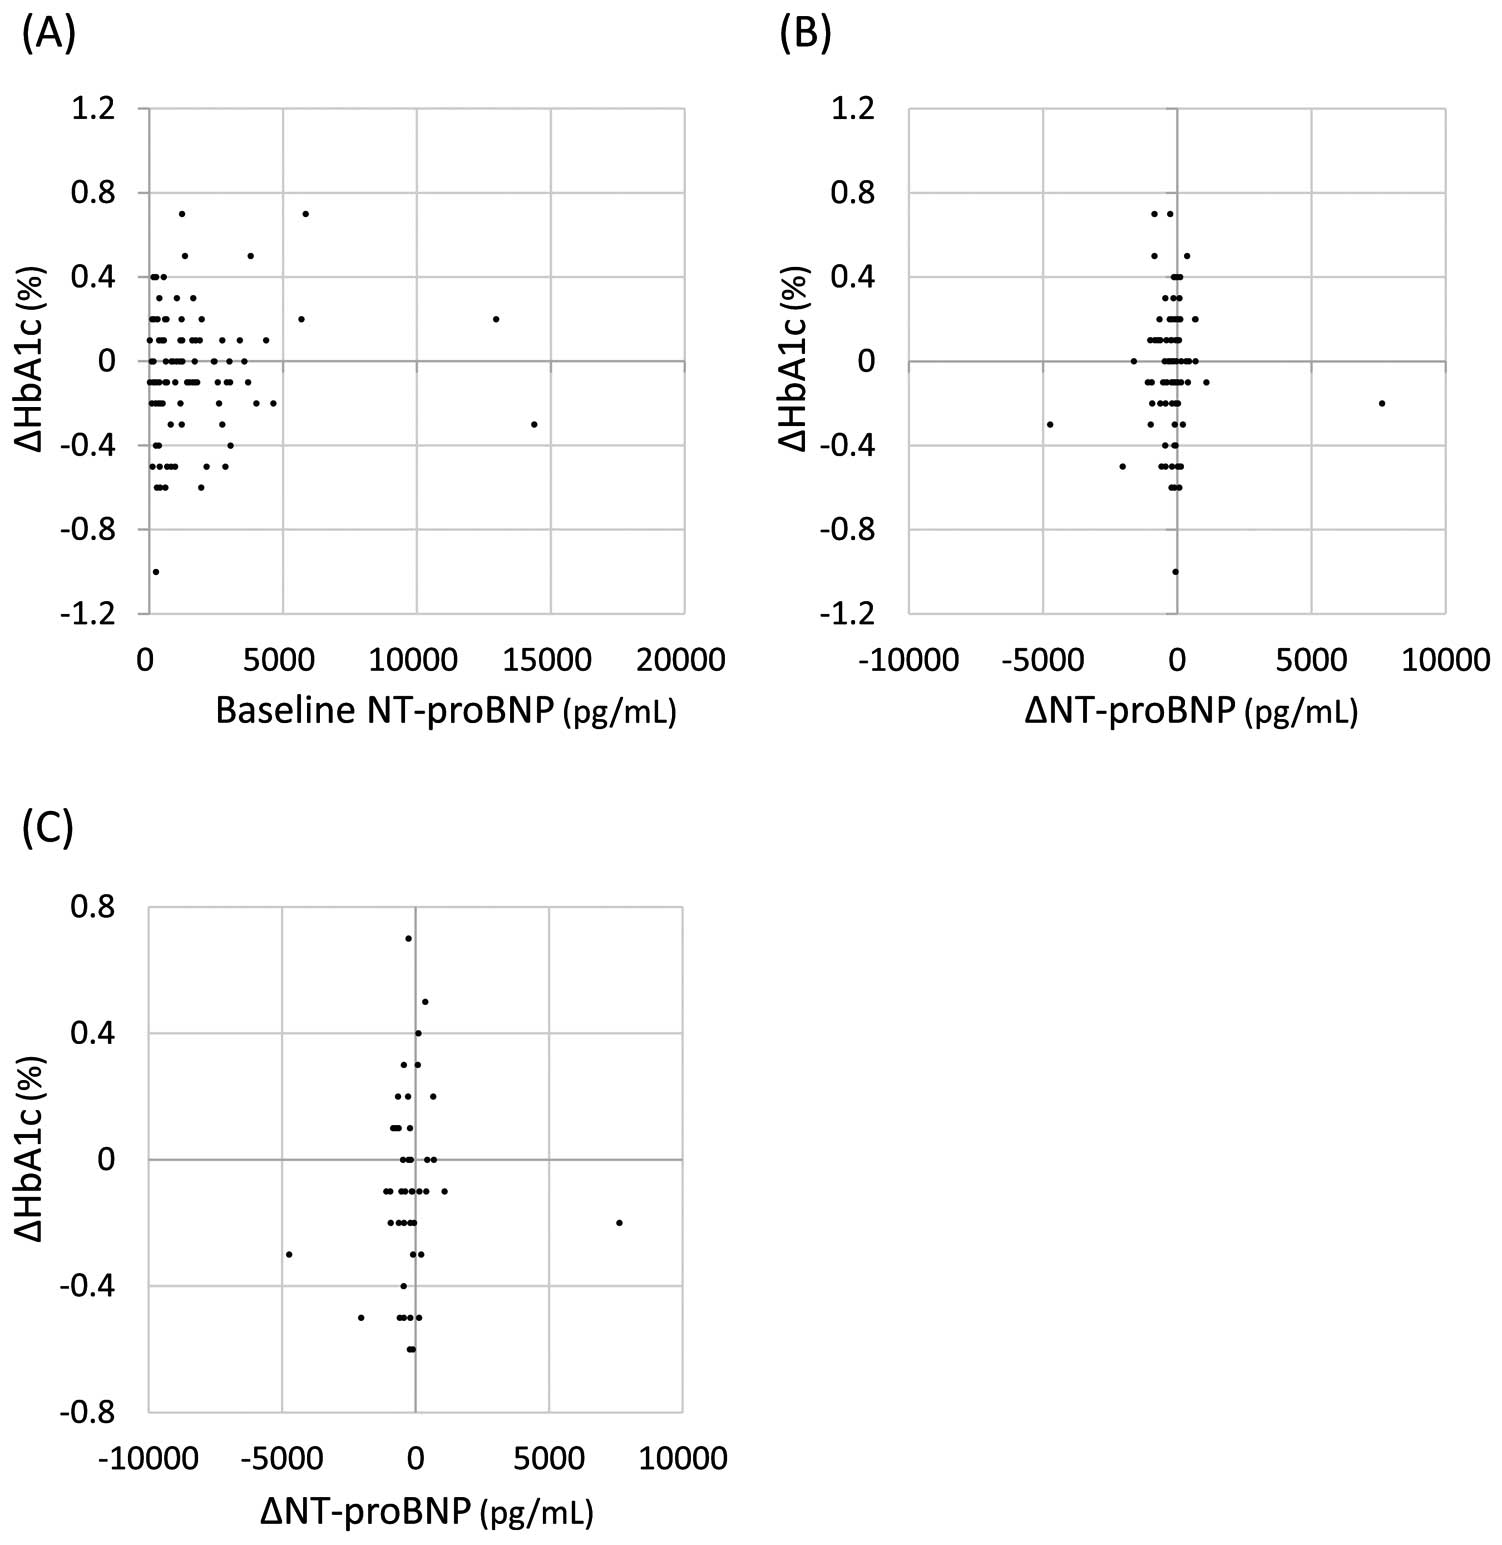
We then investigated whether there is an association between improvements in heart failure and reductions in blood glucose levels with S/V treatment. NT-proBNP was tested in 90 patients before and after S/V treatment. In these patients, S/V significantly decreased median NT-proBNP from 1,026 (IQR 377–2,095) to 618 (IQR 304–1,713) pg/mL. The degree of reduction in HbA1c was not correlated with either pretreatment NT-proBNP concentrations or changes in NT-proBNP with S/V treatment (Figure 3A,B). Even in patients with diabetes and NT-proBNP >400 pg/mL before S/V treatment (n=45), there was no association between the degree of decline in HbA1c and the degree of decline in NT-proBNP (Figure 3C).
Discussion
In the present retrospective observational single-center study, we found that 13 weeks of S/V treatment modestly but significantly improved glycemic control in patients with chronic heart failure and/or hypertension. The results of this study are consistent with the results of the post hoc analysis of the PARADIGM-HF and PARAGON-HF trials, which showed that S/V treatment significantly reduced HbA1c in patients with heart failure compared with enalapril or valsartan treatment.13,16 The median daily dose of S/V used in the present study was 200 mg (IQR 100–200 mg), with the mean dose being 163 mg, which is lower than the mean dose of 375±71 mg used in the PARADIGM-HF study,13 probably due to the short observation period (median 13 weeks) after initiation of S/V administration. The possibility that the lower dose of S/V may have contributed to the smaller HbA1c-lowering effect cannot be ruled out. However, at least in the present study, the dose of S/V was not found to be a significant independent variable for HbA1c reduction. Inhibition of neprilysin by S/V has been shown to improve glucose metabolism in preclinical studies, as well as in case studies in humans.17–20 Recently, conflicting results regarding the effects of S/V on glycemic control in heart failure patients were reported by 2 observational studies.14,15 Armentaro et al studied changes in glycemic control in 90 HFrEF patients in whom medication was switched from ACE inhibitors or ARBs to S/V.15 In that study, 1 year of S/V treatment markedly reduced HbA1c from 6.8% to 5.9%, and the reduction in HbA1c was accompanied by improvements in insulin resistance and heart failure.15 Conversely, Ryu et al reported that S/V treatment did not reduce HbA1c in 132 patients with HFrEF,14 despite baseline HbA1c levels of 6.9%, which were similar to those reported by Armentaro et al.15 The reasons for the differences between these 2 studies are not clear, but many factors may influence glycemic control over a long observation period. For example, it is presumed that changes in diet and exercise associated with improvements in heart failure and changes in medications other than S/V, such as diuretics and β-blockers, are likely to affect glycemic control.21,22 Therefore, in the present study we examined changes in HbA1c over a relatively short period of time (3–4 months) after S/V administration in patients in whom medications other than S/V had not been changed, and our results may reflect a direct effect of S/V on glycemic control. In the present study, the effectiveness of S/V in improving glycemic control was observed in patients with but not without diabetes, and the effect of S/V was more pronounced in those with poor glycemic control before S/V treatment. To date, the aforementioned study by Armentaro et al has been the only study investigating the effects of S/V on glycemic control in patients without diabetes, and that study showed that treatment with S/V for heart failure significantly improved glycemic control.15 That report did not include details of medications in the non-diabetic group, and it is therefore unclear why the results of that study differ from those of the present study.
In the US and Europe, S/V is approved only for the treatment of heart failure, and studies on the effects of S/V treatment on blood glucose have therefore been conducted in heart failure patients. It is well known that heart failure is associated with insulin resistance,23 and it has been reported that direct improvements in heart failure by left ventricular assist devices reduce blood glucose concentrations in patients with end-stage heart failure.24 Thus, in studies in heart failure patients, improvements in heart failure with S/V treatment may have affected glycemic control. Because the present study included patients with and without heart failure, it was possible to examine the effect of heart failure on improvements in blood glucose with S/V. In a multiple regression analysis of all patients, the presence of heart failure was not an explanatory factor for the decline in HbA1c (Table 2). Furthermore, there was no correlation between the degree of decline in HbA1c and the degree of decline in NT-proBNP in the 90 patients in whom NT-proBNP testing was performed, or in the patients with diabetes and a ventricular overload state (NT-proBNP >400 pg/mL) before S/V treatment (n=45; Figure 3B,C). These results rule out the possibility that the effect of S/V on glycemic control is indirect, via improvement in heart failure, at least over a short treatment period of 3–4 months.
Because most patients were switched from ARBs to S/V, the reduction in HbA1c seen in patients with diabetes may be due to inhibition of neprilysin. In fact, S/V treatment for obese hypertensive patients has been reported to improve insulin sensitivity.25 More than 50 peptides are known to be degraded by neprilysin, including glucagon-like peptide (GLP)-1, natriuretic peptide, and bradykinin.26,27 Therefore, it has been argued that inhibition of neprilysin by S/V may enhance the action of these peptides and improve blood glucose concentrations. GLP-1 is degraded not only by DPP-4, but also by neprilysin, and neprilysin inhibitors thus potentiate the actions of GLP-1.28 Indeed, 2 studies have shown that GLP-1 concentrations increase after S/V treatment.29,30 After switching from ACE inhibitors or ARBs to S/V, a consistent increase in plasma GLP-1(7–36) amide in 27 patients 3 months after the switch and increases in total amidated GLP-1 levels in 73 patients 30 and 90 days after the switch were reported.29,30 Simultaneous inhibition of DPP-4 may have a stronger effect on blood glucose levels because GLP-1 concentrations are more elevated.31,32 However, in the present study, the degree of HbA1c reduction was not significantly different in patients with diabetes taking DPP-4 inhibitors compared with those not taking DPP-4 inhibitors (data not shown), and the use of DPP-4 inhibitors was not found to be an explanatory factor for glycemic improvement in multiple regression analysis (Table 3, Model 2). Therefore, the hypoglycemic effect of increased endogenous GLP-1 concentrations due to neprilysin inhibition may not be as great as the effect of DPP-4 inhibitors. It has been reported that both atrial natriuretic peptide (ANP) and BNP are associated with the development of diabetes and that increased natriuretic peptides improve insulin sensitivity by increasing adiponectin synthesis and inducing a functional switch of white adipocytes to brown adipocytes.33 Because Nougué et al reported that ANP concentrations were increased after S/V treatment in patients with heart failure,30 an increase in natriuretic peptides following S/V treatment may have affected glycemic control in the present study.
In patients with diabetes, metformin use was found to be an explanatory factor for glycemic improvement after S/V treatment in multiple regression analysis (Table 3, Model 2). The change in HbA1c after S/V administration was greater in those using metformin than in those not using metformin (median [IQR] −0.2% [−0.5, −0.1%] vs. −0.1% [−0.2, 0.1%]; P<0.05), but HbA1c also decreased in patients with diabetes not using metformin (from 6.7% [6.4–7.0%] to 6.6% [6.3–7.0%]). Pharmacokinetic experiments have shown that both the maximum concentration of metformin in the blood (Cmax) and the area under the curve (AUC) for metformin were decreased by 23% after the combined administration of S/V and metformin for 4 days, whereas the Cmax
and AUC of S/V were unaffected.34 Furthermore, the hypoglycemic effect of dulaglutide, a GLP-1 receptor agonist, in combination with metformin has been reported to be no different than the effect of dulaglutide in combination with other oral diabetes medications.35 Therefore, we do not have a clear explanation as to why metformin promotes improvements in blood glucose levels with S/V therapy, and further investigations are warranted.
This study has several limitations. First, only patients whose HbA1c was tested before and after S/V treatment were included in the present study, which may have biased the results because these patients accounted for only approximately half the patients for whom S/V was prescribed. In particular, most patients without diabetes in whom HbA1c was measured had impaired glucose tolerance, with a median HbA1c of 5.8%. Second, blood tests were not performed during fasting because this was a retrospective, real-world clinical study. Therefore, changes in fasting glucose, insulin sensitivity, and lipid metabolism could not be examined. Conversely, we were able to confirm that S/V treatment did not affect renal function or electrolytes, such as serum potassium concentrations, as previously reported.15,36
In conclusion, treatment with S/V modestly but significantly improved glycemic control in patients with heart failure and/or hypertension, especially in those with concomitant diabetes. This favorable effect of S/V therapy on glucose metabolism is mediated by neprilysin inhibition, which is desirable in the treatment of heart failure and hypertension in patients with diabetes.
Acknowledgments
The authors thank Miho Takaya and Chieko Makino for their valuable cooperation.
Sources of Funding
This research did not receive any specific grant from funding agencies in the public, commercial, or not-for-profit sectors.
Disclosures
T.Y. has received honoraria for educational lectures from Otsuka Pharmaceutical Co., and Novartis Pharma K.K. T. Miki has received honoraria for educational lectures from Eli Lilly Japan K.K., Nippon Boehringer Ingelheim Co., Ono Pharmaceutical Co., Novo Nordisk Pharma, and Novartis Pharma K.K. All remaining authors have no financial interests to declare. The authors declare no conflicts of interest.
IRB Information
This study was approved by the Clinical Investigation Ethics Committee of Oji General Hospital (Reference no. OGH2022-17).
Data Availability
The deidentified participant data will not be shared.
References
- 1.
Iimura O. Insulin resistance and hypertension in Japanese. Hypertens Res 1996; 19(Suppl 1): S1–S8.
- 2.
Kaneko H, Yano Y, Itoh H, Morita K, Kiriyama H, Kamon T, et al. Association of blood pressure classification using the 2017 American College of Cardiology/American Heart Association blood pressure guideline with risk of heart failure and atrial fibrillation. Circulation 2021; 143: 2244–2253.
- 3.
Blood Pressure Lowering Treatment Trialists’ Collaboration. Pharmacological blood pressure lowering for primary and secondary prevention of cardiovascular disease across different levels of blood pressure: An individual participant-level data meta-analysis. Lancet 2021; 397: 1625–1636.
- 4.
McMurray JJ, Gerstein HC, Holman RR, Pfeffer MA. Heart failure: A cardiovascular outcome in diabetes that can no longer be ignored. Lancet Diabetes Endocrinol 2014; 2: 843–851.
- 5.
Leung AA, Eurich DT, Lamb DA, Majumdar SR, Johnson JA, Blackburn DF, et al. Risk of heart failure in patients with recent-onset type 2 diabetes: Population-based cohort study. J Card Fail 2009; 15: 152–157.
- 6.
Gerstein HC, Swedberg K, Carlsson J, McMurray JJV, Michelson EL, Olofsson B, et al. The hemoglobin A1c level as a progressive risk factor for cardiovascular death, hospitalization for heart failure, or death in patients with chronic heart failure: An analysis of the candesartan in heart failure: Assessment of reduction in mortality and morbidity (CHARM) program. Arch Intern Med 2008; 168: 1699–1704.
- 7.
Stratton IM, Adler AI, Neil HA, Matthews DR, Manley SE, Cull CA, et al. Association of glycaemia with macrovascular and microvascular complications of type 2 diabetes (UKPDS 35): Prospective observational study. BMJ 2000; 321: 405–412.
- 8.
Lind M, Olsson M, Rosengren A, Svensson AM, Bounias I, Gudbjörnsdottir S. The relationship between glycaemic control and heart failure in 83,021 patients with type 2 diabetes. Diabetologia 2012; 55: 2946–2953.
- 9.
McMurray JJV, Packer M, Desai AS, Gong J, Lefkowitz MP, Rizkala AR, et al. Angiotensin-neprilysin inhibition versus enalapril in heart failure. N Engl J Med 2014; 371: 993–1004.
- 10.
Tsutsui H, Ide T, Ito H, Kihara Y, Kinugawa K, Kinugawa S, et al; on behalf of the Japanese Circulation Society and the Japanese Heart Failure Society Joint Working Group. JCS/JHFS 2021 guideline focused update on diagnosis and treatment of acute and chronic heart failure. Circ J 2021; 85: 2252–2291.
- 11.
McDonagh TA, Metra M, Adamo M, Gardner RS, Baumbach A, Böhm M, et al. 2021 ESC guidelines for the diagnosis and treatment of acute and chronic heart failure: Developed by the Task Force for the Diagnosis and Treatment of Acute and Chronic Heart Failure of the European Society of Cardiology (ESC) with the special contribution of the Heart Failure Association (HFA) of the ESC. Eur J Heart Fail 2022; 24: 4–131.
- 12.
Heidenreich PA, Bozkurt B, Aguilar D, Allen LA, Byun JJ, Colvin MM, et al. 2022 AHA/ACC/HFSA guideline for the management of heart failure: A report of the American College of Cardiology/American Heart Association joint committee on clinical practice guidelines. Circulation 2022; 145: e895–e1032.
- 13.
Seferovic JP, Claggett B, Seidelmann SB, Seely EW, Packer M, Zile MR, et al. Effect of sacubitril/valsartan versus enalapril on glycaemic control in patients with heart failure and diabetes: A post-hoc analysis from the PARADIGM-HF trial. Lancet Diabetes Endocrinol 2017; 5: 333–340.
- 14.
Ryu R, Tran H, Bahjri K. Association of sacubitril/valsartan with metabolic parameters in patients with reduced ejection fraction heart failure at a multidisciplinary clinic. Metab Syndr Relat Disord 2021; 19: 115–118.
- 15.
Armentaro G, D’Arrigo G, Miceli S, Cassano V, Perticone M, Maio R, et al. Long term metabolic effects of sacubitril/valsartan in non-diabetic and diabetic patients with heart failure reduced ejection fraction: A real life study. Front Physiol 2022; 13: 897109.
- 16.
Wijkman MO, Claggett B, Vaduganathan M, Cunningham JW, Rørth R, Jackson A, et al. Effects of sacubitril/valsartan on glycemia in patients with diabetes and heart failure: The PARAGON-HF and PARADIGM-HF trials. Cardiovasc Diabetol 2022; 21: 110.
- 17.
Esser N, Mongovin SM, Parilla J, Barrow BM, Mundinger TO, Fountaine BS, et al. Neprilysin inhibition improves intravenous but not oral glucose-mediated insulin secretion via GLP-1R signaling in mice with β-cell dysfunction. Am J Physiol Endocrinol Metab 2022; 322: E307–E318.
- 18.
Mahtani K, Patel B, Wang B, Barron A. Activation of GLP-1 receptor signalling by sacubitril/valsartan: Implications for patients with poor glycaemic control. Int J Cardiol 2022; 367: 81–89.
- 19.
Gamarra E, Baffoni C, Borretta G, Feola M, Tassone F. Reduction of insulin requirement after starting treatment with sacubitril/valsartan in a patient with diabetes treated with continuous subcutaneous insulin infusion (CSII): A case report. J Diabetes Sci Technol 2018; 12: 1254–1255.
- 20.
Kashiwagi Y, Nagoshi T, Ogawa K, Kawai M, Yoshimura M. Heart failure treatments such as angiotensin receptor/neprilysin inhibitor improve heart failure status and glucose metabolism. Cureus 2022; 14: e22762.
- 21.
Rizos CV, Elisaf MS. Antihypertensive drugs and glucose metabolism. World J Cardiol 2014; 6: 517–530.
- 22.
Bell DSH, Goncalves E. Diabetogenic effects of cardioprotective drugs. Diabetes Obes Metab 2021; 23: 877–885.
- 23.
Aroor AR, Mandavia CH, Sowers JR. Insulin resistance and heart failure: Molecular mechanisms. Heart Fail Clin 2012; 8: 609–617.
- 24.
Patel N, Gluck JA, Radojevic J, Coleman CI, Baker WL. Left ventricular assist device implantation improves glycaemic control: A systematic review and meta-analysis. ESC Heart Fail 2018; 5: 1141–1149.
- 25.
Jordan J, Stinkens R, Jax T, Engeli S, Blaak EE, May M, et al. Improved insulin sensitivity with angiotensin receptor neprilysin inhibition in individuals with obesity and hypertension. Clin Pharmacol Ther 2017; 101: 254–263.
- 26.
Campbell DJ. Long-term neprilysin inhibition – implications for ARNIs. Nat Rev Cardiol 2017; 14: 171–186.
- 27.
Seferovic JP, Solomon SD, Seely EW. Potential mechanisms of beneficial effect of sacubitril/valsartan on glycemic control. Ther Adv Endocrinol Metab 2020; 11: 1–9.
- 28.
Plamboeck A, Holst JJ, Carr RD, Deacon CF. Neutral endopeptidase 24.11 and dipeptidyl peptidase IV are both mediators of the degradation of glucagon-like peptide 1 in the anaesthetised pig. Diabetologia 2005; 48: 1882–1890.
- 29.
Vodovar N, Nougué H, Launay JM, Solal AC, Logeart D. Sacubitril/valsartan in PARADIGM-HF. Lancet Diabetes Endocrinol 2017; 5: 495–496.
- 30.
Nougué H, Pezel T, Picard F, Sadoune M, Arrigo M, Beauvais F, et al. Effects of sacubitril/valsartan on neprilysin targets and the metabolism of natriuretic peptides in chronic heart failure: A mechanistic clinical study. Eur J Heart Fail 2019; 21: 598–605.
- 31.
Willard JR, Barrow BM, Zraika S. Improved glycaemia in high-fat-fed neprilysin-deficient mice is associated with reduced DPP-4 activity and increased active GLP-1 levels. Diabetologia 2017; 60: 701–708.
- 32.
Wewer Albrechtsen NJ, Mark PD, Terzic D, Hansen LH, Andersen UØ, Hartmann B, et al. Sacubitril/valsartan augments postprandial plasma concentrations of active GLP-1 when combined with sitagliptin in men. J Clin Endocrinol Metab, doi:10.1210/jc.2019-00515.
- 33.
Schlueter N, de Sterke A, Willmes DM, Spranger J, Jordan J, Birkenfeld AL. Metabolic actions of natriuretic peptides and therapeutic potential in the metabolic syndrome. Pharmacol Ther 2014; 144: 12–27.
- 34.
Gan L, Jiang X, Mendonza A, Swan T, Reynolds C, Nguyen J, et al. Pharmacokinetic drug–drug interaction assessment of LCZ696 (an angiotensin receptor neprilysin inhibitor) with omeprazole, metformin or levonorgestrel-ethinyl estradiol in healthy subjects. Clin Pharmacol Drug Dev 2016; 5: 27–39.
- 35.
Emoto M, Terauchi Y, Ozeki A, Oura T, Takeuchi M, Imaoka T. A 1-year safety study of dulaglutide in Japanese patients with type 2 diabetes on a single oral hypoglycemic agent: An open-label, nonrandomized, phase 3 trial. Endocr J 2015; 62: 1101–1114.
- 36.
Feng Y, Yin Y, Deng R, Li H. Renal safety and efficacy of angiotensin receptor-neprilysin inhibitor: A meta-analysis of randomized controlled trials. J Clin Pharm Ther 2020; 45: 1235–1243.