Abstract
Background: The All Nippon Atrial Fibrillation In the Elderly Registry provides real-world insights into non-valvular atrial fibrillation (NVAF) in >30,000 elderly Japanese patients (aged ≥75 years), including >2,000 nonagenarians. We aimed to investigate outcomes in these patients by age and oral anticoagulant (OAC) type.
Methods and Results: This prospective, multicenter, observational, cohort, 2-year follow-up study included elderly patients with NVAF who were able to attend hospital visits. The incidences of stroke/systemic embolic events (SEE), major bleeding, intracranial hemorrhage (ICH), cardiovascular death, all-cause death, and major adverse cardiovascular or neurological events (MACNE) were evaluated by age. Incidence rates increased significantly with age. Stroke/SEE, major bleeding, and ICH incidences plateaued in patients aged ≥90 years. Direct OACs (DOACs) yielded a numerically lower event incidence vs. warfarin in all age groups and endpoints, except for major bleeding in patients aged ≥90 years. DOACs (vs. warfarin) were significantly associated with a lower risk of stroke/SEE, major bleeding, and ICH in the ≥80–<85 years group, and reduced cardiovascular and all-cause death in the ≥75–<80 years group. In the ≥90 years subgroup, major bleeding history was a risk factor for all-cause death.
Conclusions: Although DOAC vs. warfarin offers potential benefits for stroke prevention, limitations occurred in reducing major bleeding among those aged ≥90 years, indicating a potential benefit of very-low-dose DOAC for this demographic.
Atrial fibrillation (AF) predominantly affects elderly patients, with both its prevalence and incidence increasing with age. In the USA, the prevalence of AF among the general population aged ≥85 years is reported to be 9.1% in men and 11.1% in women.1 In Japan, for those aged ≥80 years, the prevalence is 2% for men and 4% for women.2
Stroke prevention is paramount in managing AF, necessitating the long-term use of oral anticoagulants (OACs). The risk of stroke escalates with aging, significantly so in very elderly patients with AF.3,4 However, the use of OACs comes with an increased risk of bleeding, a risk that also increases with age, particularly in very elderly individuals.5
Evidence from randomized controlled trials (RCTs) indicates that warfarin decreases the risk of stroke/systemic embolic events (SEE) by 67% compared with placebo or control,6 and that direct oral antagonist (DOAC) similary decreases it as compared with warfarin.7 More recently, a study has shown that very low-dose DOAC use reduces stroke/SEE by 66% compared with placebo in very elderly AF patients (aged ≥80 years) with high bleeding risks, with a non-significant increase in major bleeding.8
In real-world clinical practice, a meta-analysis showed that anticoagulation in octogenarians and nonagenarians with AF was not associated with a reduced risk of thromboembolism or an increased risk of major bleeding.9 However, it is important to note that significant heterogeneity was detected in the analysis,9 possibly reflecting variations in patient populations and medical circumstances. Specifically regarding medical circumstances, the heterogeneity could stem from the emergence of DOACs and the subsequent increase in OAC prescription rates.
The All Nippon Atrial Fibrillation In the Elderly (ANAFIE) Registry provides real-world evidence on non-valvular AF (NVAF) among elderly Japanese patients, comprising over 30,000 patients aged ≥75 years. A 2-year analysis of patients in the ANAFIE Registry reported on the effectiveness and safety of OACs, particularly DOACs, in NVAF patients aged ≥75 years.10 This registry is unique in that it includes over 8,000 patients with NVAF aged ≥85 years, with approximately 90% receiving OACs, predominantly DOACs. The baseline characteristics of these patients, segmented by age, noting that the OAC prescription rate was over 90% among patients aged <90 years and nearly 90% among those aged ≥90 years, have already been reported.11 In this subanalysis of the ANAFIE Registry, our aim is to provide an overview of clinical outcomes according to age categories and types of OACs in elderly patients with NVAF, with a special focus on those aged ≥90 years with a high rate of OAC prescription.
Methods
Study Design
The ANAFIE Registry was a multicenter, prospective, cohort study conducted at 1,273 sites across Japan between 2016 and 2020.10 Details of the study design, rationale, and baseline data have been published previously.12,13 The study complied with the Declaration of Helsinki, local requirements for registries, and ethics committee approvals. Written informed consent was obtained from patients or family members in case of communication disorders (i.e., aphasia) or cognitive impairment. The study was registered at the UMIN Clinical Trials Registry under identifier UMIN000024006.
Patients
Enrolled outpatients were men and women aged ≥75 years, diagnosed with NVAF using an electrocardiogram, who were able to attend hospital visits. Patients were excluded from enrollment if: they were participating or planning to participate in an interventional study; they had a definite diagnosis of mitral stenosis, artificial heart valve replacement (either mechanical or tissue valve prostheses), or had presented very recently with cardiovascular (CV) events, including stroke, myocardial infarction, cardiac intervention, heart failure requiring hospitalization, or any bleeding leading to hospitalization within 1 month before enrollment; their life expectancy was <1 year; or their participation was deemed inappropriate by treating physicians.
The definitions of standard dose, overdose, reduced dose, underdose, or off-label underdose have been described previously.14,15 An ‘appropriate’ DOAC dose was a dose that complied with the on-label standard or reduced dose regimen. ‘Under-dosing’ was defined as administering a reduced dose of DOAC despite the standard dose criteria being fulfilled. ‘Over-dosing’ was defined as administering a standard dose of DOAC despite a patient fulfilling the reduced dose regimen criteria. ‘Off-label dosing’ was defined as administering a dose lower than the reduced dose. The standard dose was the prescribed dose for patients as per the product package insert for the standard dose.15
Study Endpoints
ANAFIE Registry endpoints were the incidence of stroke/SEE, major bleeding, intracranial hemorrhage (ICH), CV death, all-cause death, and major adverse CV or neurological events (MACNE). MACNE is a composite of CV death, stroke, SEE, and myocardial infarction.16
Statistical Analysis
First, patients were stratified by age into 6 groups (≥75–<80, ≥80–<85, ≥85–<90, ≥90–<95, ≥95–<100, and ≥100 years) to describe background patient characteristics, the incidence rate of clinical events, and the cause of death. The incidence rate per 100 person-years and the 95% confidence interval (CI) of each clinical event were estimated.
Second, patients were stratified by age into 4 groups (≥75–<80, ≥80–<85, ≥85–<90, and ≥90 years) for detailed statistical analysis, due to the low number of patients aged ≥95–<100 years and ≥100 years. The probability of event occurrence was estimated using the Kaplan-Meier method. Hazard ratios (HRs) were calculated using the Cox proportional hazards model adjusted by prognostic factors (sex, body mass index [BMI], history of major bleeding, type of AF, systolic blood pressure, severe hepatic disease, diabetes, hyperuricemia, heart failure and/or reduced left ventricular ejection fraction, myocardial infarction, cerebrovascular disease, thromboembolic disease, active cancer, dementia, fall within 1 year, anticoagulants, history of catheter ablation, creatinine clearance (CCr), digestive diseases, polypharmacy [≥5 drugs], and use of antiarrhythmic drugs, anti-platelet agents, proton-pump inhibitors, P-glycoprotein inhibitors, and antihyperlipidemia drugs). The Cox proportional hazards model was used to obtain the respective HRs for each age category (≥75–<80 years as reference) and for DOACs and no OACs (warfarin as reference) in each age category.
Third, risk factors associated with each clinical outcome were evaluated among patients aged ≥90 years using the Cox proportional hazards model adjusted using similar prognostic factors.
Statistical tests were 2 sided with a 5% significance level. The statistical software used for these analyses was SAS (version 9.4; SAS Institute, Tokyo, Japan).
Results
Patient Characteristics and Study Endpoints in 5-Year Segmented Age Categories
In total, 32,275 patients were analyzed in the ANAFIE Registry and stratified into 6 age groups: ≥75–<80 (40.0%), ≥80–<85 (34.0%), ≥85–<90 (19.5%), ≥90–<95 (5.7%), ≥95–<100 (0.8%), and ≥100 (0.03%) years.
The main characteristics of patients at baseline by age group are shown in Table 1. Patients in older age subgroups were more likely to be female, have low BMI, have low CCr, and have non-paroxysmal AF. In addition, comorbidities such as kidney disease, heart failure/left ventricular dysfunction, cerebrovascular disease, dementia, and falls within 1 year were more common in older age subgroups.
Table 1.
Background Patient Characteristics by Age Group
| |
Overall
(N=32,275) |
Years |
Trend
P value* |
≥75–<80
(n=12,895) |
≥80–<85
(n=10,961) |
≥85–<90
(n=6,295) |
≥90–<95
(n=1,848) |
≥95–<100
(n=265) |
≥100
(n=11) |
| Male |
18,482 (57.3) |
8,171 (63.4) |
6,374 (58.2) |
3,086 (49.0) |
765 (41.4) |
85 (32.1) |
1 (9.1) |
<0.001 |
| Age (years) |
81.5±4.8 |
76.9±1.4 |
81.8±1.4 |
86.7±1.4 |
91.4±1.3 |
96.1±1.2 |
100.8±1.1 |
– |
| BMI (kg/m2) |
23.3±3.6 |
23.8±3.5 |
23.4±3.6 |
22.7±3.4 |
22.2±3.4 |
21.3±3.1 |
21.8±2.5 |
<0.001 |
| SBP (mmHg) |
127.4±17.0 |
127.5±16.5 |
127.3±17.0 |
127.4±17.7 |
126.8±17.9 |
125.4±19.2 |
132.8±23.6 |
0.048 |
| DBP (mmHg) |
70.6±11.6 |
71.9±11.4 |
70.3±11.4 |
69.5±12.0 |
68.2±12.0 |
67.1±11.7 |
72.8±14.2 |
<0.001 |
Creatinine clearance
(mL/min) |
48.4±18.2 |
56.7±17.0 |
47.6±17.7 |
38.8±13.5 |
31.7±11.6 |
26.5±10.2 |
18.7±8.2 |
<0.001 |
| CHADS2 score |
2.9±1.2 |
2.8±1.2 |
2.9±1.2 |
3.0±1.2 |
3.0±1.2 |
3.1±1.2 |
2.7±1.2 |
<0.001 |
CHA2DS2-VASc
score |
4.5±1.4 |
4.3±1.4 |
4.5±1.4 |
4.6±1.4 |
4.8±1.4 |
5.0±1.4 |
4.7±1.5 |
<0.001 |
| HAS-BLED score |
1.9±0.9 |
1.8±0.8 |
1.9±0.9 |
1.9±0.9 |
1.9±0.9 |
1.9±0.9 |
1.9±0.7 |
<0.001 |
History of major
bleeding |
1,439 (4.5) |
552 (4.3) |
515 (4.7) |
282 (4.5) |
79 (4.3) |
10 (3.8) |
1 (9.1) |
0.664 |
| AF type |
| Paroxysmal |
13,586 (42.1) |
5,792 (44.9) |
4,550 (41.5) |
2,497 (39.7) |
669 (36.2) |
76 (28.7) |
2 (18.2) |
<0.001 |
| Persistent |
5,336 (16.5) |
2,095 (16.2) |
1,789 (16.3) |
1,062 (16.9) |
329 (17.8) |
57 (21.5) |
4 (36.4) |
– |
| Permanent |
13,353 (41.4) |
5,008 (38.8) |
4,622 (42.2) |
2,736 (43.5) |
850 (46.0) |
132 (49.8) |
5 (45.5) |
– |
History of non-
pharmacological
therapy for AF |
5,677 (17.6) |
2,806 (21.8) |
1,755 (16.0) |
846 (13.4) |
238 (12.9) |
31 (11.7) |
1 (9.1) |
<0.001 |
| Catheter ablation |
2,970 (9.2) |
1,888 (14.6) |
841 (7.7) |
212 (3.4) |
27 (1.5) |
2 (0.8) |
0 (0.0) |
<0.001 |
Electrical
defibrillation |
715 (2.2) |
352 (2.7) |
247 (2.3) |
98 (1.6) |
17 (0.9) |
1 (0.4) |
0 (0.0) |
<0.001 |
| Pacemaker |
2,358 (7.3) |
753 (5.8) |
796 (7.3) |
584 (9.3) |
196 (10.6) |
28 (10.6) |
1 (9.1) |
<0.001 |
| Comorbidities |
| Hypertension |
24,312 (75.3) |
9,474 (73.5) |
8,364 (76.3) |
4,848 (77.0) |
1,429 (77.3) |
190 (71.7) |
7 (63.6) |
<0.001 |
| Diabetes |
8,733 (27.1) |
3,689 (28.6) |
3,084 (28.1) |
1,551 (24.6) |
359 (19.4) |
49 (18.5) |
1 (9.1) |
<0.001 |
| Dyslipidemia |
13,728 (42.5) |
5,778 (44.8) |
4,653 (42.5) |
2,585 (41.1) |
642 (34.7) |
67 (25.3) |
3 (27.3) |
<0.001 |
Chronic kidney
disease |
6,705 (20.8) |
2,147 (16.6) |
2,246 (20.5) |
1,657 (26.3) |
574 (31.1) |
77 (29.1) |
4 (36.4) |
<0.001 |
Myocardial
infarction |
1,851 (5.7) |
747 (5.8) |
599 (5.5) |
386 (6.1) |
104 (5.6) |
14 (5.3) |
1 (9.1) |
0.758 |
| Angina |
5,521 (17.1) |
2,029 (15.7) |
1,957 (17.9) |
1,160 (18.4) |
334 (18.1) |
39 (14.7) |
2 (18.2) |
<0.001 |
| HF |
12,277 (38.0) |
4,063 (31.5) |
4,158 (37.9) |
2,879 (45.7) |
1,003 (54.3) |
168 (63.4) |
6 (54.5) |
<0.001 |
Cerebrovascular
disease |
7,303 (22.6) |
2,725 (21.1) |
2,501 (22.8) |
1,506 (23.9) |
493 (26.7) |
75 (28.3) |
3 (27.3) |
<0.001 |
| Dementia |
2,512 (7.8) |
448 (3.5) |
807 (7.4) |
811 (12.9) |
366 (19.8) |
73 (27.5) |
7 (63.6) |
<0.001 |
Polypharmacy
(no. drugs) |
6.6±3.2 |
6.2±3.2 |
6.7±3.2 |
7.1±3.1 |
7.3±3.1 |
7.0±2.9 |
6.5±3.5 |
<0.001 |
| Fall within 1 year |
2,347 (7.3) |
673 (5.2) |
767 (7.0) |
624 (9.9) |
237 (12.8) |
43 (16.2) |
3 (27.3) |
<0.001 |
| OAC therapy |
29,830 (92.4) |
12,002 (93.1) |
10,236 (93.4) |
5,748 (91.3) |
1,624 (87.9) |
214 (80.8) |
6 (54.5) |
<0.001 |
| DOACs |
21,585 (72.4) |
9,009 (75.1) |
7,369 (72.0) |
4,004 (69.7) |
1,068 (65.8) |
132 (61.7) |
3 (50.0) |
<0.001 |
| Standard dose |
3,826 (17.7) |
2,808 (31.2) |
852 (11.6) |
151 (3.8) |
14 (1.3) |
1 (0.8) |
0 (0.0) |
– |
| Overdose |
698 (3.2) |
271 (3.0) |
313 (4.2) |
94 (2.3) |
16 (1.5) |
4 (3.0) |
0 (0.0) |
– |
| Reduced dose |
9,548 (44.2) |
2,413 (26.8) |
3,758 (51.0) |
2,553 (63.8) |
732 (68.5) |
91 (68.9) |
1 (33.3) |
– |
| Underdose |
3,630 (16.8) |
2,003 (22.2) |
1,159 (15.7) |
401 (10.0) |
63 (5.9) |
4 (3.0) |
0 (0.0) |
– |
Off-label
underdose |
795 (3.7) |
204 (2.3) |
251 (3.4) |
228 (5.7) |
101 (9.5) |
11 (8.3) |
0 (0.0) |
– |
| Warfarin |
8,233 (27.6) |
2,986 (24.9) |
2,863 (28.0) |
1,743 (30.3) |
556 (34.2) |
82 (38.3) |
3 (50.0) |
<0.001 |
| PT-INR |
2.0±0.4 |
2.0±0.4 |
2.0±0.4 |
1.9±0.4 |
1.9±0.4 |
1.9±0.4 |
1.9±0.3 |
<0.001 |
| TTR (%) |
75.5±29.8 |
77.8±28.3 |
75.8±29.6 |
73.4±30.9 |
69.3±32.7 |
68.5±37.0 |
63.1±41.5 |
<0.001 |
Data are presented as n (%) or mean±SD. *Trend P values are calculated for 4 groups (≥75–<80, ≥80–<85, ≥85–<90, and ≥90 years). AF, atrial fibrillation; BMI, body mass index; DBP, diastolic blood pressure; DOAC, direct oral anticoagulant; HF, heart failure; OAC, oral anticoagulant; SBP, systolic blood pressure; PT-INR, prothrombin time international normalized ratio; TTR, time in the therapeutic range.
Anticoagulant prescription rates were >90% for those aged <90 years and 86.8% for those aged ≥90 years (≥90–<95 years, 87.9%; ≥95–<100 years, 80.8%; and ≥100 years, 54.5%). Prescription rates for DOACs exceeded those for warfarin in all age groups except age ≥100 years. Additionally, with increasing age, the proportion of DOACs decreased, and that of warfarin increased.
These patients were followed up for a mean duration of 1.88 years and the incidence rates of all clinical events increased with age (Table 2). Details of the causes of death are described in Table 3. The rate of non-hemorrhagic CV death was similar among age groups (i.e., 24.8% in those aged ≥75–<80 years, 23.7% in ≥80–<85 years, 26.6% in ≥85–<90 years, and 27.8% in ≥90 years). Heart failure-related deaths were the most common among CV deaths overall. Older age was associated with a lower proportion of malignant tumor-related deaths and a higher proportion of deaths from other causes, such as infection.
Table 2.
Incidence Rates of Events by Age Group
| Event |
Overall |
≥75–<80 years |
≥80–<85 years |
≥85–<90 years |
≥90–<95 years |
≥95–<100 years |
≥100 years |
| N (%) |
Per 100
person-years
(95% CI) |
n (%) |
Per 100
person-years
(95% CI) |
n (%) |
Per 100
person-years
(95% CI) |
n (%) |
Per 100
person-years
(95% CI) |
n (%) |
Per 100
person-years
(95% CI) |
n (%) |
Per 100
person-years
(95% CI) |
n (%) |
Per 100
person-years
(95% CI) |
| Stroke/SEE |
970 (3.0) |
1.62
(1.52–1.73) |
308 (2.4) |
1.26
(1.12–1.40) |
333 (3.0) |
1.64
(1.46–1.82) |
244 (3.9) |
2.15
(1.88–2.42) |
78 (4.2) |
2.43
(1.89–2.97) |
6 (2.3) |
1.39
(0.28–2.51) |
1 (9.1) |
7.33
(0.00–21.70) |
| Major bleeding |
645 (2.0) |
1.08
(0.99–1.16) |
198 (1.5) |
0.81
(0.70–0.92) |
232 (2.1) |
1.14
(0.99–1.28) |
167 (2.7) |
1.46
(1.24–1.68) |
47 (2.5) |
1.45
(1.04–1.87) |
1 (0.4) |
0.23
(0.00–0.68) |
0 (0.0) |
0.00
(0.00–0.00) |
| ICH |
453 (1.4) |
0.75
(0.68–0.82) |
150 (1.2) |
0.61
(0.51–0.71) |
155 (1.4) |
0.76
(0.64–0.88) |
115 (1.8) |
1.00
(0.82–1.19) |
32 (1.7) |
0.99
(0.65–1.33) |
1 (0.4) |
0.23
(0.00–0.68) |
0 (0.0) |
0.00
(0.00–0.00) |
| CV death |
654 (2.0) |
1.08
(1.00–1.17) |
137 (1.1) |
0.56
(0.46–0.65) |
194 (1.8) |
0.94
(0.81–1.08) |
200 (3.2) |
1.74
(1.49–1.98) |
96 (5.2) |
2.94
(2.36–3.53) |
25 (9.4) |
5.71
(3.47–7.95) |
2 (18.2) |
14.63
(0.00–34.90) |
| All-cause death |
2,242 (7.0) |
3.71
(3.56–3.87) |
476 (3.7) |
1.93
(1.76–2.11) |
691 (6.3) |
3.36
(3.11–3.61) |
672 (10.7) |
5.83
(5.39–6.27) |
313 (16.9) |
9.60
(8.54–10.66) |
83 (31.3) |
18.95
(14.88–23.03) |
7 (63.6) |
51.20
(13.27–89.12) |
| MACNE |
1,535 (4.8) |
2.57
(2.45–2.70) |
434 (3.4) |
1.78
(1.61–1.95) |
507 (4.6) |
2.50
(2.28–2.72) |
403 (6.4) |
3.55
(3.21–3.90) |
158 (8.6) |
4.93
(4.16–5.69) |
31 (11.7) |
7.19
(4.66–9.73) |
2 (18.2) |
14.66
(0.00–34.98) |
CI, confidence interval; CV, cardiovascular; ICH, intracranial hemorrhage; MACNE, major adverse cardiovascular or neurological event; SEE, systemic embolic event.
Table 3.
Summary of Causes of Death by Age Group
| Cause of death |
Years |
| ≥75–<80 |
≥80–<85 |
≥85–<90 |
≥90 |
≥90–<95 |
≥95–<100 |
≥100 |
| No. deaths |
476 |
691 |
672 |
403 |
313 |
83 |
7 |
| Hemorrhagic |
31 (6.5) |
53 (7.7) |
52 (7.7) |
18 (4.5) |
16 (5.1) |
2 (2.4) |
0 (0.0) |
| Intracranial hemorrhage |
17 (3.6) |
28 (4.1) |
28 (4.2) |
11 (2.7) |
11 (3.5) |
0 (0.0) |
0 (0.0) |
Bleeding death other than
intracranial hemorrhage |
14 (2.9) |
25 (3.6) |
24 (3.6) |
7 (1.7) |
5 (1.6) |
2 (2.4) |
0 (0.0) |
| Non-hemorrhagic CV |
118 (24.8) |
164 (23.7) |
179 (26.6) |
112 (27.8) |
85 (27.2) |
25 (30.1) |
2 (28.6) |
| Cerebral infarction |
20 (4.2) |
27 (3.9) |
28 (4.2) |
10 (2.5) |
9 (2.9) |
0 (0.0) |
1 (14.3) |
| Systemic embolism |
2 (0.4) |
1 (0.1) |
2 (0.3) |
0 (0.0) |
0 (0.0) |
0 (0.0) |
0 (0.0) |
| All HF, cardiac arrest |
53 (11.1) |
69 (10.0) |
86 (12.8) |
57 (14.1) |
41 (13.1) |
16 (19.3) |
0 (0.0) |
| Cardiac intervention |
0 (0.0) |
0 (0.0) |
0 (0.0) |
0 (0.0) |
0 (0.0) |
0 (0.0) |
0 (0.0) |
| Arrhythmia |
0 (0.0) |
0 (0.0) |
4 (0.6) |
0 (0.0) |
0 (0.0) |
0 (0.0) |
0 (0.0) |
| Pulmonary embolism |
0 (0.0) |
2 (0.3) |
1 (0.1) |
0 (0.0) |
0 (0.0) |
0 (0.0) |
0 (0.0) |
| Cardiac sudden death |
23 (4.8) |
46 (6.7) |
38 (5.7) |
31 (7.7) |
23 (7.3) |
7 (8.4) |
1 (14.3) |
Atherosclerotic disease other
than CADs |
0 (0.0) |
0 (0.0) |
0 (0.0) |
0 (0.0) |
0 (0.0) |
0 (0.0) |
0 (0.0) |
| Other CV diseases |
20 (4.2) |
19 (2.7) |
20 (3.0) |
14 (3.5) |
12 (3.8) |
2 (2.4) |
0 (0.0) |
| Cancer |
106 (22.3) |
129 (18.7) |
99 (14.7) |
26 (6.5) |
20 (6.4) |
6 (7.2) |
0 (0.0) |
| Other |
221 (46.4) |
345 (49.9) |
342 (50.9) |
247 (61.3) |
192 (61.3) |
50 (60.2) |
5 (71.4) |
| Infectious diseases |
68 (14.3) |
122 (17.7) |
112 (16.7) |
81 (20.1) |
67 (21.4) |
14 (16.9) |
0 (0.0) |
| Hepatobiliary system |
3 (0.6) |
6 (0.9) |
1 (0.1) |
0 (0.0) |
0 (0.0) |
0 (0.0) |
0 (0.0) |
| Renal disease |
11 (2.3) |
10 (1.4) |
18 (2.7) |
14 (3.5) |
11 (3.5) |
2 (2.4) |
1 (14.3) |
| Suicide |
2 (0.4) |
0 (0.0) |
2 (0.3) |
1 (0.2) |
0 (0.0) |
1 (1.2) |
0 (0.0) |
| Accidents and trauma |
0 (0.0) |
2 (0.3) |
1 (0.1) |
0 (0.0) |
0 (0.0) |
0 (0.0) |
0 (0.0) |
| Others |
137 (28.8) |
205 (29.7) |
208 (31.0) |
151 (37.5) |
114 (36.4) |
33 (39.8) |
4 (57.1) |
Data presented as n (%), unless otherwise specified. CAD, coronary artery disease; CV, cardiovascular; HF, heart failure.
Cox Proportional Models for Study Endpoints by Age and OAC Types
Patients were stratified into 4 age groups (≥75–<80, ≥80–<85, ≥85–<90, and ≥90 years) for further analysis of the study endpoints. Kaplan-Meier curves estimating the probability of events showed that the 2-year event probability was significantly higher for all events with increasing age (log-rank P<0.001 for all; Figure 1). Multivariate analysis using those aged ≥75–<80 years as the reference group showed that the risk of all events (i.e., stroke/SEE, CV death, all-cause death, and MACNE) increased significantly with increasing age (Figure 2).

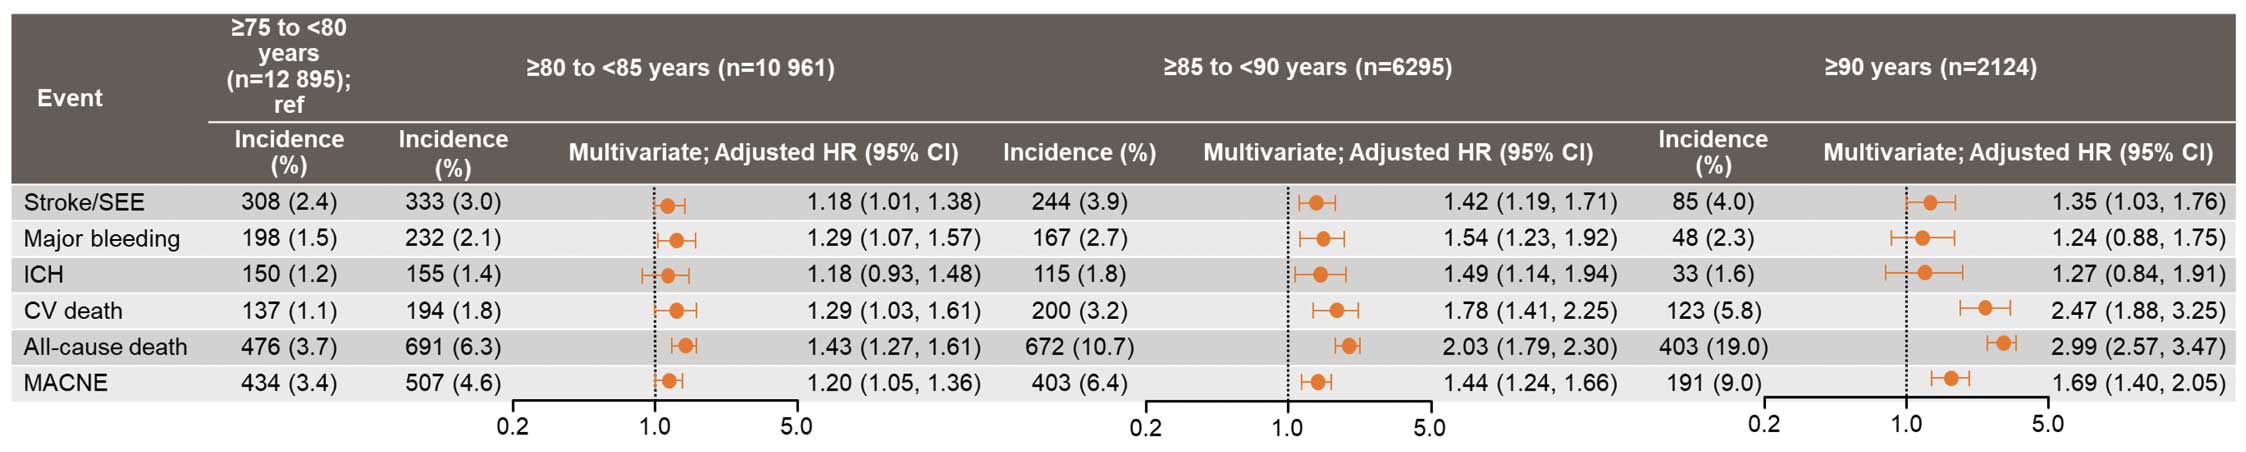
The incidence rate of all events showed a tendency to increase with age across all anticoagulant therapy groups (warfarin, DOAC, and no OAC; Table 4). However, this increase was more marked in the no-OAC group compared with both the DOAC and warfarin groups. Additionally, the DOAC group exhibited a numerically lower incidence of all events compared with the warfarin group, with the exception of major bleeding in the those aged ≥90 years. Multivariate analyses stratified by age group revealed that DOACs, compared with warfarin, were associated with a significantly lower risk of stroke/SEE, major bleeding, and ICH in the ≥80–<85 years age group, and a significantly lower risk of CV death and all-cause death in the ≥75–<80 years age group. For other age groups and endpoints, no significant differences were observed between DOAC and warfarin (Figure 3).
Table 4.
Incidence Rates of Events by Age Group and Anticoagulant Therapy
| Event |
≥75–<80 years |
≥80–<85 years |
≥85–<90years |
≥90 years |
| n (%) |
Per 100
person-years
(95% CI) |
n (%) |
Per 100
person-years
(95% CI) |
n (%) |
Per 100
person-years
(95% CI) |
n (%) |
Per 100
person-years
(95% CI) |
| No OAC |
| Stroke/SEE |
17 (1.9) |
1.02
(0.53–1.50) |
24 (3.3) |
1.80
(1.08–2.52) |
32 (5.9) |
3.35
(2.19–4.51) |
15 (5.4) |
3.33
(1.64–5.01) |
| Major bleeding |
11 (1.2) |
0.66
(0.27–1.04) |
11 (1.5) |
0.82
(0.34–1.31) |
15 (2.7) |
1.54
(0.76–2.33) |
3 (1.1) |
0.65
(0.00–1.39) |
| ICH |
7 (0.8) |
0.42
(0.11–0.73) |
7 (1.0) |
0.52
(0.13–0.91) |
11 (2.0) |
1.13
(0.46–1.80) |
2 (0.7) |
0.44
(0.00–1.04) |
| CV death |
9 (1.0) |
0.54
(0.19–0.88) |
17 (2.3) |
1.26
(0.66–1.86) |
26 (4.8) |
2.65
(1.63–3.67) |
21 (7.5) |
4.55
(2.61–6.50) |
| All-cause death |
32 (3.6) |
1.90
(1.24–2.56) |
50 (6.9) |
3.71
(2.68–4.74) |
81 (14.8) |
8.27
(6.47–10.07) |
72 (25.7) |
15.61
(12.01–19.22) |
| MACNE |
24 (2.7) |
1.44
(0.86–2.01) |
40 (5.5) |
3.01
(2.08–3.95) |
52 (9.5) |
5.45
(3.97–6.93) |
33 (11.8) |
7.32
(4.82–9.82) |
| DOAC |
| Stroke/SEE |
203 (2.3) |
1.19
(1.02–1.35) |
202 (2.7) |
1.47
(1.27–1.67) |
140 (3.5) |
1.93
(1.61–2.25) |
36 (3.2) |
1.85
(1.27–2.43) |
| Major bleeding |
127 (1.4) |
0.74
(0.61–0.87) |
133 (1.8) |
0.96
(0.00–1.13) |
99 (2.5) |
1.36
(1.09–1.62) |
30 (2.5) |
1.42
(0.91–1.92) |
| ICH |
97 (1.1) |
0.56
(0.45–0.68) |
88 (1.2) |
0.64
(0.50–0.77) |
66 (1.7) |
0.90
(0.68–1.12) |
19 (1.6) |
0.90
(0.49–1.30) |
| CV death |
69 (0.8) |
0.40
(0.31–0.49) |
105 (1.4) |
0.76
(0.61–0.90) |
117 (2.9) |
1.59
(1.30–1.88) |
59 (4.9) |
2.76
(2.06–3.47) |
| All-cause death |
288 (3.2) |
1.67
(1.48–1.86) |
414 (5.6) |
2.98
(2.69–3.26) |
381 (9.5) |
5.18
(4.66–5.70) |
195 (16.2) |
9.13
(7.85–10.41) |
| MACNE |
270 (3.0) |
1.58
(1.39–1.77) |
301 (4.1) |
2.19
(1.95–2.44) |
233 (5.8) |
3.21
(2.80–3.62) |
89 (7.4) |
4.22
(3.34–5.10) |
| Warfarin |
| Stroke/SEE |
88 (3.0) |
1.57
(1.25–1.90) |
107 (3.7) |
2.04
(1.66–2.43) |
72 (4.1) |
2.30
(1.77–2.83) |
31 (4.8) |
2.83
(1.83–3.83) |
| Major bleeding |
60 (2.0) |
1.07
(0.80–1.34) |
88 (3.1) |
1.68
(1.33–2.03) |
53 (3.0) |
1.68
(1.23–2.13) |
15 (2.3) |
1.35
(0.67–2.04) |
| ICH |
46 (1.5) |
0.82
(0.58–1.06) |
60 (2.1) |
1.14
(0.85–1.43) |
38 (2.2) |
1.20
(0.82–1.58) |
12 (1.9) |
1.08
(0.47–1.69) |
| CV death |
59 (2.0) |
1.05
(0.78–1.31) |
72 (2.5) |
1.36
(1.04–1.67) |
57 (3.3) |
1.79
(1.32–2.25) |
43 (6.7) |
3.86
(2.70–5.01) |
| All-cause death |
156 (5.2) |
2.76
(2.33–3.20) |
227 (7.9) |
4.28
(3.72–4.83) |
209 (12.0) |
6.56
(5.67–7.44) |
136 (21.2) |
12.20
(10.15–14.25) |
| MACNE |
140 (4.7) |
2.51
(2.09–2.92) |
166 (5.8) |
3.17
(2.69–3.66) |
118 (6.8) |
3.77
(3.09–4.45) |
69 (10.8) |
6.31
(4.82–7.80) |
Abbreviations as in Tables 1,2.

Risk Factors of Study Endpoints Among Patients Aged ≥90 Years
Among patients in the ≥90 years age group, a history of cerebrovascular disease was a risk factor for stroke/SEE. A history of major bleeding and falls within 1 year were risk factors for major bleeding. Risk factors for all-cause death were male sex, BMI <18 kg/m2, a history of major bleeding, heart failure/left ventricular systolic dysfunction, and falls within 1 year (Table 5).
Table 5.
Analysis of Prognostic Factors in Patients Aged ≥90 Years (Cox Proportional Hazards Model)
| |
Stroke/SEE |
Major bleeding |
All-cause death |
| n (%) |
HR (95% CI) |
n (%) |
HR (95% CI) |
n (%) |
HR (95% CI) |
| Sex |
| Female |
51 (4.0) |
0.97 (0.62–1.53) |
26 (2.0) |
0.74 (0.41–1.35) |
214 (16.8) |
0.62 (0.51–0.77) |
| Male |
34 (4.0) |
– |
22 (2.6) |
– |
189 (22.2) |
– |
| BMI (kg/m2) |
| <18 |
10 (4.1) |
1.21 (0.60–2.44) |
6 (2.4) |
1.43 (0.57–3.61) |
82 (33.3) |
1.80 (1.38–2.35) |
| ≥18.5–<25 |
43 (3.5) |
– |
24 (2.0) |
– |
220 (18.1) |
– |
| ≥25 |
13 (4.1) |
1.16 (0.61–2.19) |
8 (2.5) |
1.30 (0.57–2.98) |
42 (13.2) |
0.78 (0.56–1.09) |
| History of major bleeding |
| Yes |
4 (4.4) |
0.98 (0.36–2.73) |
5 (5.6) |
2.81 (1.07–7.34) |
29 (32.2) |
1.51 (1.02–2.23) |
| No |
81 (4.0) |
– |
43 (2.1) |
– |
374 (18.4) |
– |
| AF type |
| Paroxysmal |
23 (3.1) |
– |
17 (2.3) |
– |
130 (17.4) |
– |
| Persistent |
19 (4.9) |
1.59 (0.85–2.97) |
14 (3.6) |
1.47 (0.71–3.05) |
69 (17.7) |
0.91 (0.68–1.23) |
| Permanent |
43 (4.4) |
1.47 (0.86–2.51) |
17 (1.7) |
0.66 (0.33–1.34) |
204 (20.7) |
1.07 (0.84–1.35) |
| Hypertension (mmHg) |
| SBP <120 |
29 (4.5) |
1.11 (0.62–2.00) |
18 (2.8) |
1.39 (0.63–3.07) |
152 (23.6) |
1.20 (0.92–1.57) |
| SBP ≥120–<130 |
19 (4.0) |
– |
10 (2.1) |
– |
84 (17.9) |
– |
| SBP ≥130–<140 |
14 (3.2) |
0.82 (0.41–1.64) |
8 (1.8) |
0.91 (0.35–2.32) |
70 (16.1) |
0.93 (0.67–1.27) |
| SBP ≥140 |
18 (4.1) |
1.08 (0.56–2.07) |
10 (2.3) |
1.12 (0.46–2.74) |
68 (15.4) |
0.86 (0.62–1.19) |
| HF, LV systolic dysfunction |
| Yes |
47 (4.0) |
0.90 (0.57–1.42) |
25 (2.1) |
0.85 (0.46–1.56) |
259 (22.0) |
1.33 (1.07–1.65) |
| No |
38 (4.0) |
– |
23 (2.4) |
– |
144 (15.2) |
– |
| Cerebrovascular disease |
| Yes |
33 (5.8) |
1.74 (1.12–2.72) |
15 (2.6) |
1.07 (0.58–2.00) |
109 (19.1) |
0.94 (0.74–1.18) |
| No |
52 (3.4) |
– |
33 (2.1) |
– |
294 (18.9) |
– |
| Active cancer |
| Yes |
7 (4.0) |
0.99 (0.45–2.17) |
5 (2.8) |
1.22 (0.47–3.16) |
41 (23.2) |
1.14 (0.82–1.58) |
| No |
78 (4.0) |
– |
43 (2.2) |
– |
362 (18.6) |
– |
| Fall within 1 year |
| Yes |
16 (5.7) |
1.60 (0.92–2.80) |
13 (4.6) |
2.93 (1.50–5.71) |
71 (25.1) |
1.46 (1.12–1.90) |
| No |
59 (3.7) |
– |
29 (1.8) |
– |
280 (17.4) |
– |
| OAC therapy |
| Warfarin |
31 (4.8) |
– |
15 (2.3) |
– |
136 (21.2) |
– |
| None |
15 (5.4) |
1.35 (0.71–2.57) |
3 (1.1) |
0.47 (0.13–1.65) |
72 (25.7) |
1.34 (1.00–1.80) |
| DOACs |
39 (3.2) |
0.70 (0.43–1.13) |
30 (2.5) |
1.08 (0.57–2.04) |
195 (16.2) |
0.84 (0.67–1.05) |
| Catheter ablation |
| Yes |
0 (0.0) |
0.00 (0.00–0.00) |
0 (0.0) |
0.00 (0.00–0.00) |
2 (6.9) |
0.25 (0.06–1.00) |
| No |
85 (4.1) |
– |
48 (2.3) |
– |
401 (19.1) |
– |
| Creatinine clearance (mL/min) |
<30/severe renal
dysfunction/dialysis |
35 (3.9) |
0.75 (0.28–2.00) |
21 (2.3) |
0.77 (0.24–2.44) |
221 (24.5) |
1.61 (0.92–2.83) |
| ≥30–<50 |
27 (3.5) |
0.72 (0.27–1.90) |
16 (2.1) |
0.69 (0.22–2.14) |
108 (14.2) |
0.98 (0.56–1.72) |
| ≥50 |
5 (4.7) |
– |
4 (3.7) |
– |
14 (13.1) |
– |
| Polypharmacy (no. drugs) |
| <5 |
13 (3.3) |
– |
7 (1.8) |
– |
58 (14.8) |
– |
| ≥5–<9 |
52 (4.2) |
1.34 (0.72–2.50) |
26 (2.1) |
1.26 (0.54–2.96) |
242 (19.4) |
1.26 (0.94–1.69) |
| ≥9 |
19 (4.3) |
1.33 (0.64–2.77) |
14 (3.1) |
1.74 (0.68–4.44) |
90 (20.2) |
1.18 (0.84–1.67) |
HR, hazard ratio; LV, left ventricular. Other abbreviations as in Tables 1,2.
Discussion
First, this age-stratified subanalysis of the ANAFIE Registry described patient outcomes by 5-year age segments for elderly patients with NVAF under a high prescription rate of OACs. Second, the differences in patient outcomes by OAC types stratified into 4 age categories were also described. Last, the risk factors of patient outcomes in patients aged ≥90 years were also analyzed.
In ANAFIE Registry patients with NVAF, OAC prescription rates exceeded 90% for those aged <90 years, were 86.8% for those aged ≥90–<100 years, and were 54.5% for those aged ≥100 years. Among these, DOACs were the most commonly prescribed, being used by over 70%, 60%, and 50% of patients in the respective age groups. Chao et al. reported that before the advent of DOACs (1996–2011), only 3.9% of 15,756 AF patients aged ≥90 years from the Taiwan Nationwide Cohort Study were treated with warfarin.17 In the DOAC era (2012–2015), 16.1% of 10,852 AF patients aged ≥90 years from the same cohort received OACs (7.1% warfarin; 9% DOACs).17 Raposeiras-Roubín et al. found that, in Spanish patients from 2013 to 2018, 69.5% of 1,750 AF patients aged ≥90 years were on OAC therapy (28.6% warfarin; 40.9% DOACs).18 Compared with previous studies, the ANAFIE Registry, registered between 2016 and 2020, shows the highest OAC prescription rates, particularly DOACs, among large cohorts of very elderly NVAF patients.
This subanalysis of the ANAFIE Registry also highlighted that the risk of stroke/SEE, major bleeding, ICH, CV death, all-cause death, and MACNE significantly increased with age. However, for patients aged ≥90 years, although the incidence of CV death, all-cause death, and MACNE rose substantially, the incidence of stroke/SEE, major bleeding, and ICH reached a plateau. This pattern is consistent with previous studies. A study from a single-center database in Hong Kong in AF patients aged ≥80 years showed no significant difference in the incidence rate of stroke/SEE and ICH between those aged ≥90 years and those aged 80–89 years.19 Similarly, an analysis of data from 4 Swedish national registers indicated that the incidence rates of stroke and major bleeding were comparable across age groups 80–84, 85–89, and ≥90 years, with only a minor increase in major bleeding in OAC-treated patients as they aged.20 In this Swedish cohort, although all-cause death rates notably increased in the ≥90 years age group, the rise in death rates from stroke was marginal.20
A meta-analysis of phase 3 RCTs showed that when DOAC dosage was restricted to a standard dose, the risk for stroke/SEE with DOACs compared with warfarin did not differ across age groups (<65, 65–74, >75 years; P for interaction=0.45). However, the risk for major bleeding relatively increased with age (P for interaction=0.05), and the benefit of DOACs lessened in those aged >75 years.21 Trends in the risk of stroke/SEE and major bleeding among elderly AF patients (age >75 years) are reported to be consistent between RCTs and observational studies.22 Nonetheless, few studies have reported patient outcomes comparing DOACs vs. warfarin in very elderly AF patients aged ≥90 years. Chao et al. reported that, in AF patients aged ≥90 years from the Taiwan Nationwide Cohort Study, risks for ischemic stroke and major bleeding were comparable between DOACs and warfarin (HRs 1.16 [95% CI 0.61–2.22] and 0.95 [95% CI 0.63–1.44], respectively).17 Raposeiras-Roubín et al. found that, in AF patients aged ≥90 years from a multicenter registry in Spain, the net difference between death/embolic events and bleeding was superior for DOACs (−11.5 per 100 patient-years) compared with warfarin (−1.7 per 100 patient-years).18 The differences between these studies may stem from ethnic variations (Asians and Caucasians), potentially reflecting differences in body weight and consequent CCr, which would affect the selection and dosing of DOACs.23
In the ANAFIE Registry, the adjusted HR for DOACs vs. warfarin indicated an advantage for DOACs in reducing the incidence of stroke/SEE, major bleeding, and ICH in the ≥80–<85 years age group. However, in the ≥85–<90 years and ≥90 years age groups, DOACs did not exhibit advantages in patient outcomes. Notably, a tendency of reduced risk associated with DOACs compared with warfarin for major bleeding was diminished in those aged ≥90 years. This finding may be in line with a recent trial indicating that switching from well controlled warfarin to DOACs in frail elderly AF patients offered no benefit.24 In patients aged ≥85–<90 years and ≥90 years in the ANAFIE Registry, the proportion of patients with CCr <30 mL/min accounted for 20% and 40%, respectively, for whom a reduced dose of apixaban and edoxaban 15 mg once daily are preferable.25
Furthermore, in the present study, the adjusted HR for stroke/SEE in the no-OAC group compared with the warfarin group showed unexpected results: the risk was similar between the no-OAC and warfarin groups in patients aged <85 years, and the risk associated with the no-OAC group was elevated in patients aged ≥85 years. This result is partially explained by our previous subanalysis, which identified the no-OAC group as heterogeneous.16 Through cluster analysis, patients with no OAC use were classified into a low-risk group, characterized by paroxysmal AF and a high proportion of catheter ablation, and a high-risk group, consisting of very elderly patients with a high prevalence of bleeding history.16 Consequently, it is suggested that patients without OAC use who are aged <85 years are part of the former group, whereas those aged ≥85 years belong to the latter.
In patients aged ≥90 years in the ANAFIE Registry, the only independent risk factor for stroke/SEE was a history of cerebrovascular disease. This factor stands out particularly in very elderly AF patients who have a high prescription rate of OACs. A similar finding was reported in the Japanese elderly AF (J-ELD AF) Registry for patients aged ≥75 years, where all participants were prescribed an on-label DOAC.26 For major bleeding in patients aged ≥90 years in the ANAFIE Registry, the independent risk factors were identified as a history of major bleeding and a fall within 1 year. These factors are not easily modifiable, suggesting potential strategies including very-low-dose DOACs, discontinuation of OACs, and alternative methods, such as left atrial appendage closure or exclusion procedures, to prevent bleeding events. Regarding all-cause death in patients aged ≥90 years, several risk factors were independently associated. Among these, a history of major bleeding emerged as an independent risk factor, which was not significantly associated in the main analysis.10 Numerous studies have established that bleeding events under anticoagulant therapy are linked with an increased risk of all-cause death,27,28 especially in older populations.28 Our data align with these findings and underscore the critical importance of preventing bleeding events in very elderly patients.
Study Limitations
This study acknowledges several limitations. First, the ANAFIE Registry comprised Japanese patients, who typically had a lower body weight compared with populations in other regions. This demographic difference might lead to a distinct response to DOACs and warfarin.29 Second, frailty assessments were conducted in a limited number of patients30 and were not available for the entire population. Third, this prospective registry excluded elderly patients unable to visit the hospital, such as those who were bedridden or those with severe cognitive impairment without family support. This exclusion could have influenced the observed outcomes, particularly regarding the effectiveness and safety of anticoagulant therapy. Last, the ANAFIE Registry included a small number (n=11) of centenarians. Although a previous study of 89 AF centenarians half a year before death reported that OACs were prescribed for 9%,31 approximately 50% of centenarians in the ANAFIE Registry received OACs, suggesting a more proactive approach to treatment.
Conclusions
Among NVAF patients aged ≥75 years, although the risk of adverse outcomes increased significantly with advancing age, the incidence of stroke/SEE, major bleeding, and ICH reached a plateau in those aged ≥90 years. First, this finding highlights the importance of extending the scope of clinical care for very elderly NVAF patients beyond stroke prevention. Second, for stroke prevention, DOACs generally demonstrated a possible benefit over warfarin in elderly NVAF patients, albeit with limitations in reducing major bleeding among very elderly patients (i.e., those aged ≥90 years), in whom bleeding significantly impacts mortality. This indicates a potential benefit of a very low dose of DOAC for this demographic.
Acknowledgments
The authors thank Keyra Martinez Dunn, MD, of Edanz (www.edanz.com) for providing medical writing support, which was supported by Daiichi Sankyo Co., Ltd, Tokyo, Japan, in accordance with Good Publication Practice 2022 guidelines (https://www.ismpp.org/gpp-2022). In addition, the authors thank Daisuke Chiba, of Daiichi Sankyo Co., Ltd, for supporting preparation of the manuscript.
Disclosures
S.S. received research funding from Daiichi Sankyo, and remuneration from Bristol-Myers Squibb and Daiichi Sankyo. T. Yamashita received research funding from Bristol-Myers Squibb, Bayer, and Daiichi Sankyo, manuscript fees from Daiichi Sankyo and Bristol-Myers Squibb, and remuneration from Daiichi Sankyo, Bayer, Pfizer Japan, and Bristol-Myers Squibb. M.A. received research funding from Bayer and Daiichi Sankyo, and remuneration from Bristol-Myers Squibb, Nippon Boehringer Ingelheim, Bayer, and Daiichi Sankyo. H.A. received remuneration from Daiichi Sankyo. T.I. received research funding from Daiichi Sankyo, and remuneration from Daiichi Sankyo, Pfizer Japan, and Bayer. Y.K. received remuneration from Daiichi Sankyo, Bristol-Myers Squibb, and Nippon Boehringer Ingelheim. K.O. received remuneration from Nippon Boehringer Ingelheim, Daiichi Sankyo, Johnson & Johnson, and Medtronic. W.S. received research funding from Daiichi Sankyo, and Nippon Boehringer Ingelheim, and remuneration from Daiichi Sankyo, Pfizer Japan, Bristol-Myers Squibb, Bayer, and Nippon Boehringer Ingelheim. H.T. received research funding from Daiichi Sankyo and Nippon Boehringer Ingelheim, remuneration from Daiichi Sankyo, Bayer, Nippon Boehringer Ingelheim, and Pfizer Japan, scholarship funding from Daiichi Sankyo, and consultancy fees from Pfizer Japan, Bayer, and Nippon Boehringer Ingelheim. K.T. received remuneration from Daiichi Sankyo, Bayer, Bristol-Myers Squibb, Otsuka, and Novartis. A.H. participated in a course endowed by Boston Scientific Japan, has received research funding from Daiichi Sankyo and Bayer, and remuneration from Bayer, Daiichi Sankyo, Bristol-Myers Squibb, and Nippon Boehringer Ingelheim. M.Y. received research funding from Nippon Boehringer Ingelheim, and remuneration from Nippon Boehringer Ingelheim, Daiichi Sankyo, Bayer, Bristol-Myers Squibb, and Pfizer Japan. T. Yamaguchi acted as an advisory board member for Daiichi Sankyo and has received remuneration from Daiichi Sankyo and Bristol-Myers Squibb. S.T. received research funding from Nippon Boehringer Ingelheim and remuneration from Daiichi Sankyo, Sanofi, Takeda, Chugai Pharmaceutical, Solasia Pharma, Bayer, Sysmex, Nipro, NapaJen Pharma, Gunze, and Atworking. M.F., Y.M., and A.T. are employees of Daiichi Sankyo. H.I. received remuneration and consultancy fees from Daiichi Sankyo. T. Yamashita, T.I., W.S, and H.T. are Associate Editors for Circulation Journal. A.H. was a member of Circulation Reports’ Editorial Team.
Funding
This research was supported by Daiichi Sankyo Co., Ltd.
IRB Information
Ethics approval was obtained from all relevant institutional review boards, and all patients provided written informed consent and were free to withdraw from the Registry at any time. The principal ethics committee was The Ethics Committees of The Cardiovascular Institute (Tokyo, Japan; Approval no. 299).
Data Availability
The individual deidentified participant data and study protocol will be shared for up to 36 months after publication of the article. Access criteria for data sharing (including requests) will be decided on by a committee led by Daiichi-Sankyo. To gain access, those requesting data access will need to sign a data access agreement. Requests should be directed to yamt-tky@umin.ac.jp
References
- 1.
Inoue H, Fujiki A, Origasa H, Ogawa S, Okumura K, Kubota I, et al. Prevalence of atrial fibrillation in the general population of Japan: An analysis based on periodic health examination. Int J Cardiol 2009; 137: 102–107.
- 2.
Go AS, Hylek EM, Phillips KA, Chang Y, Henault LE, Selby JV, et al. Prevalence of diagnosed atrial fibrillation in adults: National implications for rhythm management and stroke prevention: The AnTicoagulation and Risk factors in Atrial fibrillation (ATRIA) Study. JAMA 2001; 285: 2370–2375.
- 3.
Wolf PA, Abbott RD, Kannel WB. Atrial fibrillation as an independent risk factor for stroke: The Framingham Study. Stroke 1991; 22: 983–988.
- 4.
Yamashita Y, Hamatani Y, Esato M, Chun YH, Tsuji H, Wada H, et al. Clinical characteristics and outcomes in extreme elderly (age ≥85 years) Japanese patients with atrial fibrillation: The Fushimi AF Registry. Chest 2016; 149: 401–412.
- 5.
Torn M, Bollen WL, van der Meer FJ, van der Wall EE, Rosendaal FR. Risks of oral anticoagulant therapy with increasing age. Arch Intern Med 2005; 165: 1527–1532.
- 6.
Hart RG, Benavente O, McBride R, Pearce LA. Antithrombotic therapy to prevent stroke in patients with atrial fibrillation: A meta-analysis. Ann Intern Med 1999; 131: 492–501.
- 7.
Ruff CT, Giugliano RP, Braunwald E, Hoffman EB, Deenadayalu N, Ezekowitz MD, et al. Comparison of the efficacy and safety of new oral anticoagulants with warfarin in patients with atrial fibrillation: A meta-analysis of randomised trials. Lancet 2014; 383: 955–962, doi:10.1016/S0140-6736(13)62343-0.
- 8.
Okumura K, Akao M, Yoshida T, Kawata M, Okazaki O, Akashi S, et al. Low-dose edoxaban in very elderly patients with atrial fibrillation. N Engl J Med 2020; 383: 1735–1745.
- 9.
Barssoum K, Kumar A, Thakkar S, Sheth AR, Kharsa A, Ibrahim M, et al. Meta-analysis of safety and efficacy of anticoagulation versus no anticoagulation in octogenarians and nonagenarians with atrial fibrillation. High Blood Press Cardiovasc Prev 2021; 28: 271–282.
- 10.
Yamashita T, Suzuki S, Inoue H, Akao M, Atarashi H, Ikeda T, et al. Two-year outcomes of more than 30 000 elderly patients with atrial fibrillation: Results from the All Nippon AF In the Elderly (ANAFIE) Registry. Eur Heart J Qual Care Clin Outcomes 2022; 8: 202–213.
- 11.
Hiasa KI, Kaku H, Inoue H, Yamashita T, Akao M, Atarashi H, et al. Age-related differences in the clinical characteristics and treatment of elderly patients with atrial fibrillation in Japan: Insight from the ANAFIE (All Nippon AF In Elderly) Registry. Circ J 2020; 84: 388–396.
- 12.
Inoue H, Yamashita T, Akao M, Atarashi H, Ikeda T, Okumura K, et al. Prospective observational study in elderly patients with non-valvular atrial fibrillation: Rationale and design of the All Nippon AF In the Elderly (ANAFIE) Registry. J Cardiol 2018; 72: 300–306.
- 13.
Koretsune Y, Yamashita T, Akao M, Atarashi H, Ikeda T, Okumura K, et al. Baseline demographics and clinical characteristics in the All Nippon AF in the Elderly (ANAFIE) Registry. Circ J 2019; 83: 1538–1545.
- 14.
Akao M, Shimizu W, Atarashi H, Ikeda T, Inoue H, Okumura K, et al. Oral anticoagulant use in elderly Japanese patients with non-valvular atrial fibrillation: Subanalysis of the ANAFIE Registry. Circ Rep 2020; 2: 552–559.
- 15.
Akao M, Inoue H, Yamashita T, Atarashi H, Ikeda T, Koretsune Y, et al. Relationship between direct oral anticoagulant doses and clinical outcomes in elderly patients with non-valvular atrial fibrillation: ANAFIE Registry sub-analysis. Circ J 2023; 87: 1765–1774.
- 16.
Suzuki S, Yamashita T, Akao M, Atarashi H, Ikeda T, Okumura K, et al. Clinical phenotypes of older adults with non-valvular atrial fibrillation not treated with oral anticoagulants by hierarchical cluster analysis in the ANAFIE Registry. PLoS One 2023; 18: e0280753.
- 17.
Chao TF, Liu CJ, Lin YJ, Chang SL, Lo LW, Hu YF, et al. Oral anticoagulation in very elderly patients with atrial fibrillation: A nationwide cohort study. Circulation 2018; 138: 37–47.
- 18.
Raposeiras-Roubín S, Alonso Rodríguez D, Camacho Freire SJ, Abu-Assi E, Cobas-Paz R, Pascual CR, et al. Vitamin K antagonists and direct oral anticoagulants in nonagenarian patients with atrial fibrillation. J Am Med Dir Assoc 2020; 21: 367–373.e1.
- 19.
Siu CW, Tse HF. Net clinical benefit of warfarin therapy in elderly Chinese patients with atrial fibrillation. Circ Arrhythm Electrophysiol 2014; 7: 300–306.
- 20.
Appelros P, Farahmand B, Terént A, Åsberg S. To treat or not to treat: Anticoagulants as secondary preventives to the oldest old with atrial fibrillation. Stroke 2017; 48: 1617–1623.
- 21.
Carnicelli AP, Hong H, Connolly SJ, Eikelboom J, Giugliano RP, Morrow DA, et al; COMBINE AF (A Collaboration Between Multiple Institutions to Better Investigate Non-Vitamin K Antagonist Oral Anticoagulant Use in Atrial Fibrillation) Investigators. Direct oral anticoagulants versus warfarin in patients with atrial fibrillation: Patient-level network meta-analyses of randomized clinical trials with interaction testing by age and sex. Circulation 2022; 145: 242–255.
- 22.
Silverio A, Di Maio M, Prota C, De Angelis E, Radano I, Citro R, et al. Safety and efficacy of non-vitamin K antagonist oral anticoagulants in elderly patients with atrial fibrillation: Systematic review and meta-analysis of 22 studies and 440 281 patients. Eur Heart J Cardiovasc Pharmacother 2021; 7: f20–f29.
- 23.
Chan YH, Chan CY, Chen SW, Chao TF, Lip GYH. Comparisons of effectiveness and safety between on-label dosing, off-label underdosing, and off-label overdosing in Asian and non-Asian atrial fibrillation patients treated with rivaroxaban: A systematic review and meta-analysis of observational studies. Europace 2023; 25: euad288.
- 24.
Joosten LPT, van Doorn S, van de Ven PM, Köhlen BTG, Nierman MC, Koek HL, et al. Safety of switching from a vitamin K antagonist to a non-vitamin K antagonist oral anticoagulant in frail older patients with atrial fibrillation: Results of the FRAIL-AF randomized controlled trial. Circulation 2024; 149: 279–289.
- 25.
Chiang CE, Chao TF, Choi EK, Lim TW, Krittayaphong R, Li M, et al. Stroke prevention in atrial fibrillation: A scientific statement of JACC: Asia (Part 2). JACC Asia 2022; 2: 519–537.
- 26.
Okumura K, Yamashita T, Suzuki S, Akao M; J-ELD AF Investigators. A multicenter prospective cohort study to investigate the effectiveness and safety of apixaban in Japanese elderly atrial fibrillation patients (J-ELD AF Registry). Clin Cardiol 2020; 43: 251–259.
- 27.
Ogawa H, An Y, Ishigami K, Ikeda S, Doi K, Hamatani Y, et al. Long-term clinical outcomes after major bleeding in patients with atrial fibrillation: The Fushimi AF registry. Eur Heart J Qual Care Clin Outcomes 2021; 7: 163–171.
- 28.
Yu JH, Li PR, Chen DY, Huang WK, See LC. Mortality after major bleeding in Asian atrial fibrillation patients receiving different direct oral anticoagulants: A nationwide, propensity score study. Sci Rep 2024; 14: 4771.
- 29.
Chao TF, Joung B, Takahashi Y, Lim TW, Choi EK, Chan YH, et al. 2021 Focused update consensus guidelines of the Asia Pacific Heart Rhythm Society on Stroke Prevention in Atrial Fibrillation: Executive summary. Thromb Haemost 2022; 122: 20–47.
- 30.
Akishita M, Suzuki S, Inoue H, Akao M, Atarashi H, Ikeda T, et al. Frailty and outcomes in older adults with non-valvular atrial fibrillation from the ANAFIE registry. Arch Gerontol Geriatr 2022; 101: 104661.
- 31.
Kreutz R, Schmidt IM, Dräger D, Brüggen F, Hörter S, Zwillich C, et al. Atrial fibrillation and medication treatment among centenarians: Are all very old patients treated the same? Geriatr Gerontol Int 2018; 18: 1634–1640.
