Abstract
Background: This study aimed to optimize the fusion of quantitative maps and morphological images to improve late iodine enhancement (LIE) imaging using cardiac dual-energy computed tomography (DECT).
Methods and Results: We retrospectively analyzed 15 patients with suspected old myocardial infarction who underwent cardiac DECT. Virtual monochromatic images (VMI) ranging from 40 to 200 keV and quantitative maps (e.g., iodine concentration, effective atomic number, and electron density [(%EDW: percentage relative to the electron density of water)] were generated. The contrast-to-noise ratio (CNR) between LIE areas and the left ventricular (LV) blood pool and normal myocardium was calculated to determine the optimal image fusion for LIE delineation. VMI at 40 keV demonstrated superior CNR between LIE areas and normal myocardium. Electron density was significantly higher in LIE areas [105.5%EDW (interquartile range (IQR): 105.15–105.65)] than in the LV blood pool [104.4%EDW (IQR: 104.3–104.6)] and normal myocardium [104.4%EDW (IQR: 104.2–104.65)] (P<0.001). Iodine concentration and effective atomic number differed significantly between LIE areas and normal myocardium, but did not differ significantly between LIE areas and the LV blood pool. Fusion of 40 keV VMI with electron density maps yielded the highest area under the receiver operating characteristic curve (0.917).
Conclusions: Fused images combining 40 keV VMI with electron density maps significantly enhanced the visualization of LIE areas on DECT, offering improved contrast and diagnostic accuracy for the assessment of myocardial territories.
Cardiac magnetic resonance imaging (MRI) with late gadolinium enhancement (LGE) has become a pivotal imaging modality for diagnosing various cardiac conditions and predicting treatment outcomes in ischemic heart disease.1–3 In comparison, cardiac computed tomography (CT) is used primarily for assessing coronary artery disease, including identifying large, lipid-rich coronary plaques.4 However, recent studies have demonstrated that cardiac CT with late iodine enhancement (LIE) can produce results comparable to those from LGE-MRI for detecting myocardial infarction (MI)3,6,7 and cardiac amyloidosis,8 offering advantages such as shorter scan times due to the pharmacokinetics of iodine-based contrast agents. A recent report showed spatial matching of LIE dual-energy CT (DECT) and cardiac LGE-MRI,7 and another study reported consistency between cardiac CT and cardiac MRI in the identification of patients with cancer therapy-related cardiac dysfunction.9 Despite these advantages, a significant limitation of LIE-CT is the insufficient contrast compared with LGE-MRI.10–12
Recent advancements in DECT technology have enabled the acquisition of virtual monochromatic images (VMI) at various energy levels, allowing for improved contrast resolution. In particular, low-energy VMI have been shown to enhance contrast effects, offering superior diagnostic value over conventional CT images.13,14 In the context of indirect CT venography, 40-keV VMI obtained with dual-layer DECT have demonstrated improved image quality and diagnostic performance for deep vein thrombosis compared with conventional CT.15 Nonetheless, in cases of old MI (OMI), the increased CT attenuation in both the OMI area and the left ventricular (LV) blood pool can lead to reduced contrast between these regions, complicating the assessment of OMI, especially in subendocardial scars.16
Advancements in dual-layer DECT technology now allow for the generation of highly accurate quantitative maps, including iodine concentration, effective atomic number, and electron density.17 We hypothesized that fusing these quantitative maps with conventional morphological images could improve the evaluation of LIE on cardiac imaging. The objective of this study was to determine the most effective combination of fused images for accurate and reliable depiction of LIE on cardiac DECT.
Methods
This retrospective study received institutional review board approval, and the requirement for written informed consent was waived. Although the requirement for written informed consent to participate in this study was waived, patients provided written informed consent for the LIE-CT procedure, and information on their written informed consent is available upon request. All procedures performed in this study were in accordance with the ethical standards of the institutional research committee and with the 1964 Helsinki Declaration and its later amendments or comparable ethical standards.
Study Population
We retrospectively reviewed the clinical records of patients who underwent LIE-CT at Minamino Cardiovascular Hospital, Tokyo, between May 2020 and March 2021 and who had known or suspected OMI. According to the recommendations of the American College of Cardiology,18 coronary CT angiography was performed for patients clinically suspected of having or confirmed to have coronary artery disease. For the study patients, LIE-CT (equilibrium phase image acquisition) was added if physicians wanted to assess myocardial impairment in patients with MI and concurrent cardiomyopathy.
Patients were included if they had a history of acute MI and percutaneous coronary intervention (PCI), supported by ECG abnormalities in the region of the responsible lesion, and wall motion abnormalities on echocardiography. The exclusion criteria were estimated glomerular filtration rate (eGFR) <50 mL/min/1.73 m2, inability to undergo LIE-CT, and images with motion artifacts due to poor breath-holding or elevated heart rate (>70 beats/min).
Cardiac CT Image Acquisition
All patients were scanned using a dual-layer spectral detector CT scanner (iQon Spectral CT; Philips Healthcare). First, routine coronary CT angiography was performed with a 15-s intravenous infusion of 500 mgI/kg of iopamidol (Iopamiron 370; Bayer Healthcare). LIE images were acquired 7 min after the administration of contrast agent. Scanning was performed with retrospective ECG gating. The scanning parameters for cardiac CT imaging were: detector collimation, 64×0.625 mm; tube rotation time, 270 ms; tube voltage, 120 kVp; tube current, mean 216.1 mA (range, 175–384 mA); and volume CT dose index, mean 27.8 mGy (range, 15.9–39.3 mGy). ECG-based dose modulation was used to limit the radiation dose. The scanning parameters and contrast medium infusion protocols for LIE-CT are summarized in Table 1.
Table 1.
Scanning Parameters and Contrast Material Injection Protocols
| Scanning parameters |
|
| Tube voltage (kVp) |
120 |
| Tube current (effective mAs) |
Auto mA |
| Helical Pitch |
0.16 |
| Detector collimation (mm) |
64×0.625 |
| Rotation time (s) |
0.27 |
| Iodine dose (mgI/kg) |
500 |
| Scan start time |
7 min since the start of contrast injection |
CT Image Reconstruction
The spectral-based image data were post-processed at a workstation (IntelliSpace Portal version 11.1; Philips Healthcare) to generate VMI at 17 different energy levels (40–200 keV) with a spectral level of 3 (manufacturer’s recommendation). We used 120-kVp CT images reconstructed with IR (iDose level 3; Philips Healthcare) as controls. We also reconstructed quantitative maps [iodine concentration (mgI/mL), effective atomic number, and electron density (%EDW: percentage relative to the electron density of water)]. The slice thickness and interval of all CT images were 1.0 mm.
Quantitative Map Analysis
Quantitative analysis was performed on axial images by a radiology technologist with 19 years of experience in cardiac CT. Regions of interest (ROIs) were placed in the LIE areas, normal myocardium, and LV blood pool to measure the CT attenuation values. Areas of suspected LIE (LIE areas) were identified using specific criteria, including areas of delayed enhancement based on the coronary phase, areas with visibly increased attenuation compared with the surrounding myocardium, and areas corresponding to wall motion abnormalities observed on echocardiogram. ROIs were placed in areas approximately half the thickness of the myocardium. Image noise was defined as the standard deviation (SD) of attenuation in the normal myocardium. Contrast and contrast-to-noise ratio (CNR) were calculated using the following formulas:
ContrastLV-normal = HULV − HUnormal
ContrastLIE-LV = HULIE − HULV
ContrastLIE-normal = HULIE − HUnormal
CNRLV-normal = (HULV − HUnormal) / SD
CNRLIE-normal = (HULIE − HUnormal) / SD
CNRLIE-LV = (HULIE − HULV) / SD
We selected the energy level of the VMI with the highest average CNR as the optimal keV images. We compared the CT number of the optimal keV image and the quantitative values of iodine concentration, effective atomic number, and electron density among the LIE areas, normal myocardium, and LV blood pool. Two radiologists evaluated the overall image quality of the optimal keV images fused with quantitative maps.
Fused Image and LIE Area Assessment
As there are no prior reports on the optimal combination of VMI and quantitative maps obtained by DECT for evaluating LIE, we generated 1 : 1 fusion overlay images using the selected optimal keV VMI and each of the quantitative maps (iodine concentration, effective atomic number, and electron density).
The assessment of LIE areas with the different quantitative maps was evaluated by qualitative image analysis using a PACS viewer (View R, version 1.09.15; Yokogawa Electronic). For each suspected LIE area, 2 board-certified radiologists with 25 and 15 years of CT reporting experience, respectively, independently identified the culprit coronary artery.
The CT datasets were randomized, and the readers were blinded to the parameters. The right coronary artery, left anterior descending artery, and left circumflex artery were evaluated to determine which vessel was responsible for the LIE.
Statistical Analysis
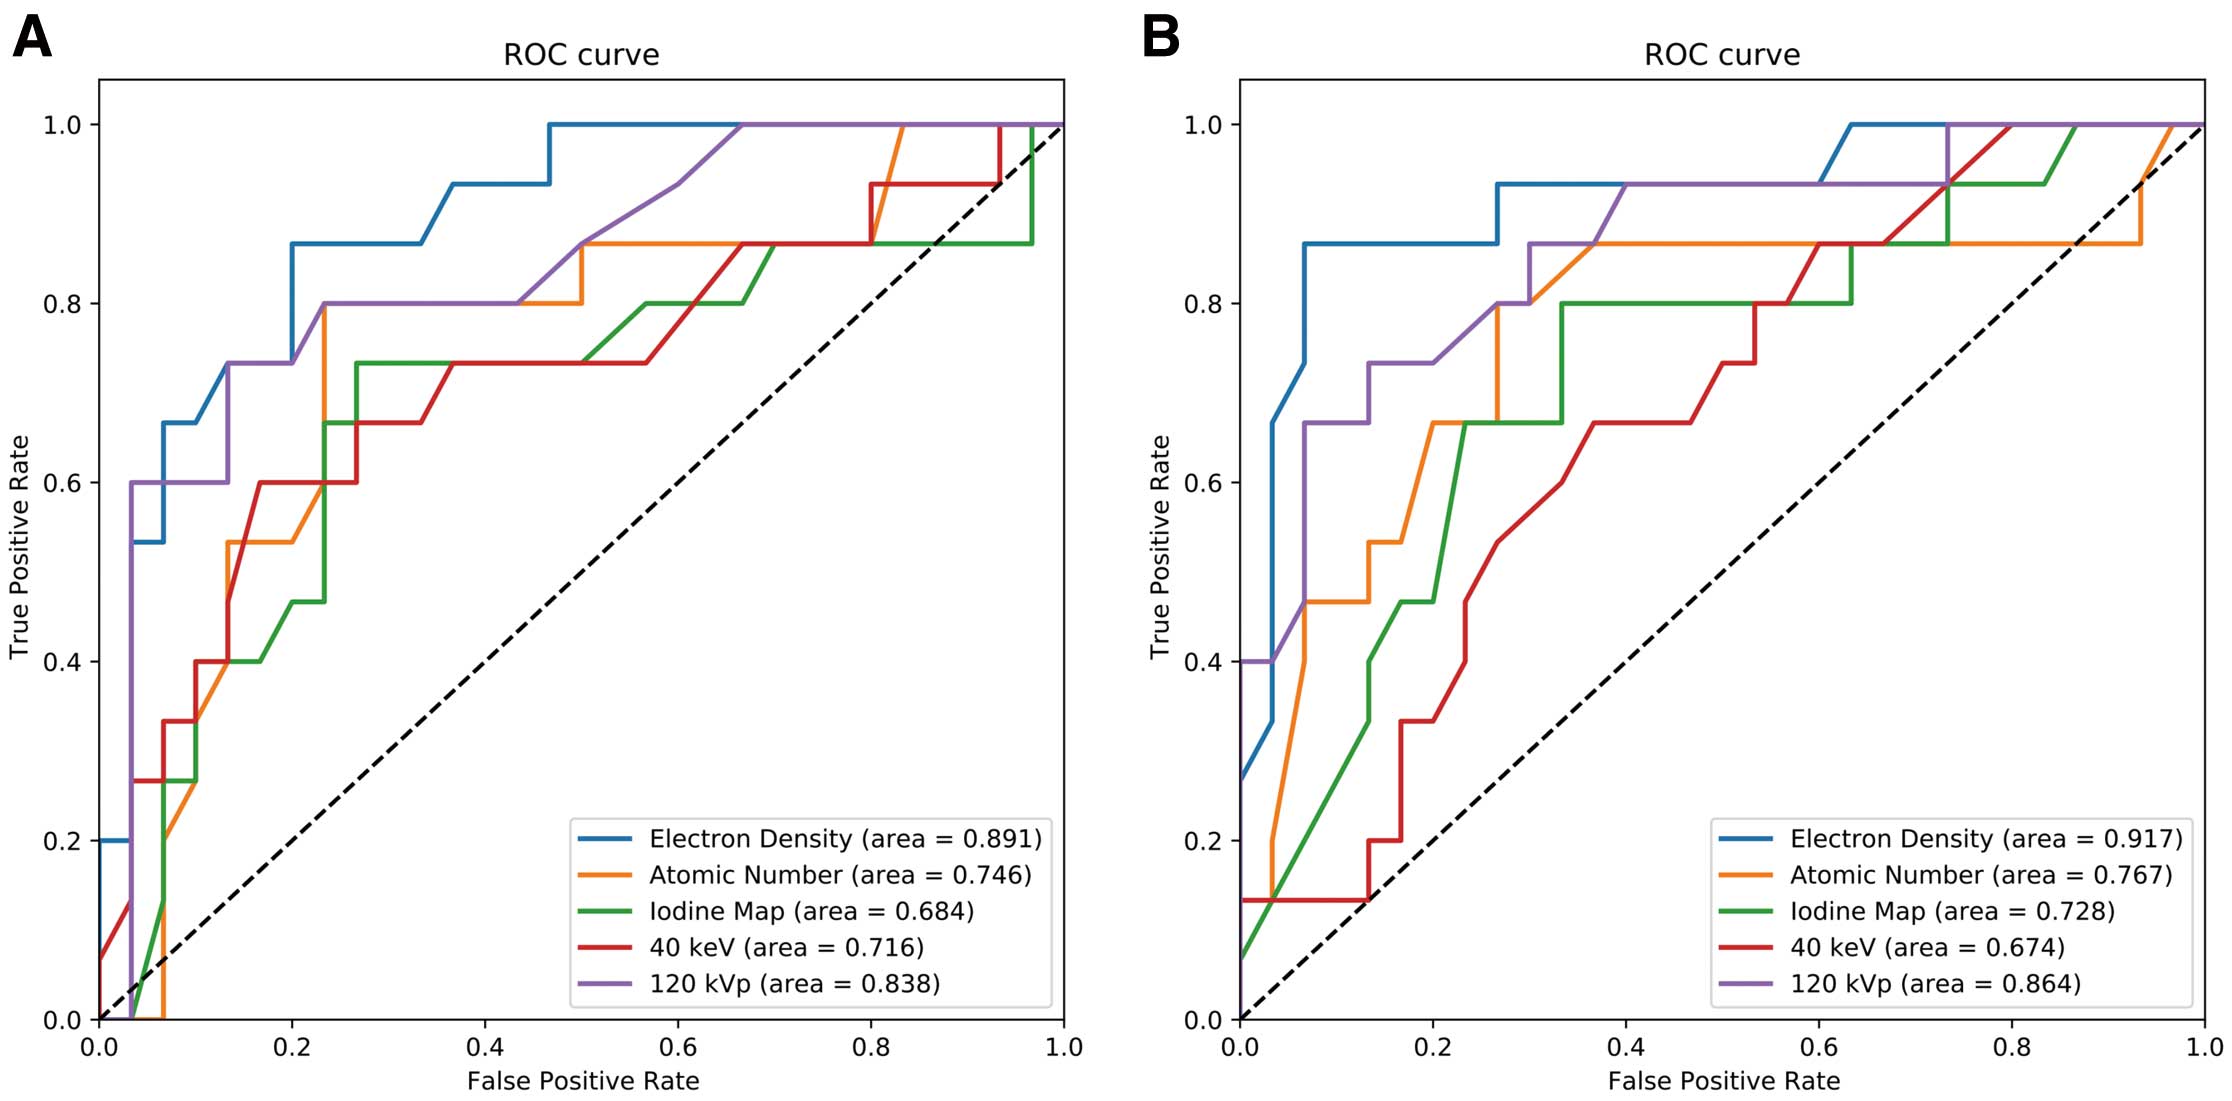
Statistical analysis was performed using R (version 4.2.2) and Python (version 3.1.0). The results are expressed as the median and interquartile range (IQR) because most of the data was not normally distributed. We compared the iodine concentration, effective atomic number, and electron density among the 3 regions (LIE areas, normal myocardium, and LV blood pool) using the Friedman test and the post hoc Nemenyi test. The accuracy of the observers’ assessment of the area was determined by receiver operating characteristic (ROC) curves and area under the ROC curves (AUC) for the 3 fused image types (iodine concentration, effective atomic number, and electron density with optimal keV VMI), optimal keV VMI alone, and 120 kVp images.
Results
Study Population
Among the patients who underwent LIE-CT during the study period, 82 had a history of potential OMI after PCI. Of these, 59 were excluded due to eGFR <50 mL/min/1.73 m2
and inability to undergo LIE-CT. An additional 8 patients were excluded due to motion artifacts from poor breath-holding or elevated heart rate (>70 beats/min) (Figure 1).
The remaining 15 patients comprised 13 males and 2 females, with a mean age of 69 years (range, 58–85 years), mean body weight of 66.1 kg (range, 48.2–99.6 kg), and mean body mass index of 24.7 kg/m2
(range, 20.1–40.1 kg/m2). The mean eGFR was 60.1 mL/min/1.73 m2
(range, 51.5–69.6 mL/min/1.73 m2). OMI was considered when there was a history of acute MI and ECG abnormalities in the region of the responsible lesion. Additionally, patients exhibited wall motion abnormalities on echocardiography in the area of the responsible lesion. Of the 15 patients, 8 had subepicardial late enhancement, and 7 had transmural late enhancement.
Quantitative Map Analysis
Our quantitative map analysis results are shown in Table 2, Figure 2 and Figure 3.
Table 2.
Quantitative Analysis
| Quantitative maps |
LV blood pool |
Normal myocardium |
LIE area |
| Iodine concentration (mgI/mL) |
1.96
(IQR: 1.58, 2.48) |
1.25
(IQR: 0.89, 1.38) |
1.74
(IQR: 1.32, 2.26) |
| Effective atomic number |
8.34
(IQR: 8.18, 8.56) |
8.02
(IQR: 7.81, 8.06) |
8.34
(IQR: 8.15, 8.53) |
| Electron density (%EDW) |
104.4
(IQR: 104.3, 104.6) |
104.4
(IQR: 104.2, 104.65) |
105.5
(IQR: 105.15, 105.65) |
LIE, late iodine enhancement; %EDW, percentage relative to the electron density of water.
As the energy of the VMI decreased, CT number contrast and CNR between the LV blood pool and LIE areas gradually increased. The 40-keV images offered the best CNR between the normal myocardium and LIE areas or the LV blood pool; thus, 40-keV images were selected as the optimized energy VMI. However, the CNR between the LIE areas and the LV blood pool decreased at 40 keV (Figure 2).
There were significant differences in iodine concentration and effective atomic number between the LIE areas and normal myocardium [1.74 mgI/mL (IQR: 1.32–2.26) vs. 1.25 mgI/mL (IQR: 0.89–1.38); P=0.01, and 8.34 (IQR: 8.15–8.53) vs. 8.02 (IQR: 7.81–8.06); P=0.001]; however, there were no significant differences in iodine concentration and effective atomic number between the LIE areas and the LV blood pool [1.74 mgI/mL (IQR: 1.32–2.26) vs. 1.96 mgI/mL (IQR: 1.58–2.48); P=0.161, and 8.34 (IQR: 8.15–8.53) vs. 8.34 (IQR: 8.18–8.56); P=0.617]. The electron density in the LIE areas [105.5%EDW (IQR: 105.15–105.65)] was significantly higher than that of the LV blood pool [104.4%EDW (IQR: 104.3–104.6)] and normal myocardium [104.4%EDW (IQR: 104.2–104.65)] (P<0.001) (Figure 3).
Fused Image and LIE Area Assessment
In the fused images, the electron density maps offered the highest AUC [Reader 1: 0.891; Reader 2: 0.917], followed by the effective atomic number maps [Reader 1: 0.746; Reader 2: 0.767], and the iodine concentration maps [Reader 1: 0.684; Reader 2: 0.728]. Additionally, the AUC of the electron density maps was higher than that of the 120 kVp images [Reader 1: 0.838; Reader 2: 0.864] and 40 keV images [Reader 1: 0.716; Reader 2: 0.674] (Figure 4).
In this study, electron density images clearly depicted the lesion, regardless of transmural (Figure 5) or subendocardial (Figure 6) LIE.

Discussion
The results of this study suggested that 40keV, the lowest energy VMI for CNR, was optimal for morphological imaging. On the quantitative maps, electron density provided the best contrast between the LIE areas and the normal myocardium and LV blood pool. The fused images combining the electron density maps and the 40-keV VMI offered better diagnostic performance for identifying myocardial territories with LIE than other fused images, 40-keV VMI alone, or 120-kVp images.
In recent years, LIE-CT has gained attention as an easy method for obtaining information similar to that provided by LGE-MRI.5,13,19 For patients with OMI, many reports have suggested that LIE-CT can evaluate myocardial viability similar to LGE-MRI.20–24 However, Palmisano et al. reported that the agreement between LIE-CT and LGE-MRI is dependent on reader experience, with a per-patient overall accuracy of 95% and 88% for the most and least experienced observers, respectively.21 They also reported that the agreement between LIE-CT and LGE-MRI is low for small, thin scars, especially subepicardial lesions, because the CNR between these lesions and the LV blood pool is lower than on LGE-MRI.21
Several reports have shown that low-energy VMI obtained by DECT have good diagnostic performance for identifying LIE lesions. A report by Mochizuki et al.25 investigated dual-layer DECT with VMI to assess hemodynamic changes in an area of infected myocardium. They reported that low-energy VMI were useful for revealing abnormalities associated with myocardial perfusion. Another report suggested that DECT with myocardial LIE imaging and myocardial extracellular volume showed promise for evaluating pulmonary hypertension.26 Rodriguez-Granillo et al. reported that at delayed enhancement in 40-keV VMI, CT attenuation higher than 161 HU had a sensitivity of 72% and a specificity of 79% for detecting OMI on a per-segment basis.22 In the present study, the CNR between the LIE areas and the normal myocardium was improved by 40-keV VMI; however, our results suggested that low-energy VMI may not improve the diagnostic performance in subepicardial lesions, as the CNR between LIE areas and the LV blood pool was reduced.
On quantitative maps, electron density maps provided higher contrast between the LIE areas and the LV blood pool than the effective atomic number or iodine concentration maps. At the equilibrium phase, when scanning for LIE, the contrast medium is uniformly distributed in the vessel lumen and intercellular spaces.23 Therefore, the contrast medium concentration in the LIE areas is close to that in the vessel lumen because in the LIE areas, myocyte injury leads to increased interstitial space.24 Low-energy VMI images, effective atomic number maps, and iodine concentration maps are strongly affected by photoelectric effects due to the contrast medium. Therefore, it is possible that the difference in CT number between the LV blood pool and LIE areas decreases in low-energy VMI because of the increased photoelectric effect.27
The reason for the higher diagnostic performance of the electron density maps compared with other quantitative maps is unclear from the results of this study alone, but 2 factors may contribute to this phenomenon. First, the electron density differs from other images in that it is more strongly affected by Compton scattering than by the photoelectric effect.28 The LIE areas may have altered electron density compared with the normal myocardium and LV blood pool due to fibrosis and fatty degeneration. Second, the contrast medium generally has a slightly higher density than blood, and in areas with LIE the concentration of the contrast medium may be higher than in normal myocardium, possibly resulting in a slight increase in density. It has been reported that the electron density obtained from DECT can be measured with high precision in phantom studies,29 and it is possible that such slight changes were captured in this study. These considerations are speculative, and further research is needed to explain the reason for the change in electron density in areas that indicate LIE.
The diagnostic performance of fused images using electron density imaging to detect myocardial territories with LIE was superior to that assessed by 120-kVp images or VMI alone. The low-energy VMI increased the enhancement of contrast medium, providing high contrast between the normal myocardium and the LV blood pool or LIE areas. Conversely, low-energy VMI reduced the contrast between the LV blood pool and the LIE areas, but this contrast was increased on electron density maps. Therefore, the fusion of 40-keV images with electron density maps can offer high-contrast images of the LIE areas, normal myocardium, and LV blood pool. Our results suggested that this fused image should increase diagnostic performance for general radiologists when evaluating myocardial territories with LIE.
Study Limitations
First, cardiac MRI with LGE is considered the gold standard for evaluating myocardial fibrosis. However, this study did not directly compare the findings of DECT with MRI for detecting myocardial fibrosis in the same patient cohort. This lack of a comparison makes it difficult to definitively validate the findings of our study. Nonetheless, the main aim of this study was to establish a role for CT, which is quicker and easier to perform logistically, with the expectation that subsequent studies will compare LIE-CT with LGE-MRI, confirming whether LIE on CT can definitively identify OMI areas. Second, the single-center design and small sample size of 15 patients may limit the generalizability of the results. A larger sample size and a direct comparison between the gold standard of cardiac MRI and DECT are required to validate our results.
In conclusion, when evaluating LIE with DECT, the fusion of 40-keV VMI with electron density maps was useful for evaluating myocardial territories with LIE, providing good contrast between areas with LIE and the LV blood pool. However, comparison of the results of DECT with those of the gold-standard MRI is necessary to validate our findings and definitively label LIE areas as OMI.
Acknowledgment
We thank the team at the Minamino Cardiovascular Hospital for their help in performing the study.
Disclosures
T.N. has received research support from Nemoto Kyorindo Co., Ltd. T.H. has received research support from Canon Medical Systems. The Department of Diagnostic Imaging Analysis, to which M.K. belongs, is an endowed chair supported by Philips Healthcare. Nemoto Kyorindo Co., Ltd., Philips Healthcare, and Canon Medical Systems had no control over the interpretation, writing, or publication of this work.
Funding Information
This research did not receive any specific grant from funding agencies in the public, commercial, or not-for-profit sectors.
Data Sharing Statement
The datasets generated or analyzed during the study are available from the corresponding author on reasonable request.
IRB Information
This retrospective study received institutional review board approval (MJ-022, “Delayed Enhancement CT Evaluation Using Spectral CT”); the requirement for written informed consent was waived.
References
- 1.
Kwong RY, Chan AK, Brown KA, Chan CW, Reynolds HG, Tsang S, et al. Impact of unrecognized myocardial scar detected by cardiac magnetic resonance imaging on event-free survival in patients presenting with signs or symptoms of coronary artery disease. Circulation 2006; 113: 2733–2743, doi:10.1161/CIRCULATIONAHA.105.570648.
- 2.
Wu KC, Weiss RG, Thiemann DR, Kitagawa K, Schmidt A, Dalal D, et al. Late gadolinium enhancement by cardiovascular magnetic resonance heralds an adverse prognosis in nonischemic cardiomyopathy. J Am Coll Cardiol 2008; 51: 2414–2421, doi:10.1016/j.jacc.2008.03.018.
- 3.
Yap J, Lim FY, Gao F, Wang SZ, Low SCS, Le TT, et al. Effect of myocardial viability assessed by cardiac magnetic resonance on survival in patients with severe left ventricular dysfunction. Circ Rep 2020; 2: 306–313, doi:10.1253/circrep.CR-19-0126.
- 4.
Sugiura J, Soeda T, Kyodo A, Nakamura T, Okamura A, Nogi K, et al. Clinical course of optical coherence tomography-detected lipid-rich coronary plaque after optimal medical therapy. Circ Rep 2021; 4: 29–37, doi:10.1253/circrep.CR-21-0147.
- 5.
Oda S, Emoto T, Nakaura T, Kidoh M, Utsunomiya D, Funama Y, et al. Myocardial late iodine enhancement and extracellular volume: Quantification with dual-layer spectral detector dual-energy cardiac CT. Radiol Cardiothorac Imaging 2019; 1: e180003, doi:10.1148/ryct.2019180003.
- 6.
Tanabe Y, Kido T, Kurata A, Kouchi T, Fukuyama N, Yokoi T, et al. Late iodine enhancement computed tomography with image subtraction for assessment of myocardial infarction. Eur Radiol 2018; 28: 1285–1292, doi:10.1007/s00330-017-5048-9.
- 7.
Yoshino Y, Goda A, Shimizu Y, Mohri T, Takuchi S, Koyama K, et al. Direct extension of IgG4-related periarteritis of the coronary artery to the adjacent myocardium demonstrated using dual-energy cardiac computed tomography. Circ J 2024; 88: 434, doi:10.1253/circj.CJ-23-0849.
- 8.
Yamasaki H, Kondo H, Shiroo T, Iwata N, Masuda T, Makita T, et al. Efficacy of computed tomography-based evaluation of myocardial extracellular volume combined with red flags for early screening of concealed cardiac amyloidosis in patients with atrial fibrillation. Circ J 2024; 88: 1167–1175, doi:10.1253/circj.CJ-23-0948.
- 9.
Sueta D, Kidoh M, Oda S, Egashira K, Yamamoto E, Kaikita K, et al. Usefulness of cardiac computed tomography in the diagnosis of anti-cancer therapy-related cardiac dysfunction: Consistency with magnetic resonance imaging. Circ J 2021; 85: 393–396, doi:10.1253/circj.CJ-20-1288.
- 10.
Tanabe Y, Kido T, Kurata A, Kouchi T, Fukuyama N, Yokoi T, et al. Late iodine enhancement computed tomography with image subtraction for assessment of myocardial infarction. Eur Radiol 2018; 28: 1285–1292, doi:10.1007/s00330-017-5048-9.
- 11.
Bauer RW, Kerl JM, Fischer N, Burkhard T, Larson MC, Ackermann H, et al. Dual-energy CT for the assessment of chronic myocardial infarction in patients with chronic coronary artery disease: Comparison with 3-T MRI. Am J Roentgenol 2010; 195: 639–646, doi:10.2214/AJR.09.3849.
- 12.
Nieman K, Shapiro MD, Ferencik M, Nomura CH, Abbara S, Hoffmann U, et al. Reperfused myocardial infarction: Contrast-enhanced 64-Section CT in comparison to MR imaging. Radiology 2008; 247: 49–56, doi:10.1148/radiol.2471070332.
- 13.
Wichmann JL, Bauer RW, Doss M, Stock W, Lehnert T, Bodelle B, et al. Diagnostic accuracy of late iodine-enhancement dual-energy computed tomography for the detection of chronic myocardial infarction compared with late gadolinium-enhancement 3-T magnetic resonance imaging. Invest Radiol 2013; 48: 851–856, doi:10.1097/RLI.0b013e31829d91a8.
- 14.
Ohta Y, Kitao S, Yunaga H, Fujii S, Mukai N, Yamamoto K, et al. Myocardial delayed enhancement CT for the evaluation of heart failure: Comparison to MRI. Radiology 2018; 288: 682–691, doi:10.1148/radiol.2018172523.
- 15.
Tanoue S, Nakaura T, Iyama Y, Iyama A, Nagayama Y, Yoshida M, et al. Diagnostic performance of dual-layer computed tomography for deep vein thrombosis in indirect computed tomography venography. Circ J 2020; 84: 636–641, doi:10.1253/circj.CJ-19-0722.
- 16.
Sinitsyn V. Cardiac dual-energy CT with late iodine enhancement as an alternative to late gadolinium enhancement MRI. Radiology 2018; 288: 692–693, doi:10.1148/radiol.2018181059.
- 17.
Liu P, Lin L, Xu C, Han Y, Lin X, Hou Y, et al. Quantitative analysis of late iodine enhancement using dual-layer spectral detector computed tomography: Comparison with magnetic resonance imaging. Quant Imaging Med Surg 2022; 12: 310–320, doi:10.21037/qims-21-344.
- 18.
Hua CH, Shapira N, Merchant TE, Klahr P, Yagil Y. Accuracy of electron density, effective atomic number, and iodine concentration determination with a dual-layer dual-energy computed tomography system. Med Phys 2018; 45: 2486–2497, doi:10.1002/mp.12903.
- 19.
Doherty JU, Kort S, Mehran R, Schoenhagen P, Soman P, Dehmer GJ, et al. ACC/AATS/AHA/ASE/ASNC/HRS/SCAI/SCCT/SCMR/STS 2019 Appropriate use criteria for multimodality imaging in the assessment of cardiac structure and function in nonvalvular heart disease: A Report of the American College of Cardiology Appropriate Use Criteria Task Force, American Association for Thoracic Surgery, American Heart Association, American Society of Echocardiography, American Society of Nuclear Cardiology, Heart Rhythm Society, Society for Cardiovascular Angiography and Interventions, Society of Cardiovascular Computed Tomography, Society for Cardiovascular Magnetic Resonance, and the Society of Thoracic Surgeons. J Am Coll Cardiol 2019; 73: 488–516, doi:10.1016/j.jacc.2018.10.038.
- 20.
Greffier J, Si-Mohamed S, Dabli D, de Forges H, Hamard A, Douek P, et al. Performance of four dual-energy CT platforms for abdominal imaging: A task-based image quality assessment based on phantom data. Eur Radiol 2021; 31: 5324–5334, doi:10.1007/s00330-020-07671-2.
- 21.
Palmisano A, Vignale D, Benedetti G, Del Maschio A, De Cobelli F, Esposito A. Late iodine enhancement cardiac computed tomography for detection of myocardial scars: Impact of experience in the clinical practice. Radiol Med 2020; 125: 128–136, doi:10.1007/s11547-019-01108-7.
- 22.
Rodriguez-Granillo GA, Campisi R, Deviggiano A, de Munain MNL, Zan MD, Capunay C, et al. Detection of myocardial infarction using delayed enhancement dual-energy CT in stable patients. Am J Roentgenol 2017; 209: 1023–1032, doi:10.2214/AJR.17.18118.
- 23.
Kim NY, Im DJ, Youn JC, Hong YJ, Choi BW, Kang SM, et al. Synthetic extracellular volume fraction derived using virtual unenhanced attenuation of blood on contrast-enhanced cardiac dual-energy CT in nonischemic cardiomyopathy. Am J Roentgenol 2022; 218: 454–461, doi:10.2214/AJR.21.26654.
- 24.
Thomson LEJ, Kim RJ, Judd RM. Magnetic resonance imaging for the assessment of myocardial viability. J Magn Reson Imaging 2004; 19: 771–788, doi:10.1002/jmri.20075.
- 25.
Mochizuki J, Nakaura T, Matsukura M, Hata Y, Hirai T. Identification of non-ST-segment elevation myocardial infraction by virtual monochromatic imaging. Circ Rep 2021; 3: 184–185, doi:10.1253/circrep.CR-20-0127.
- 26.
Oda S, Kidoh M, Nagayama Y, Nakaura T, Hirakawa K, Yamamoto E, et al. Non-invasive imaging in pulmonary hypertension: Comprehensive assessment using dual-layer spectral computed tomography. Circ J 2021; 85: 316, doi:10.1253/circj.CJ-20-1007.
- 27.
Große Hokamp N, Maintz D, Shapira N, Chang DH, Noël PB. Technical background of a novel detector-based approach to dual-energy computed tomography. Diagn Interv Radiol 2020; 26: 68–71, doi:10.5152/dir.2019.19136.
- 28.
Huddleston AL, Sackler JP. The determination of electron density by the dual-energy Compton scatter method. Medical Physics 1985; 12: 13–19, doi:10.1118/1.595730.
- 29.
Mei K, Ehn S, Oechsner M, Kopp FK, Pfeiffer D, Fingerle AA, et al. Dual-layer spectral computed tomography: Measuring relative electron density. Eur Radiol Exp 2018; 2: 20, doi:10.1186/s41747-018-0051-8.