Abstract
Background:
Balloon pulmonary angioplasty (BPA) is an alternative therapy for chronic thromboembolic pulmonary hypertension (CTEPH). Right heart catheterization (RHC) is essential to evaluate the efficacy of BPA. Cardiac magnetic resonance imaging (CMR) is also now used to assess the structure and function of the right heart non-invasively. The aim of this study was to correlate improvement in CMR with that on RHC, and compared with improvement in other non-invasive findings after BPA.
Methods and Results:
Forty-two patients underwent BPA between July 2012 and March 2015, and CMR, electrocardiography (ECG), and echocardiography were performed at the same time before and 6 months after BPA. Median pulmonary vascular resistance (PVR) was improved from 5.7 Wood units (IQR, 3.1–7.9 Wood units) to 2.7 Wood units (IQR, 1.6–3.9 Wood units; P<0.001). Changes in PVR were correlated with the changes in 5 CMR, 9 ECG, and 5 echocardiography parameters. On logistic analysis to identify the indicators of improving PH (i.e., PVR <3 Wood units), 4 CMR parameters were independently correlated with PVR change, one of which was median septal inversion ratio (SIR; 0.59; IQR, 0.54–0.63 to 0.54; IQR, 0.50–0.58, P<0.0001). SIR was the best predictor of PH (OR, 1.27; P<0.05).
Conclusions:
CMR can be used to estimate hemodynamic changes after BPA, and SIR is useful to predict alleviation of PH.
Chronic thromboembolic pulmonary hypertension (CTEPH) is characterized by organized thrombotic obstruction in the pulmonary arteries. Pulmonary hypertension (PH) develops due to the deficit in the pulmonary arterial bed, leading to overloading of the right heart. Right heart failure in patients with CTEPH is associated with an increase in mortality and a worsening of prognosis according to the severity of PH.1,2
With conventional treatment using anticoagulants and ambulatory oxygen therapy, 5-year survival is ≤50% for a mean pulmonary artery pressure (mPAP) >30 mmHg.3
Long-term experience has shown that pulmonary endarterectomy (PEA) is an effective first-line and curative strategy for CTEPH. One of the issues with PEA is that 20–40% of patients are not eligible for the procedure because of frailty, comorbidities, and distal-type lesions not accessible to surgery.4–7
Although pulmonary artery vasodilators are effective in these inoperable patients, the benefits are limited.8
Recently, balloon pulmonary angioplasty (BPA) has been developed and has been shown to be effective for inoperable CTEPH patients.9
Accurate measurement of PAP using right heart catheterization (RHC) is essential to evaluate the severity of PH and ascertain the efficacy of BPA so as to avoid possible fatal complications.10
Cardiac magnetic resonance (CMR), a non-invasive and reproducible technique, can provide structural and functional information about the heart, with views from any angle. Kreitner et al demonstrated a correlation between CMR and RHC in PH involving CTEPH.11
Furthermore, some studies reported that magnetic resonance imaging (MRI) was useful for assessing morphologic changes after PEA or BPA.12,13
However, there has been no comparison of CMR with other non-invasive modalities regarding hemodynamic changes in patients with BPA.
Therefore, the aim of this study was to (1) evaluate whether morphological and functional abnormalities in CTEPH are alleviated with BPA; (2) investigate the association between hemodynamic changes on RHC and those on CMR, electrocardiography (ECG), and echocardiography; and (3) investigate whether CMR can be used to predict pulmonary vascular resistance (PVR) <3 Wood units.
Methods
Patients
A total of 118 patients with CTEPH and chronic thromboembolic disease (CTED) who underwent 2 consecutive BPA sessions at Kyorin University Hospital in Japan between July 2012 and March 2015 were screened for this study. They were diagnosed as having CTEPH on decreased perfusion on lung scan and stenosed or occluded pulmonary arteries on pulmonary angiography, after diseases including pulmonary arterial hypertension, pulmonary disease, and left heart abnormality had been ruled out on blood tests, pulmonary function tests, and echocardiography.9
CTED was defined as PVR <3 Wood units. Of these patients, 42 (36 patients with CTEPH and 6 patients with CTED) underwent CMR and RHC at the same time before and after BPA. We set the endpoint of BPA as improvement of symptoms or no longer needing long-term oxygen therapy.
All 42 patients provided written informed consent, and the analysis of clinical data related to BPA in the present study was approved by the institutional review board of Kyorin University Hospital (Institutional Review Board 737). The procedures followed were in accordance with the Declaration of Helsinki and the ethics standards of the responsible committee on human experimentation.
Measurements
Clinical parameters measured on RHC, CMR, ECG, and echocardiography were obtained at baseline and 6 months after final BPA.
Right atrial pressure (RAP), PAP, and pulmonary arterial wedge pressure (PAWP) were measured during RHC for all 42 patients. Cardiac output (CO) was determined with the Fick technique using assumed oxygen consumption and determination of arterial and mixed venous O2
saturation. Cardiac index was calculated by dividing CO by body surface area. PVR was calculated by subtracting PAWP from mPAP and dividing by CO.
All 42 patients underwent CMR with a 1.5-T MRI system (Excelart Vantage powered by Atlas; Toshiba Medical Systems, Otawara, Tochigi, Japan) with an Atlas SPEEDER body coil. Steady-state free precession sequences covering the range from the cardiac base to the apex at end-diastole were used to acquire axial 2-D multi-slice images in approximately 25 s during a single breath-hold with ECG gating (repetition time/echo time, 4.2 ms/2.1 ms; flip angle, 80°; matrix, 192×256; slice thickness, 10 mm; interslice gap, 4 mm; and number of slices, 19–38).
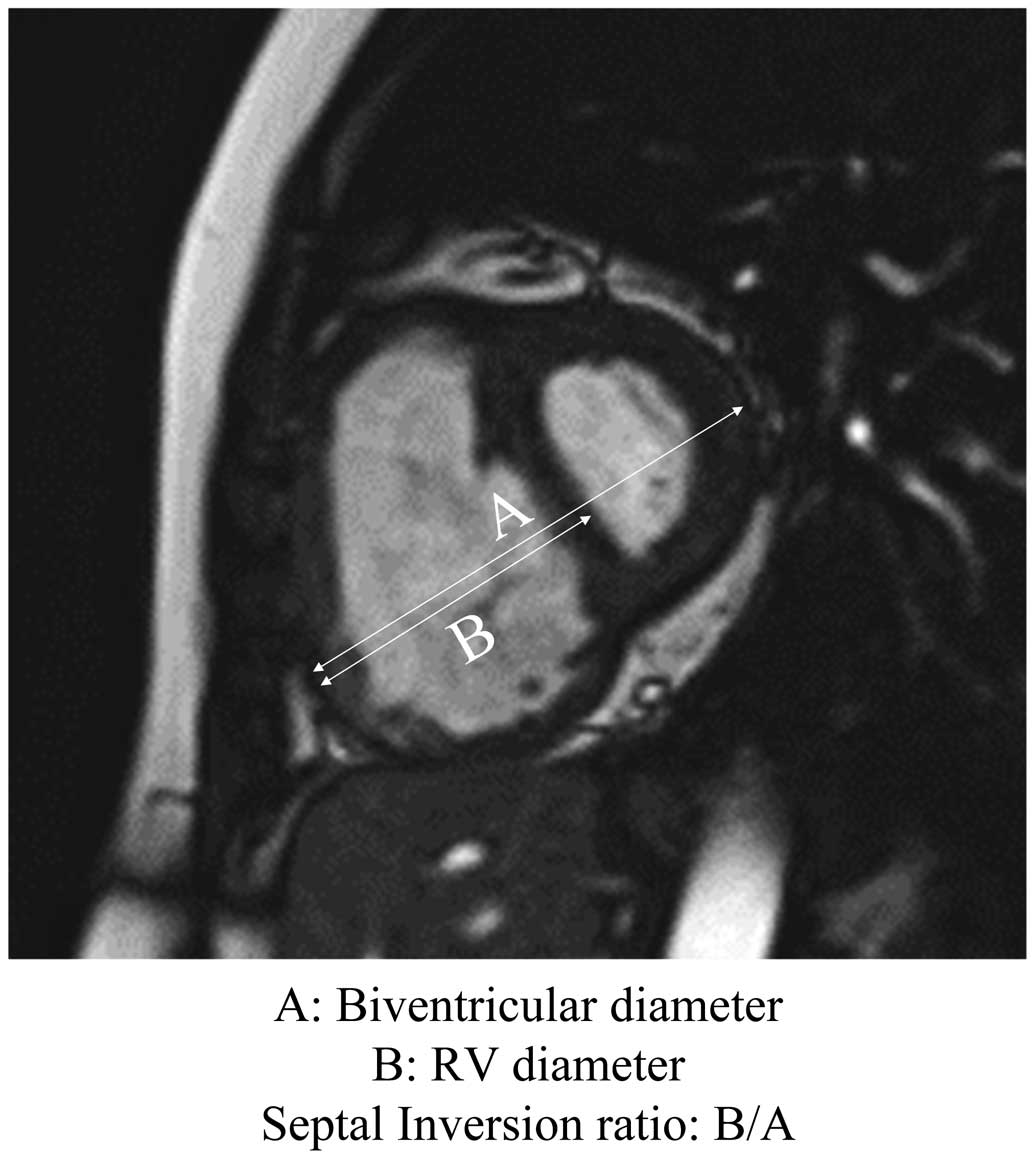
Image analysis was performed on a workstation (SYNAPSE VINCENT; FUJIFILM, Minato, Tokyo, Japan) by 2 radiologists specializing in CMR. In the left ventricular short-axis plane, right ventricular (RV) end-diastolic volume index (RVEDVI), RV end-systolic volume index (RVESVI), RV stroke volume index (RVSVI), and RV ejection fraction (RVEF) were calculated by manual tracing. To correct for differences in physique, RV volume parameters were divided by body surface area. The septal inversion ratio (SIR) was calculated by dividing RV diameter by biventricular diameter (Figure 1) at early end-diastole.14
A standard 12-lead ECG (10 mm=1 mV, 50 mm/s) was recorded at the same time as CMR. The following were measured or recorded as indications of RV hypertrophy: R in V1; R/S ratio in V1; S in V1; S in V5; [(R/S) in V5/(R/S) in V1] ratio; (R in V1+S in I)−S in V1; R in V1+S in V5; P amplitude in II; presence of (S>R) in I; and the number of negative T waves in chest leads.
In 32 patients, echocardiography (IE33, Royal Philips, Eindhoven, Amsterdam, The Netherlands) was performed at the same time as CMR. RV end-diastolic area (RVEDA), RV end-systolic area (RVESA), RV functional area change (RVFAC), tricuspid regurgitation pressure gradient (TRPG), and tricuspid annular plane systolic excursion (TAPSE) were measured.
Changes in Diagnostic Parameters After BPA
PVR, mPAP, and CO were compared between before and after BPA. Five diagnostic parameters in CMR, 9 ECG parameters, and 5 echocardiographic parameters were also compared between before and after BPA.
Correlation of PVR and Diagnostic Parameter Changes After BPA
The change in each parameter from before BPA to after BPA was defined as ∆. Because PVR is considered to be the most appropriate indicator derived from anatomical changes after BPA of the 3 hemodynamic parameters PVR, mPAP, and CO, the correlations of ∆PVR with the changes in 5 CMR parameters, 9 ECG parameters, and 5 echocardiographic parameters were analyzed.
Predictors of PVR <3 Wood Units
To evaluate the possible predictors of PVR <3 Wood units, logistic regression analysis was performed using the 5 CMR, 9 ECG, and 5 echocardiography parameters as explanatory variables and including all the data before and after BPA.
Statistical Analysis
For the purposes of statistical analysis, all data are expressed as median (IQR: top 25th percentile [first quartile]−bottom 25th percentile [third quartile]). Significant differences between the 2 groups were determined using the Mann-Whitney U-test or Wilcoxon’s matched-pairs signed rank test, as appropriate. Correlations between PVR and all the variables (CMR, ECG, and echocardiography) were evaluated using Pearson’s coefficient of correlation. Univariate analysis based on logistic regression analysis was used to examine the relationship between PVR <3 Wood units and the predictive variables. The results are expressed as odds ratios (OR). Multivariate analysis based on the logistic regression analysis was performed to examine the independent effect of each variable on PVR <3 Wood units. The best predictive threshold was derived from receiver operating characteristic (ROC) curves. The Youden index was used to define the best cut-off on the ROC curve. P<0.05 was considered statistically significant.
Results
Baseline Characteristics
Baseline patient characteristics are listed in
Table 1. Median observation period was 7.1 months (IQR, 5.0–9.4 months). Median BPA sessions per patient was 2 (IQR, 2–2) and the median number of dilated vessels per patient was 9 (IQR, 6–11).
Table 1.
CTEPH Patient Baseline Characteristics
| Variables |
| Age (years) |
62 (55–70) |
| BSA (m2) |
1.5 (1.4–1.7) |
| No. BPA sessions per person |
2 (2–2) |
| No. dilated vessels per person |
9 (6–11) |
| Observation period (months) |
7.1 (5.0–9.4) |
| BNP (pg/mL) |
48 (31–95) |
| 6MWD (m) |
422 (360–467) |
| NYHA |
3 (3–3) |
| Right heart catheterization |
| mPAP (mmHg) |
30 (25–42) |
| PVR (Wood units) |
5.7 (3.1–7.9) |
| Cardiac index (L/min/m2) |
2.8 (2.2–3.2) |
| CMR |
| RVEDVI (mL/m2) |
112 (96–145) |
| RVESVI (mL/m2) |
80 (61–113) |
| RVSVI (mL/m2) |
38 (26–47) |
| RVEF (%) |
32 (20–38) |
| SIR |
0.59 (0.54–0.63) |
| ECG |
| R in V1 >6 mm |
18 (43) |
| R/S ratio in V1 >1 |
19 (45) |
| S in V1 <2 mm |
15 (36) |
| S in V5 >10 mm |
4 (10) |
| [(R/S in V5)/(R/S in V1)] <0.04 |
5 (12) |
| (R in V1+S in I)−S in V1 >6 mm |
26 (62) |
| R in V1+S in V5 >10.5 mm |
19 (45) |
| P amplitude in II >2.5 mm |
0 (0) |
| Presence of (S>R) in I |
14 (33) |
| No. negative T waves in chest leads |
2 (1–4) |
| Echo |
| RVEDA (cm2) |
18 (16–26) |
| RVESA (cm2) |
11 (8–18) |
| RVFAC (%) |
40 (32–47) |
| TRPG (mmHg) |
58 (37–73) |
| TAPSE (mm) |
20 (18–22) |
Data given as n (%) or median (IQR). 6MWD, 6-min walk distance; BNP, B-type natriuretic peptide; BPA, balloon pulmonary angioplasty; BSA, body surface area; CMR, cardiac magnetic resonance imaging; CTEPH, chronic thromboembolic pulmonary hypertension; Echo, echocardiography; ECG, electrocardiography; mPAP, mean pulmonary arterial pressure; NYHA, New York Heart Association classification; PVR, pulmonary vascular resistance; RVEDA, right ventricular end-diastolic area; RVEDVI, right ventricular end-diastolic volume index; RVEF, right ventricular ejection fraction; RVESA, right ventricular end-systolic area; RVESVI, right ventricular end-systolic volume index; RVFAC, right ventricular fractional area change; RVSVI, right ventricular stroke volume index; SIR, septal inversion ratio; TAPSE, tricuspid annular plane systolic excursion; TRPG, tricuspid regurgitation pressure gradient.
Figure 2
shows that RHC hemodynamic parameters improved significantly after BPA (PVR, 5.7 [3.1–7.9] to 2.7 [1.6–3.9] Wood units, P<0.001; mPAP, 30 [25–42] to 23 [19–27] mmHg, P<0.001; cardiac index, 2.8 [2.2–3.2] to 3.0 [2.6–3.7] L/min/m2, P<0.01). In addition, significant improvements were seen in other parameters (6-min walk distance, 422 [360–467] to 439 [396–508] m, P<0.01; B-type natriuretic peptide, 48 [31–95] to 35 [25–58] pg/mL, P<0.01; New York Heart Association functional class, 3 [3–3] to 1 [1–2], P<0.0001).
Changes in CMR Parameters
On CMR a significant improvement was seen in all parameters of RV function except RVSVI (Figure 3A). Significant improvements were seen in RVEDVI (106 [94–141] to 104 [90–119] mL/m2, P<0.01), RVESVI (80 [61–113] to 65 [55–83] mL/m2, P<0.0001), RVEF (32 [20–38] to 38 [28–44] %, P<0.001), and SIR (0.59 [0.54–0.63] to 0.54 [0.50–0.58], P<0.0001), whereas RVSVI showed no significant change (38 [26–47] to 42 [28–48] mL/m2, P=0.073).
Correlation of PVR and CMR Changes
∆PVR was significantly correlated with ∆RVEDVI, ∆RVESVI, ∆RVEF, and ∆SIR (∆RVEDVI, r=0.40; 95% CI: 0.002–0.54, P=0.0077; ∆RVESVI, r=0.54; 95% CI: 0.28–0.72, P=0.0002; ∆RVEF, r=−0.52; 95% CI: −0.71 to −0.26, P=0.0004; ∆SIR, r=0.53; 95% CI: 0.27–0.72, P=0.0003). In contrast, ∆RVSVI was not correlated with any parameters (∆RVSVI, r=−0.27; 95% CI: −0.54 to 0.027, P=0.073;
Figure 3B).
Changes in ECG and Echocardiography Parameters
Regarding the ECG parameters, the change after BPA was significant in the following parameters: R in V1, S in V5, [(R/S) in V5/(R/S) in V1] ratio, (R in V1+S in I)−S in V1, R in V1+S in V5, P amplitude in II, and the number of negative T waves in chest leads. There were no significant differences in R/S ratio in V1, S in V1
or the presence of (S>R) in I. With regard to the echocardiography parameters, there were significant differences in RVESA, TRPG, and TAPSE, but no significant differences in RVEDA or RVFAC (Table 2).
Table 2.
Change in ECG and Echo Parameters After BPA
| Variables |
Before BPA |
After BPA |
P-value |
| ECG |
| R in V1 (mm) |
5.1 (2.6–8.3) |
3.6 (1.9–6.2) |
<0.0001 |
| R/S ratio in V1 |
0.87 (0.36–25.4) |
0.52 (0.26–3.6) |
0.067 |
| S in V1 (mm) |
6.4 (0.4–9.6) |
5.4 (0.98–9.6) |
0.57 |
| S in V5 (mm) |
4.1 (2.4–6.3) |
3.2 (1.1–5.3) |
0.030 |
| [(R/S) in V5/(R/S) in V1] ratio |
3.6 (0.1–11.6) |
9.6 (1.2–24.4) |
0.0018 |
| (R in V1+S in I)−S in V1 (mm) |
8.6 (1.8–14.6) |
5.7 (0.2–12.9) |
0.0008 |
| R in V1+S in V5 (mm) |
9.2 (6.0–13.5) |
7.0 (4.7–10.1) |
<0.0001 |
| P amplitude in II (mm) |
1.3 (0.9–1.7) |
1.1 (0.8–1.4) |
0.020 |
| Presence of (S>R) in I |
14 (33) |
6 (14) |
0.071 |
| No. negative T waves in chest leads |
2 (1–4) |
2 (1–3) |
0.0043 |
| Echo |
| RVEDA (cm2) |
17 (15–25) |
18 (14–20) |
0.078 |
| RVESA (cm2) |
10 (8–16) |
10 (7–13) |
0.032 |
| RVFAC (%) |
40 (33–48) |
42 (36–50) |
0.39 |
| TRPG (mmHg) |
56 (36–72) |
39 (31–50) |
0.0002 |
| TAPSE (mm) |
20 (18–23) |
22 (19–23) |
0.027 |
Data given as n (%) or median (IQR). Abbreviations as in Table 1.
Correlations between ∆PVR and the changes in ECG and echocardiography parameters were analyzed. Of the ECG parameters, ∆PVR was significantly correlated with ∆R in V1, ∆R in V1+∆S in V5, and ∆ (no. negative T waves in chest leads). Of the echocardiography parameters, ∆TRPG and ∆TAPSE were significantly correlated with ∆PVR (Table 3).
Table 3.
Correlation of PVR Changes With ECG, Echo Parameter Changes
| Variables |
r |
R2 |
P-value |
| ECG |
| R in V1 |
0.32 |
0.10 |
0.039 |
| R/S ratio in V1 |
0.21 |
0.044 |
0.18 |
| S in V1 |
−0.27 |
0.075 |
0.079 |
| S in V5 |
0.099 |
0.0097 |
0.53 |
| [(R/S) in V5/(R/S) in V1] ratio |
−0.14 |
0.019 |
0.39 |
| (R in V1+S in I)−S in V1 |
0.077 |
0.0059 |
0.63 |
| R in V1+S in V5 |
0.47 |
0.22 |
0.0017 |
| P amplitude in II |
0.18 |
0.033 |
0.25 |
| No. negative T waves in chest leads |
0.39 |
– |
0.012 |
| Echo |
| RVEDA |
0.24 |
0.055 |
0.20 |
| RVESA |
0.31 |
0.096 |
0.085 |
| RVFAC |
−0.12 |
0.015 |
0.51 |
| TRPG |
0.40 |
0.16 |
0.022 |
| TAPSE |
−0.36 |
0.12 |
0.045 |
Abbreviations as in Table 1.
We analyzed the factors associated with alleviation of PH, defined as PVR <3 Wood units (Table 4). According to univariate analysis, of the 19 variables, 12 were significant. Those with no association were RVSVI, R/S ratio in V1, S in V1, S in V5, (R/S) in V5/{(R/S) in V1, (R in V1)+(S in I-S in V1)}, and the number of negative T waves in chest leads. On multivariate analysis using variables with significant correlation (P<0.001) on univariate analysis, SIR (P<0.05) and TRPG (P<0.01) were most strongly associated with PH alleviation (Table 4).
Table 4.
Significant Indicators of PVR <3 Wood Units
| Variables |
Univariate analysis |
Multivariate analysis |
| OR |
P-value |
OR |
P-value |
| CMR |
| RVEDVI |
1.03 |
0.001 |
|
|
| RVESVI |
1.04 |
<0.001 |
|
0.82 |
| RVSVI |
|
0.66 |
|
|
| RVEF |
0.93 |
0.001 |
|
|
| SIR |
1.00 |
<0.0001 |
1.27 |
0.02 |
| ECG |
| R in V1 |
0.05 |
0.001 |
|
|
| R/S ratio in V1 |
|
0.52 |
|
|
| S in V1 |
|
0.20 |
|
|
| S in V5 |
|
0.30 |
|
|
| [(R/S) in V5/(R/S) in V1] |
|
0.43 |
|
|
| (R in V1+S in I)−S in V1 |
|
0.17 |
|
|
| R in V1+S in V5 |
0.19 |
0.002 |
|
|
| Presence of (S>R) in I |
0.05 |
<0.0001 |
|
0.18 |
| No. negative T waves in chest leads |
|
0.06 |
|
|
| Echo |
| RVEDA |
1.15 |
0.001 |
|
|
| RVESA |
1.22 |
0.0002 |
|
0.84 |
| RVFAC |
0.91 |
0.001 |
|
|
| TRPG |
1.10 |
<0.0001 |
1.07 |
0.003 |
| TAPSE |
0.79 |
0.001 |
|
|
Abbreviations as in Table 1.
Based on the multivariate analysis demonstrating a higher OR of SIR than TRPG (Table 4), SIR had the strongest association with hemodynamic change. We then analyzed the correlation between SIR and alleviation of PH. On ROC curve analysis, area under the curve was 0.87, cut-off, 0.55; OR, 21.5; likelihood ratio, 3.7; sensitivity, 87%; specificity, 76%; positive predictive value (PPV), 72%; and negative predictive value, 89% (Figure 4).
Discussion
This study has shown that BPA can improve not only hemodynamics, but also RV function as measured on CMR, and that CMR was able to evaluate the alleviation of PH non-invasively without RHC, and was the best indicator of hemodynamic change of the non-invasive testing modalities.
RVEDVI, RVESVI, RVEF, and SIR on CMR had significant improvement after BPA and had a good correlation with the improvement in PVR. These results are consistent with those of Fukui et al derived from a larger population.13
The improvements in RVESVI and RVEF were better correlated with an improvement in PVR than was the improvement in RVEDVI. This may indicate that the therapeutic effect of BPA approximately 6 months after treatment is a reduction in pressure load due to lowering of the PAP, causing an improvement in RV contraction before volume reduction. Balloon dilation improved RV function not only by the removal of the organized thrombus, but also by the expansion of the effective blood vessel area. The same effect with PEA, in improving RV contraction, has been reported previously.14
The RV dilatation was also improved to a varying degree in each case and may take a longer time to improve after reduction of the pressure load. Such a long period of ventricular dilatation might have caused irreversible degeneration of the RV myocardium, requiring a longer period of observational research.
With regard to the ECG parameters, the parameter related to the R wave voltage increase in V1
was most significantly reduced by BPA, and its correlation with the degree of improvement in PH was also good. In this study, however, only 43% of the patients had R in V1
>6 mm at baseline, the diagnostic criterion for RV hypertrophy, meaning that almost 60% of the patients had CTEPH that could not be detected at baseline. ECG can be recorded easily and is an excellent method of evaluation because of its smaller variation in measurement between examiners, but its sensitivity is low, although its specificity is high.15
According to Swift et al, with regard to the CMR parameters the PPV for PH was 89% for RVEDVI ≥75 mL/m2
and 93% for RVEF ≤35%.16
In the present study, using these criteria, the detection rate was 100% for RVEDVI and 64% for RVEF. Compared with ECG, CMR is superior for the detection of PH because CMR has no blind spot and can easily visualize abnormalities even if the right heart enlarges and the hypertrophy is mild.
With regard to the echocardiography parameters, RVEDA, RVESA, RVEF, TRPG, and TAPSE were able to evaluate right heart function. The variables significantly improved by BPA were RVESA, TRPG, and TAPSE. Of these, TRPG and TAPSE were correlated with PVR improvement. In line with the present results, TRPG and TAPSE have been reported as useful indices for assessing the severity of PH.17
The correlations between RVEDA, RVESA, and RVEF and the hemodynamic changes, however, were weaker than the correlations for CMR. This suggests that echocardiography is less reliable for the assessment of RV function because it is difficult to obtain stable images, depending on the examiners’ skill, although the fact that not all patients underwent echocardiography (32/42) may have influenced the results.
On multivariate analysis, SIR in CMR and TRPG in echocardiography were useful as independent predictors of PH alleviation. TRPG is a widely used parameter to calculate estimated PAP, and is indispensable when PH is suspected. However, it has been argued that the measured value is underestimated when the Doppler waveform of the tricuspid regurgitation flow is not clear; detecting mild PH is difficult; and the estimation of right atrial pressure to be added to TRPG is sometimes incorrect.18
Moreover, as noted here, compared with the more constant high quality of imaging in CMR, good imaging in echocardiography is sometimes difficult because of the patient’s physique or the insufficient skill level of the examiner.
Several methods for predicting the severity of PH based on the deformity of the interventricular septum have been reported.19,20
In this study, the ratio of the RV diameter in the early diastolic phase to the biventricular diameter was adopted. CMR can simply and consistently visualize the cardiac configuration under any clinical conditions. SIR in CMR may be expected to enable a diagnosis of PH on imaging, even in cases of technical difficulties for other modalities. However, the present patients had relatively mild to moderate PH, requiring the reproducibility of SIR in milder cases. Given that SIR from CMR can predict PVR <3 Wood units in outpatient clinics, the burden of invasive RHC on patients can be lightened. Echocardiography is used much more frequently in outpatient clinics, with a similar indicator to SIR for the assessment of PH, but it presents occasional difficulties in describing an accurate short axis and maintaining reproducibility,21
whereas CMR is more accurate regardless of patient condition.
Study Limitations
The limitations of this study are that it was a small study in a single center and an observational study over a relatively short period of time. The multivariate analysis in this study included data before and after BPA, therefore there may be individual bias that might have influenced the results. Further studies enrolling more patients from multiple centers are needed to validate the effectiveness of CMR in determining RV function in pulmonary angioplasty follow-up.
Conclusions
CMR had a good correlation with RHC and enabled excellent evaluation of improvement in right heart function, non-invasively and quantitatively. SIR in CMR was a useful index for predicting PVR <3 Wood units in patients with CTEPH. CMR appears to be a promising substitute for invasive hemodynamic diagnosis, and large prospective studies on the association of hemodynamic changes with changes in CMR, including SIR, are needed to confirm this.
Acknowledgment
We would like to thank Editage, Cactus Communications, PA USA for English language editing.
Data Availability
The datasets during and/or analyzed during the current study are available from the corresponding author on reasonable request.
Disclosures
The authors declare no conflicts of interest. This study was approved by the Faculty of Medicine Research Ethics Committee, Kyorin University (Reference number: H27-157).
References
- 1.
D’Alonzo GE, Barst RJ, Ayres SM, Bergofsky EH, Brundage BH, Detre KM, et al. Survival in patients with primary pulmonary hypertension: Results from a national prospective registry. Ann Intern Med 1991; 115: 343–349.
- 2.
Piazza G, Goldhaber SZ. Chronic thromboembolic pulmonary hypertension. N Engl J Med 2011; 364: 351–360.
- 3.
Riedel M, Stanek V, Widimsky J, Prerovsky I. Long-term follow-up of patients with pulmonary thromboembolism: Late prognosis and evolution of hemodynamic and respiratory data. Chest 1982; 81: 151–158.
- 4.
Madani MM, Auger WR, Pretorius V, Sakakibara N, Kerr KM, Kim NH, et al. Pulmonary endarterectomy: Recent changes in a single institution’s experience of more than 2,700 patients. Ann Thorac Surg 2012; 94: 97–103.
- 5.
Rahnavardi M, Yan TD, Cao C, Vallely MP, Bannon PG, Wilson MK. Pulmonary thromboendarterectomy for chronic thromboembolic pulmonary hypertension: A systematic review. Ann Thorac Cardiovasc Surg 2011; 17: 435–445.
- 6.
Dartevelle P, Fadel E, Mussot S, Chapelier A, Hervé P, de Perrot M, et al. Chronic thromboembolic pulmonary hypertension. Eur Respir J 2004; 23: 637–648.
- 7.
Mayer E, Jenkins D, Lindner J, D’Armini A, Kloek J, Meyns B, et al. Surgical management and outcome of patients with chronic thromboembolic pulmonary hypertension: Results from an international prospective registry. J Thorac Cardiovasc Surg 2011; 141: 702–710.
- 8.
Nishimura R, Tanabe N, Sugiura T, Shigeta A, Jujo T, Sekine A, et al. Improved survival in medically treated chronic thromboembolic pulmonary hypertension. Circ J 2013; 77: 2110–2117.
- 9.
Kataoka M, Inami T, Hayashida K, Shimura N, Ishiguro H, Abe T, et al. Percutaneous transluminal pulmonary angioplasty for the treatment of chronic thromboembolic pulmonary hypertension. Circ Cardiovasc Interv 2012; 5: 756–762.
- 10.
Hoeper MM, Lee SH, Voswinckel R, Palazzini M, Jais X, Marinelli A, et al. Complications of right heart catheterization procedures in patients with pulmonary hypertension in experienced centers. J Am Coll Cardiol 2006; 48: 2546–2552.
- 11.
Kreitner KF, Kunz RP, Ley S, Oberholzer K, Neeb D, Gast KK, et al. Chronic thromboembolic pulmonary hypertension: Assessment by magnetic resonance imaging. Eur Radiol 2007; 17: 11–21.
- 12.
Reesink HJ, Marcus JT, Tulevski II, Jamieson S, Kloek JJ, Vonk Noordegraaf A, et al. Reverse right ventricular remodeling after pulmonary endarterectomy in patients with chronic thromboembolic pulmonary hypertension: Utility of magnetic resonance imaging to demonstrate restoration of the right ventricle. J Thorac Cardiovasc Surg 2007; 133: 58–64.
- 13.
Fukui S, Ogo T, Morita Y, Tsuji A, Tateishi E, Ozaki K, et al. Right ventricular reverse remodelling after balloon pulmonary angioplasty. Eur Respir J 2014; 43: 1394–1402.
- 14.
Iino M, Dymarkowski S, Chaothawee L, Delcroix M, Bogaert J. Time course of reversed cardiac remodeling after pulmonary endarterectomy in patients with chronic pulmonary thromboembolism. Eur Radiol 2008; 18: 792–799.
- 15.
Kopeć G, Tyrka A, Miszalski-Jamka T, Sobień M, Waligóra M, Brózda M, et al. Electrocardiogram for the diagnosis of right ventricular hypertrophy and dilation in idiopathic pulmonary arterial hypertension. Circ J 2012; 76: 1744–1749.
- 16.
Swift AJ, Rajaram S, Condliffe R, Capener D, Hurdman J, Elliot CA, et al. Diagnostic accuracy of cardiovascular magnetic resonance imaging of right ventricular morphology and function in the assessment of suspected pulmonary hypertension results from the ASPIRE registry. J Cardiovasc Magn Reson 2012; 14: 40.
- 17.
Forfia PR, Fisher MR, Mathai SC, Housten-Harris T, Hemnes AR, Borlaug BA, et al. Tricuspid annular displacement predicts survival in pulmonary hypertension. Am J Respir Crit Care Med 2006; 174: 1034–1041.
- 18.
Fisher MR, Forfia PR, Chamera E, Housten-Harris T, Champion HC, Girgis RE, et al. Accuracy of Doppler echocardiography in the hemodynamic assessment of pulmonary hypertension. Am J Respir Crit Care Med 2009; 179: 615–621.
- 19.
Roeleveld RJ, Marcus JT, Faes TJ, Gan TJ, Boonstra A, Postmus PE, et al. Interventricular septal configuration at MR imaging and pulmonary arterial pressure in pulmonary hypertension. Radiology 2005; 234: 710–717.
- 20.
Dellegrottaglie S, Sanz J, Poon M, Viles-Gonzalez JF, Sulica R, Goyenechea M, et al. Pulmonary hypertension: Accuracy of detection with left ventricular septal-to-free wall curvature ratio measured at cardiac MR. Radiology 2007; 243: 63–69.
- 21.
Raymond RJ, Hinderliter AL, Willis PW, Ralph D, Caldwell EJ, Williams W, et al. Echocardiographic predictors of adverse outcomes in primary pulmonary hypertension. J Am Coll Cardiol 2002; 39: 1214–1219.