Abstract
The present study focuses on mechanotransduction in mesenchymal stem cells (MSCs) in response to matrix elasticity. By using photocurable gelatinous gels with tunable stiffness, proteomic profiles of MSCs cultured on tissue culture plastic, soft (3 kPa) and stiff (52 kPa) matrices were deciphered using 2-dimensional differential in-gel analysis (2D-DIGE). The DIGE data, tied to immunofluorescence, indicated abundance and organization changes in the cytoskeletonal proteins as well as differential regulation of important signaling-related proteins, stress-responsing proteins and also proteins involved in collagen synthesis. The major CSK proteins including actin, tubulin and vimentin of the cells cultured on the gels were remarkably changed their expressions. Significant down-regulation of α-tubulin and β-actin can be observed on gel samples in comparison to the rigid tissue culture plates. The expression abundance of vimentin appeared to be highest in the MSCs cultured on hard gels. These results suggested that the substrate stiffness significantly affects expression balances in cytoskeletal proteins of MSCs with some implications to cellular tensegrity.
Introduction
In general, living cells have characteristic abilities to passively sense and actively respond to extracellular mechanical stimuli or milieu. For example, vascular endothelial cells acutely perceive blood shear stress, which induces morphological and cytosketal remodeling, up-regulation of production of nitric oxide (Korenaga et al., 1994; Davies et al., 1997), acetylcholine (Milner et al., 1990) and pros-tacyclin (Grabowski et al., 1985), etc. The phenotype of chondrocytes is affected by hydrodynamic pressure (Smith et al., 1995) and periodic compression forces (Jung et al., 2008) of their surroundings. The activity of osteocytes for bone remodeling is regulated by the amplitude of mechanical load (Reijnders et al., 2007). In addition to such the dynamic mechanical stimulus, mechanical microenvironment also affects cell behaviors. Surface elasticity is of significant interest because the mechanical conditions have potential to regulate a wide variety of the biological events of various cell types, including cell growth, signaling, replication, differentiation, adhesion and motility (Pelham and Wang, 1997; Lo et al., 2000; Wang et al., 2000; Discher et al., 2005; Peyton et al., 2006; Kidoaki and Matsuda, 2008; Kocgozlu et al., 2010). A process known as mechanotransduction, through which the cells sense applied mechanical force and transduce this stimulus into biochemical signals has been extensively studied in the research area of cell mechanobiology (Wang et al., 1993).
Related to this issue, mechanobiology of stem cells has recently drawn much attention. Hydrogels with tunable elasticity, mimicking the stiffness of native tissues, have increasingly been applied to study stem cell biology (Saha et al., 2008; Evans et al., 2009; Seib et al., 2009; Winer et al., 2009a, 2009b; Gilbert et al., 2010). While the fate of stem cells is known to be regulated by certain biochemical soluble factors (Pittenger et al., 1999; Bianco et al., 2001), recent evidence shows that matrix elasticity can direct the lineage specification of MSCs (Engler et al., 2006; Rowlands et al., 2008). This provides the possibility of controlling stem cell fate via modulation of external stimuli generated by underlying substrate and design of the extra-cellular mechanical milieu. Considering approaches from biomaterials engineering to manipulate MSC, surface chemistry (McBeath et al., 2004; Curran et al., 2005; Benoit et al., 2008; Curran et al., 2010; Kilian et al., 2010) and nanotopography of cell culture substrate (Dalby et al., 2007; Oh et al., 2009; McMurray et al., 2011) have also been shown to be influential factors.
Considering the mechanism for such behaviors, the contribution of cytoskeletal mechanics are considered central, and regulation of cytoskeleton (CSK)-related molecules such as myosin light chain II and Rho A kinase (ROCK) have been investigated (Engler et al., 2006; Kilian et al., 2010; McMurray et al., 2011). However, details of the bio-mechanical fate control mechanisms of MSCs are not well elucidated and their systematic exploitation for designing biomaterials has not been established. To achieve this, comprehensive analysis for behaviors of whole intracellular proteins especially including CSK-related molecules is required.
To systematically characterize the substrate-mechanics-induced biomechanical responses of MSCs, the present study focuses on the proteomic changes of MSCs in response to micro-engineered matrix elasticity, based on the analysis for global comparative proteomics. The differential expressions of MSCs cultured on the cell adhesive elasticity-tunable gels (as we have previously developed (Kidoaki and Matsuda, 2008; Kawano and Kidoaki, 2011)) were studied using the 2D-DIGE. DIGE-based proteomics has been applied for the study of the relative differences in protein abundance of human osteoprogenitor in response to surface topographies (Kantawong et al., 2009a, 2009b, 2009c), demonstrating the advantage of DIGE as a powerful tool for quantitative proteomics study of scarce samples. The dynamic changes in proteomic level of MSCs in response to matrix elasticity were quantitatively characterized and the effect of extracellular stiffness on CSKs organization was elucidated by immunofluorescence, in relation to proteomic behaviors. The implication of these changes on their cellular physiology and function are discussed herein.
Materials and Methods
Cell culture
Immortalized human MSCs (Health Sciences Research Resource Bank, Osaka, Japan) were cultured in Dulbecco’s modified Eagles medium (DMEM); Gibco BRL, NY, USA) supplemented with 10% fetal bovine serum (FBS; Gibco BRL), 100 units/ml penicillin and 100 μg/ml streptomycin. Cells were maintained on tissue culture polystyrene dishes (TCPS) at 37°C under 5% CO2 in a humidified incubator. The hMSC passages 4–7 were used in this study. For DIGE analysis, the hMSCs were seeded at density 2500 cells/cm2 on TCPS, soft and hard gels for 3 weeks with every 3–4 days replacement of fresh medium.
Preparation of gelatinous gels with different surface elasticity
Cell adhesive hydrogels with different surface elasticity were prepared from gelatin based on photo gelation method. For preparation of the gel, photocurable styrenated gelatin (StG) synthesized in-house was employed (Kidoaki and Matsuda, 2008; Kawano and Kidoaki, 2011). A sol solution of phosphate buffer saline (PBS) including StG (30% w/w; degree of derivatization: 100%) and water-soluble carboxylated camphorquinone (Okino et al., 2002) (0.1% w/v of gelatin) was spread between the vinyl-silanized glass substrate and the poly(N-isopropylacrylamide) coated glass substrate, and was irradiated by visible light with intensity of 100 mW/cm2 (measured at 488 nm) for 40–360 s. The detached gels were immersed overnight with gently rocking in PBS for complete swelling of the hydrogels. Surface elasticity on each hydrogel was determined by microindentation analysis as previously described (Kawano and Kidoaki, 2011). The force-indentation curves of the gel surface were measured using Atomic Force Microscope (AFM) (NVB100; Olympus Optical Co. Ltd., Tokyo, Japan; AFM controller and software, Nanoscope IIIa; Veeco Instruments, CA, USA) with a silicon-nitride cantilever with a half pyramidal tip and nominal spring constant of 0.02 N/m at 10 randomly selected points (n=10) of 3 different samples (n=3). Young’s Moduli of the surface were evaluated from the force-indentation curves of the gel surface by fitting to the Hertz model (Herzt, 1881; Sheddon, 1965). The prepared hydrogels with average Young modulus 3.3±1.1 kPa and 52.3±30.9 kPa will be referred to in this study as the soft and the hard gel, respectively. The TCPS dishes (elastic modulus∼3 GPa (Callister and Rethwisch, 2000)) were used as the control substrate for MSC culture.
Protein extraction and precipitation
Three pairs of protein samples extracted from controls and tests substrates: Soft gel/TCPS, hard gel/TCPS, and hard gel/soft gel were compared with each other. To obtain statistically relevant data, results from three replicates experiments were matched for each experimental set. Cells were trypsinized from the substrates and the pellets were washed twice with PBS. The pellets were resuspended in DIGE lysis buffer (7M urea, 2M Thiourea, 4% CHAPS, 30 mM Tris pH 8.0 and 1X protease inhibitor cocktail; Sigma, Tokyo, Japan) and left at room temperature for 1 h with vigorously mixing every 20 min. The insoluble material was removed by centrifugation at 2100 rpm, 4°C and the protein in the supernatant was precipitated by cold acetone. The pellets were air-dried and resuspended in DIGE lysis buffer. The protein concentration was determined by using Bio-Rad protein assay reagent according to the manufacturer’s protocol.
Differential in-gel electrophoresis
Saturation labeling
Differential in-gel electrophoresis was performed as previously described (Kantawong et al., 2009a, 2009b, 2009c). Briefly, 5 μg of the extracted proteins were reduced with TCEP (tris (2-carboxyethyl) phosphine) for 1 h at 37°C. The proteins were labeled with fluorescent dye Cy3 and Cy5 using saturation labeling method (2 nmol TCEP and 4 nmol CyDye per 5 μg of protein). The reactions were stopped by adding equal volumes of 2X sample buffer (7M urea, 2M thiourea, 4% w/v CHAPS, 2% v/v IPG buffer pH 4–7 and 2% w/v DTT). The Cy3 and Cy5 labeled proteins were mixed together prior to 2D gel electrophoresis.
2D-gel electrophoresis and image analysis
Two-dimensional gel electrophoresis was performed as previously described (Kantawong et al., 2009a, 2009b, 2009c, 2011). Samples were rehydrated into 24 cm; linear gradient pH 4–7 immobilized pH gradient (IPG) strips and focused on Ettan IPGphor system (GE Healthcare). The isoelectric focusing (IEF) was carried out using the step gradient protocol (30 V 12 h, 300 V 1 h, 600 V 1 h, 1000V 1 h, 8000 V 3 h, 8000 V 8.5 h). The strips were equilibrated for 15 min in 5 ml of reducing solution (6M urea, 100 mM Tris-HCl pH 8.3, 30% (v/v) glycerol, 2% (w/v) SDS, 5 mg/ml DTT) then the proteins were further separated on 12% acrylamide gels. The fluorescent images were obtained by scanning gels on typhoon 9400 scanner (GE healthcare). Cy3 and Cy5 images were scanned at 532/580 nm and 633/670 nm excitation/emission wavelengths, respectively. Image analysis and statistical quantification of the relative protein expression was performed using DeCyder™ V. 5.1 software (GE Healthcare).
Protein digestion, mass spectrometry and protein identification
Preparative gel contained 500 μg of Cy3-labeled protein extracted from hMSC culture on TCPS were run for identification of protein of interest. Selected spots were picked automatically using an Ettan Spot Handling Workstation (Amersham Biosciences, UK). Mass spectrometry (MS) analysis and protein identification were performed as previously described (Kantawong et al., 2009a, 2009b, 2009c, 2011). In gel tryptic digestion was performed and the trypsinzed peptide solutions were transferred to MALDI samples plates (Applied Biosystems, Franingham, MA). Identification of proteins was carried out on MALDI/TOF/TOF mass spectrometer (4700 proteomic analyzer, Applied Biosystems). Mass spectra were obtained over the m/z range of 800–4000 and up to 10 peaks were selected for the MS/MS analysis. Protein identification was performed using Global Proteome Sever Explorer software (Applied Biosystems) using the NCBI human protein database. The identification was assigned to a protein spot feature if the protein score was calculated to be greater than 66, correlating with a 95% confidence interval. The protein identifications were assigned using the Mascot search engine, which gives each protein a probability-based MOWSE score. In all cases, variable methionine oxidation was used for searches. An MS tolerance of 1.2 Da for MS and 0.4 Da for MS/MS analysis was used. Only proteins identified with a MOWSE score of greater than 66 were considered as statistically significant (p<0.05).
Protein network and pathway analysis
Proteins that differentially expressed upon different surface elasticity were uploaded to web based pathway analysis tool IPA (Ingenuity Systems, CA, USA) for the possible network and pathway analysis. Based on the large numbers of experimental evidences recorded in IPA database (Ingenuity Knowledge Base), the pathways were deduced among the proteins addressed in our data. The custom pathways were built by using pathway design tools. The molecules of interest were identified as Network Eligibly molecules that served as seeds for generating pathway. IPA then generated hypothetical networks from these proteins by linking them with other proteins that were potentially be included in networks from database, based on known association in the published literatures.
Fluorescence observation for cytoskeletons and focal adhesions
Immunostaining for tubuluin, vimentin and paxillin in the cells cultured on different substrates was performed. For this experiment, the cells were cultured on gel-coated cover slips (diameter 18 mm.). After 24 h or 3 weeks of cultivation, the cells were fixed in 4% paraformaldehyde for 20 min at room temperature. The cells were permeabilized and blocked with 0.5% triton-X, 10% donkey serum in PBS for 45 min. The cells were incubated with primary antibodies, polyclonal anti-mouse; α-tubulin (Sigma, Tokyo, Japan), polyclonal anti-rabbit; vimentin (AnaSpec, Inc., CA, USA) and paxillin (Santa Cruz Biotechnology Inc., CA, USA) and later with secondary antibodies (donkey anti-rabbit/mouse conjugated with Alexa Fluor@488, or donkey anti-rabbit conjugated with Alexa Fluor@568 Invitrogen, Tokyo, Japan). The Rhodaminephalloidin (Cytoskeleton Inc. Denver, Co., USA) was added into this step for staining of F-actin filaments. A Carl Zeiss LSM 510 (Carl Zeiss Microimaging Co. Ltd., Tokyo, Japan) 20X-objective with 3.0–3.4X optical zoom was used for observation of fluorescent signal.
Results
Differential proteomic profiles of MSC on different matrix elasticity
A summary of proteins that differentially expressed in MSCs cultured on different surface elasticity is shown in Table I together with their known biological functions. Twenty-eight protein spots were detected with greater than 1.3 fold average changes in abundance after 3 weeks of culture. The corresponding spot numbers are indicated in the reference gel image (Fig. 1). These proteins were arbitrary categorized according to their possible biological functions (Fig. 2). The details of fold changes of each protein spot and their related functions are provided in supplementary data (Table S1). The majority of proteins (12 out of 28) that changed their expressions in response to matrix stiffness belonged to CSK-related proteins such as tubulin, actin and vimentin. The remaining were groups of protein with diverse functions such as signal transduction and transport processes (14-3-3Z, GAL1, CLIC1, CLIC4, etc), cell proliferation and differentiation (UCHL1, nucleophosmin, P0, enolase, etc), stress response (GST, SOD) and collagen synthesis (P4HA, COL1A).
Table I.
Identification of protein that differentially expressed on different matrix elasticity
| Spot no. |
Protein match |
Function |
fold changes |
| H/TCPS |
S/TCPS |
H/S |
| 1. |
Alpha tubulin |
Cytoskeleton (major component of microtubule) |
−6.74±1.36 |
−4.51±1.15 |
−1.90±1.02 |
| 2. |
Alpha collagen (COL1A) |
Collagen biosynthesis, extracellular matrix structural constituent |
−3.80±1.37 |
−2.83±0.17 |
−1.78±1.04 |
| 3. |
Beta actin |
Cytoskeleton (microfilament) |
−3.19±0.90 |
−3.24±0.27 |
|
| 4. |
Vimentin |
Cytoskeleton (intermediate filament) |
1.47±0.22 |
— |
3.00±1.42 |
| 5. |
Tropomyosin 1 (TPM1) |
Actin binding, structural constituent of cytoskeleton, cytoskeleton organization |
— |
−1.38±0.10 |
1.53±0.12 |
| 6. |
Tropomyosin 2 (TPM2) |
Actin binding, cell motion, tension |
— |
— |
1.56±0.15 |
| 7 |
Tropomyosin 4 (TPM4) |
Actin binding, calcium ion binding, cell motion |
1.60±0.19 |
1.44±0.17 |
1.51±0.61 |
| 8. |
Laminin binding protein (LBP) |
Cell migration, mechanosensing |
1.63±0.02 |
1.74±0.21 |
— |
| 9. |
Actin capping protein G (CapG) |
Inhibit actin bundling |
1.80±0.19 |
1.76±0.32 |
— |
| 10. |
Actin capping protein Z (CapZ) |
Inhibit actin bundling |
2.12±0.09 |
2.17±0.24 |
— |
| 11. |
Microtubule associated proteins (MAP) |
Structural molecule activity, microtubule assembly, depolymerization, stabilization |
1.67±0.02 |
2.04±0.24 |
— |
| 12. |
Myosin light chain II (MYL2) |
Actin monomer binding, structural constituent of muscle |
— |
— |
1.49±0.20 |
| 13. |
Myosin light chain VI (MYL6) |
Motor protein, structural constituent of muscle, muscle filament sliding |
1.72±0.18 |
1.34±0.05 |
— |
| 14. |
Alpha enolase (ENO1) |
Transcription regulator |
−1.53±0.20 |
−1.57±0.07 |
— |
| 15. |
Nucleophosmin (NPM) |
Nulceocytoplasmic transport, positive regulation of cell proliferation |
1.73±0.11 |
2.01±0.15 |
— |
| 16. |
Transltional control tumor protein (TCTP) |
Cell proliferation, anti-apoptosis |
1.86±0.07 |
1.83±0.06 |
— |
| 17. |
Prolyl-4-hydroxylase (PH4A) |
Key enzyme in collagen synthesis |
−2.09±0.25 |
−1.97±0.19 |
— |
| 18. |
Galactin-1 (GAL-1) |
Signal transduction, regulation of apoptosis |
2.15±0.10 |
1.95±0.09 |
— |
| 19. |
Superoxide dismutase (SOD) |
Anti-oxidant, activation of MAPK activity, stress response |
2.15±0.10 |
1.79±0.03 |
1.42±0.63 |
| 20. |
Glutathione S transferase (GST) |
Xenobiotic metabolism signaling, detoxifying enzyme |
2.17±0.07 |
1.77±0.10 |
1.38±0.22 |
| 21. |
Chloride channel 4 (CLIC4) |
Ion transport, signal transduction, differentiation, negative regulation of cell migration |
2.21±0.17 |
1.80±0.08 |
— |
| 22. |
Ubiquitin carboxy-terminal Esterase L1 (UCHL1) |
Cell proliferation, stress response |
2.47±0.16 |
2.57±0.11 |
— |
| 23. |
Chloride channel 1 (CLIC1) |
Ion transport, signal transduction |
3.06±0.71 |
3.05±0.67 |
— |
| 24. |
14-3-3 zeta (YWHAZ) |
Signal transduction, transcription factor binding, protein targeting |
2.13±0.31 |
2.72±0.05 |
|
| 25. |
Heat shock protein 27 (Hsp27) |
Molecular chaperon |
— |
— |
1.51±0.21 |
| 26. |
Annexin V (ANX5) |
Anti-apoptosis, signal transduction |
1.64±0.07 |
1.37±0.11 |
1.49±0.21 |
| 27. |
Cathepsin D (CTSD) |
Lysosomal peptidase |
1.58±0.18 |
— |
1.43±0.09 |
| 28. |
Ribosomal protein large subunit P0 (P0) |
Protein synthesis, translational elongation |
1.51±0.25 |
1.49±0.14 |
— |


Comparisons of the up- or down-regulated degree of expression of those proteins on the different culture surfaces are shown in Fig. 3. Three sets of the comparison on hard gels against TCPS (Fig. 3A), soft gels against TCPS (Fig. 3B) and hard gels against soft gels (Fig. 3C) were demonstrated. Proteomic expression patterns observed on the gel matrices against TCPS showed almost similar trends with some minor differences (Fig. 3A and 3B). In both hard and soft gels against TCPS, significant down-regulation of α-tubulin and β-actin was observed, together with up-regulation of inhibitory proteins for actin bundling or organization such as actin capping proteins G and Z. As for the minor differences between hard and soft gels, up-regulated proteins on the hard gels only were CLCI4, cathepsin D and vimentin, whereas tropomyosin 1 was down-regulated only on soft gels.
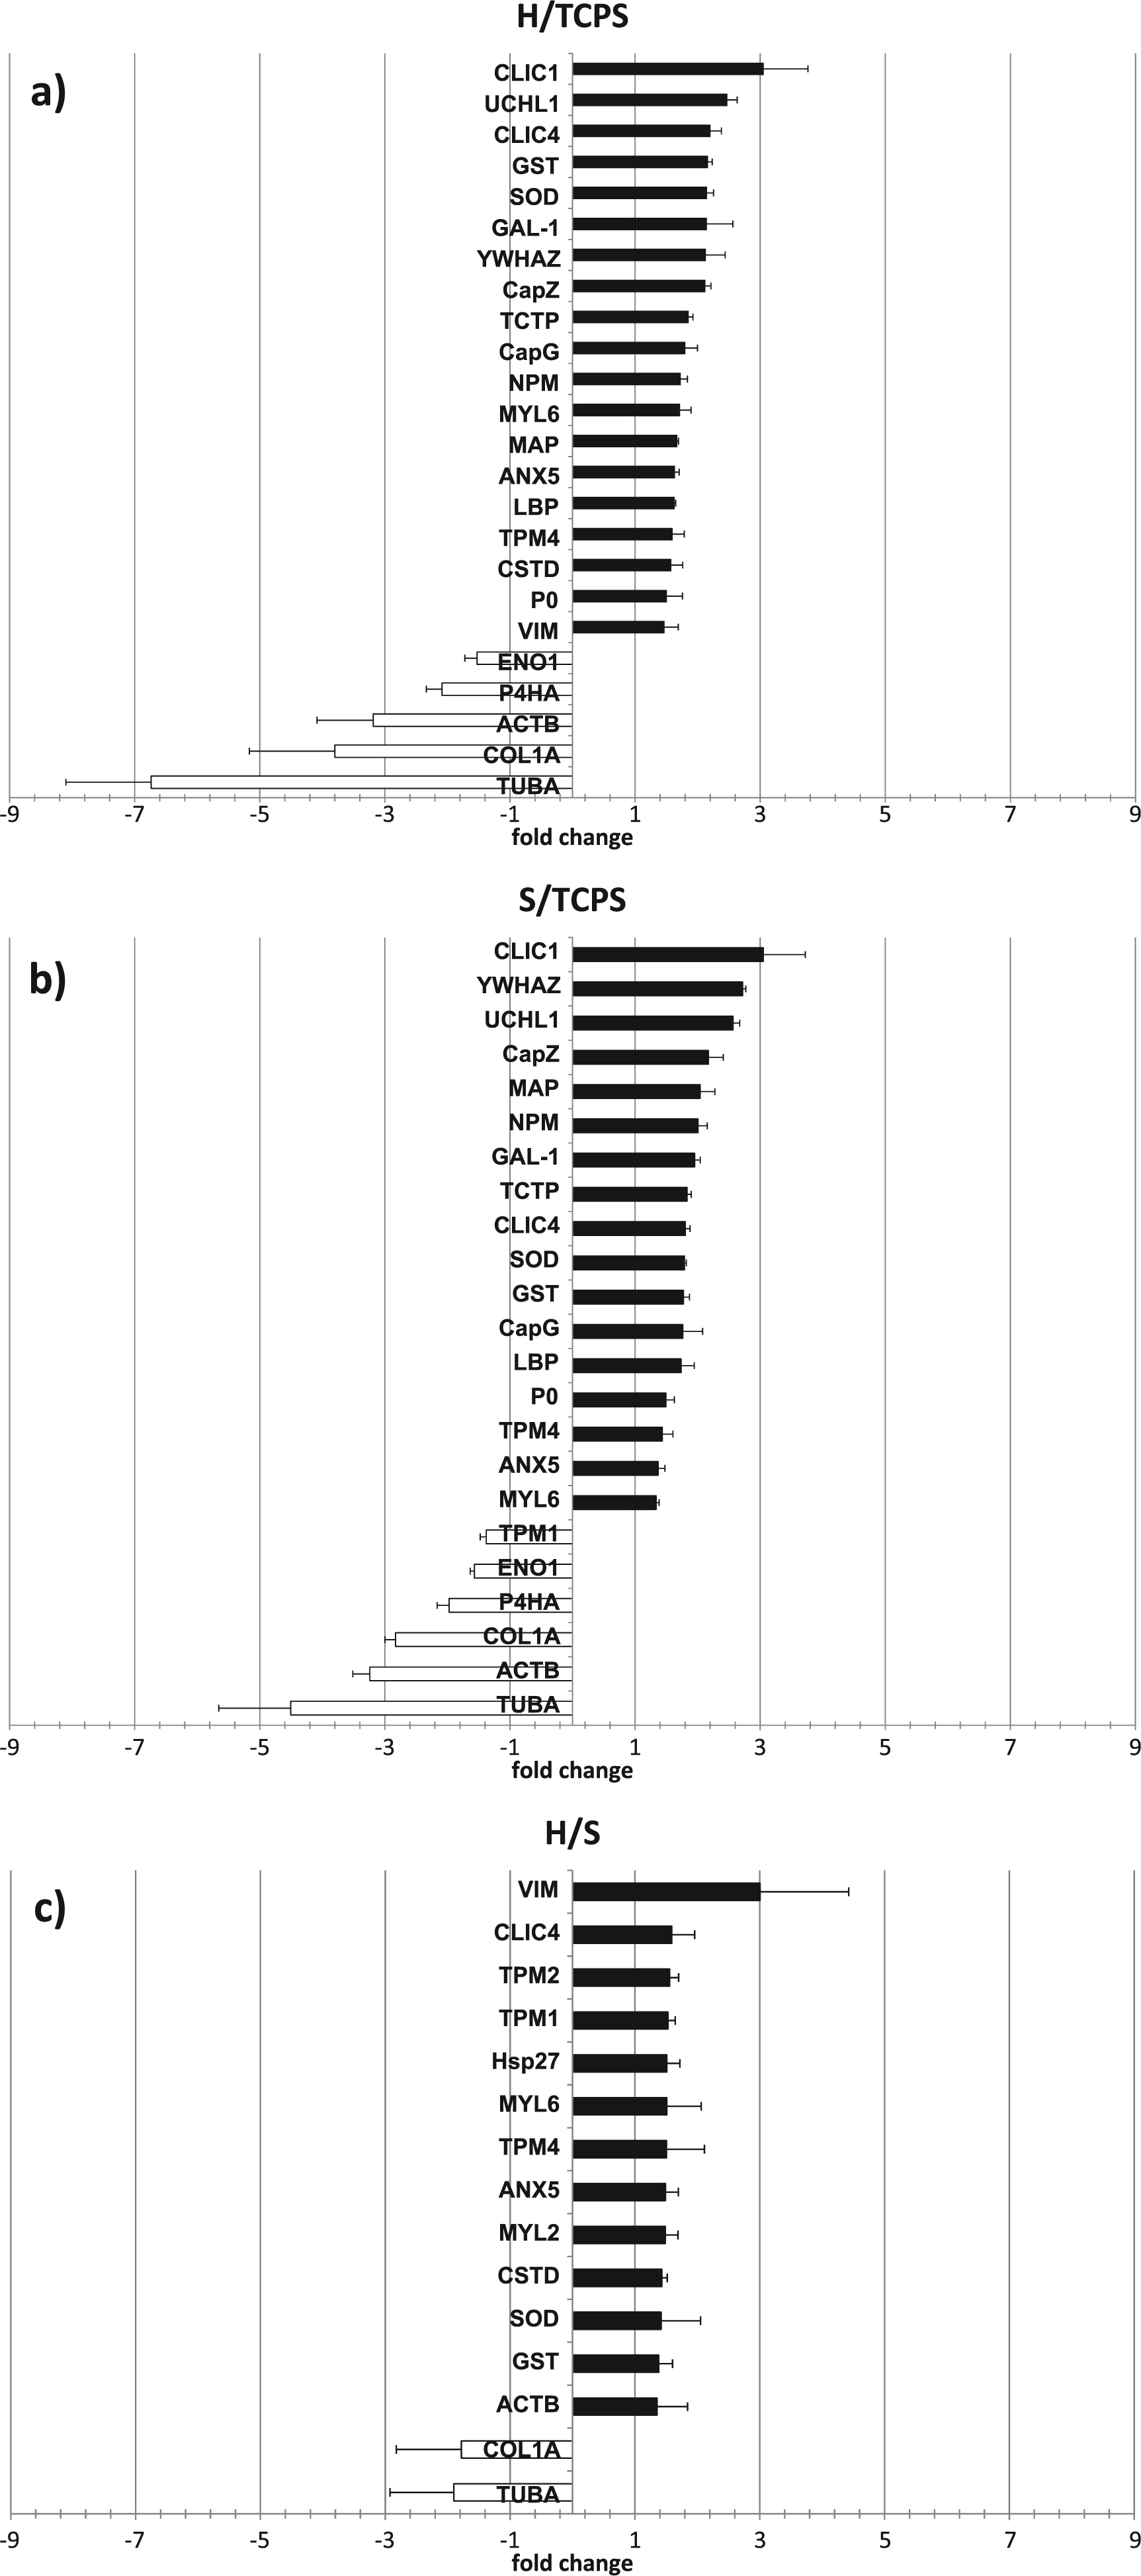
Direct comparison of the differential proteomic expression between hard and soft gels revealed differences in their expression profiles (Fig. 3C). Up-regulated proteins detected only in this comparison were tropomyosin 2, heat shock protein 27 and myosin light chain II. In comparison to the soft gels, cells cultured on hard gels show marked up-regulation of vimentin and decreased expression of tubulin. Peak volumes analysis and log abundance of vimentin and α-tubulin are shown in supplementary data (Fig. S1).
In summary, the following trends were noted for CSK proteins: (1) on the gel surface compared with TCPS, α-tubulin and β-actin were down-regulated, (2) on the hard gels compared with soft gels, α-tubulin was down-regulated and vimentin was up-regulated.
Substrate-elasticity-dependent cytoskeletal features of MSC
After 24 hr cultured on the substrates with different surface-elasticity, the isolated cells changed their cytoskeletal features as demonstrated by immunofluorescence (Fig. 4 and Fig. S2–5). While rigid glass substrates induced thick stress fibers, the cells on softer matrices showed significant less bundling of actin filaments (Fig. 4a and Fig. S2). The microtubule (MT) structures in the cells, particularly those on the very soft substrate exhibited a notable disassembly of microtubule structures (Fig. 4b and Fig. S3). The intermediate filaments (IFs), vimentin, exhibited less organization on the softest substrate (Fig. 4c and Fig. S4). Furthermore, the formation of mature focal adhesions was also reduced as the elasticity of the gels decreased (Fig. 4d and Fig. S5).

The CSK was also examined after 3 weeks of culture (Fig. 5). In contrast to the observation for single cells in Fig. 4, abundant actin stress fibers could be observed for all samples. On the other hand in the comparison between the control and test materials, the glass induced a highly denser stress fibers than the soft and hard gels did. In addition, the density of the stress fibers appeared to be lower on the softest gels, although, interestingly, the fibers appeared more polarized (Fig. 5a).

In the densely confluent cells where the MTs were poorly resolved, slightly different organization of the structures on different stiffness still could be observed (Fig. 5b). On the glass substrates, though not so clear as in the single cell observations, filamentous MTs were still noticeable. The cells showed strong association of MTs, as demonstrated by an intense staining of tubulin at the cell periphery. This staining pattern was reduced in the cells cultured on soft gels whereas those on the hard gel showed no remarkable association of MT structures.
The substrate mechanical properties demonstrated the most profound effects on the organization of the IFs. The well-defined filamentous vimentin structures were evident only in the cells that grown on the hard gels (Fig. 5c). No detectable lattice was observed in the confluent monolayer of the cells cultured on the glass or the softest gels.
Network analysis of identified proteins
IPA software was used to generate interactive networks of proteins in MSCs that change their expression in response to different surface elasticity in order to help explain biological relevance of the identified proteins. The pathways predicted from the published literatures (see supplementary excel file) are shown in Fig. 6, demonstrating how the proteins interact with each other along with their sub-cellular localization. The up- and down-regulated proteins are shown in blue and red, respectively. The proteins that exhibit direct (solid lines) or indirect relationships (dashed lines) with our input proteins were included in the network. The comparison between protein profiles of cells cultured on the hard gels against TCPS (Fig. 6a) and that of the soft gels against TCPS (Fig. 6b) revealed the significant affect of surface elasticity on cell physiology. The CSK related proteins were highlighted at the center since these proteins showed significant up and down regulation in our system. While generally sharing similar trends, some minor differences can be observed between 2 pathways. Substrate elasticity appeared to induce universal down-regulation of CSK proteins in both conditions. The pathway of MSCs proteoms on hard gels illustrated an effect derived from the substrates on vimentin, whereas on the soft gels, affect on a group of tropomyosin proteins was noted.

Discussion
Recent evidence strongly suggests that besides the extensively studied soluble factors, mechanical signals are also potent regulators of stem cell behavior (Engler et al., 2006; Rowlands et al., 2008; Evans et al., 2009; Seib et al., 2009). Elucidation of the underlying mechanism of this mechanical modulation of stem cell functions is important for tissue engineering applications. This study aimed to extend our knowledge on the substrate-stiffness-induced mechanotransduction in MSCs by the DIGE-based proteomic analysis, focusing on the contribution of major CSKs-related proteins. Although previous genomic approaches, including transcriptome analysis, have provided informative data on the matrix-stiffness-dependent differences in the expressed mRNA transcripts (Engler et al., 2006; Rowlands et al., 2008), insufficient correlation between changes in expression levels of mRNAs and proteins is sometimes inevitable due to factors such as the stability of mRNA or post-translational modification.
In this study, to characterize the substrate-stiffness-induced MSC behaviors more directly, DIGE-based proteomic investigation was applied for immortalized MSCs (Kassem et al., 2004; Abdallah et al., 2005). Summarizing the trends observed in the DIGE data, we observe: (1) on the gel surfaces compared to TCPS, α-tubulin and β-actin were strongly down-regulated, (2) on the hard gel surface compared with soft gel surface, α-tubulin was down-regulated and vimentin up-regulated.
The effect of substrate elasticity appeared to be strongest on the expression of α-tubulin, which was 6 and 4 fold down-regulated in the cells cultured on the hard and soft gels compared with TCPS. This was further highlighted by immunofluorescence. The α-tubulin forms heterodimer with β-tubulin as the building block of microtubule structures. The stability of the dimer depends on the presence of GTP-bound β-tubulin (Cleveland et al., 1980). We note, however, that no significant difference in β-tubulin expression abundance could be observed between different substrates in our study (data not shown). Our data is consistent with the previous report that the human trabecular mesh-work cells grown on stiff polyacrylamide gels expressed less tubulin than those on TCPS or soft gels (Schlunck et al., 2008). They suggested that the delay of degradation of tubulin monomer was caused by a lack of binding between the cells and the extracellular matrix (ECM) (Mooney et al., 1994). Concomitant with the reduction in stress fiber bundling shown by phalloidin staining, our DIGE data demonstrated a 3-fold down regulation of β-actin expression in cells cultured on gelatinous gels (soft and hard) compared with TCPS.
In addition to α-tubulin and β-actin, our data showed vimentin as being mechano-responsive. Direct comparison of differential expression degree of vimentin between hard and soft gels showed marked 3-fold up-regulation of vimentin on the hard gels (Fig. 3). Cell shape was more spread and flattened, and the structure of the IFs exhibited a more developed lattice on the hard gels than on the soft gels. These observations appear to suggest that harder substrate may induce the well-spread cell shape, well-developed IF structure, and hence a higher degree of vimentin expression. Again, these results tie in with those seen in other systems with either poorly or well spread cells (Ben-Ze’ev, 1983; Matesic et al., 1997).
Besides the above-mentioned changes in CSK protein expression, several proteins that play pivotal role in cellular physiology and functions were also found to change their expression profiles in response to the mechanical conditions of the underlying substrates:
(1) Proteins with highest modulation are chloride channels. We observed significant up-regulation of CLIC11 and CLIC4 in the cells cultured on both hard and soft gels. Chloride channels are important for maintaining resting membrane potential together with potassium channels (Hill et al., 1996). These proteins play important roles in a variety of cellular events such as organic solute transport, cell migration, cell proliferation and differentiation. Mechano-activated chloride channels are represented by various types of Cl– channels, they may be activated by different mechanical mechanisms depending on the cell type (Nilius et al., 1996).
(2) Ubiquitin carboxyterminal esterase L1 (UCHL1), which belongs to the family of enzymes responsible for hydrolyzing carboxyl terminal esters and amides of ubiquitin, were found to be up-regulated on the soft and hard gels. A recent report suggests that UCHL1 can inhibit MT formation in a ubiquitination-dependent manner (Bheda et al., 2010). Up-regulation of this enzyme may partly contribute to the depolymerization of MTs observed in our study.
(3) Down-regulation of proteins related to collagen synthesis, COLA1 and P4HA, was evidenced on the gel surfaces. Decreased expression of key enzyme in biosynthesis of collagen, P4HA, and the most abundant form of collagen in the human body, COL1A1, may partly related to the affect of CSK tension generated by underlying substrate. For instance, disruption of actin CSK with cytochalasin D decreases collagen accumulation (Hubchak et al., 2003). It has also been shown that TGF-β1-mediated collagen I accumulation is associated with CSK rearrangement and Rho-GTPase signaling (Hubchak et al., 2003), which were mediated by matrix elasticity and CSK tension-dependent signaling (Arora et al., 1999).
IPA software was used to generate interactive networks by linking the proteins that based on the published literatures (supplementary excel file), known to interact with the identified proteins in this study. When consider CSKs as a central hub, the predicted pathway demonstrated the interconnectedness between several proteins with important biological functions. For example, proteins related to signal transduction (YWHAZ) and transport processes (Cl-channels), which up-regulated in our study, exhibited direct interaction with CSKs. The CLCI4 binds directly to brain dynamin I in a complex containing actin, tubulin and YWHAZ (Suginta et al., 2001). The YWHAZ proteins are involved in most of the cellular processes such as cell signaling, division, apoptosis and cytoskeletal organization (Aitken et al., 1995; van Hemert et al., 2001). They have overall inhibitory effect on cell cycle progression and involved in mediating integrin-induced cytoskeletal changes via RhoGTPase activation. Tropomyosin family of CSKs plays a role in stabilizing actin microfilament (Shah et al., 2001). Many isoforms including TPM1 are down-regulated in transformed cells. The tropomyosin molecules played a dual role of both mechanical and chemical regulation of actin monomers (Honda et al., 1996). All TPMs bind to actin with varying affinities and the precise function of each isoforms remain largely unknown. In our study, comparison between cells cultured on gelatinous gels and TCPS revealed the changes in the expression of TPMs family, emphasizing the effect of mechanical microenvironment to the CSKs. From these observations, the predicted pathway illustrated how the mechanical signal affect CSKs and transduce message to the downstream effecter molecules. With the additional verification approach, the identified networks do provide a useful potential pathway for future studies of these relationships
The proteomic expression profiles of the major CSK proteins show a dependency on the substrate elasticity analyzed by 2D-DIGE. This suggests that the expression levels of CSK proteins appear to be related to structural features and mechanical balancing of MTs, MFs, and IFs. Our data suggests that the mechanical conditions (stiffness) of ECM influence intracellular tension through CSK architecture (likely through focal adhesion regulation), thus contributing to cell shape determination. The most plausible explanation for this manner of CSK/stiffness relationship to control intracellular tension balance is cellular tensegrity as proposed by Ingber (Ingber, 2008). The cellular tensegrity theory states that MF (tensional unit), IF (tensional unit), and MT (anti-compressive struts) form a stable total CSK architecture realizing tensional integrity under the dynamical regulation of a mechanical balance with ECM (Ingber, 2003). In deed, from CSK disruption experiments using drugs, it has been shown that MT disruption by colchicine induces an increase in tractional force for ECM due to compensation balancing for remained tensional stress from higher fraction of the actin (Danowski, 1989; Kolodney and Wysolmerski, 1992; Kolodney and Elson, 1995; Wang et al., 2001). In contrast, depolymerization of F-actin by cytochalasin is associated with a decrease in the tractional force (Kolodney and Wysolmerski, 1992; Eckes et al., 1998). IFs disruption by acrylamide reduce cell stiffness and prestress (Wang and Stamenovic, 2000), inducing decrease in traction force. Further quantification of CSKs might provide a better understanding of how the substrate stiffness modulates the CSK organization in correlation with cellular tensegrity balance.
In our results, increase in elasticity of the gel surface was associated with down-regulation of α-tubulin and up-regulation of vimentin. Since the gel surface with higher elasticity modulus bears larger traction force from cells (Wang et al., 2000), contribution to intracellular prestress from the tensional units such as MF and IF should be increased to balance with the higher anti-tractional force generated on gel surface, while the compressive units of MT may be reduced due to its relatively lowered contribution to the prestress. This means that substrate mechanics could modulate cellular prestress, tensegirty balance by regulation of the amount of CSK monomers supplied to produce filamentous proteins. We hypothesized that our results suggest that the substrate-stiffness-dependent mechanotransduction in MSCs, which have been shown to control the fate of the cells (McBeath et al., 2004; Engler et al., 2006; Kilian et al., 2010; McMurray et al., 2011), may be, at least partially, related to the tensegrity behaviors of their CSK components.
It should be noted that in our system, we could be able to detect lineage specification marker of stem cells cultured on gel (Fig. S6). The expression of early neurogenic marker β3 tubulin and the early osteogenic marker Runx2 was highest on the soft and hard gels, respectively. These results indicated that the gel stiffness could initially guide the stem cells fate. However, from DIGE analysis after 3 weeks culture, it was not clear whether the cells we studied at this time point could reach terminal differentiation or not. Limited expression of the late markers for differentiation also reported in matrix elasticity induced stem cell differentiation (Engler et al., 2006) as the expression of some terminal markers such as lineage specific integrin of myoblast-like cells was not evidenced. In our study, for the cells on the hard gels, protein related to collagen synthesis during osteogenic differentiation and osteogenic marker such as P4HA (Pihlajaniemi et al., 1991) and collagen I were still down-regulated. As the changes in expression abundance of the differentiating cells respond to mechanical stimuli appeared to be time dependent (Kantawong et al., 2009c), further investigation of proteomic profiles of cells culture on gels at different time point will provide a better understanding of dynamic of protein changes upon differentiation.
Conclusion
Proteomic analysis of MSCs cultured on gelatinous hydro-gels with tuned surface elasticity was performed by 2D-DIGE. Large changes in the abundance of CSK proteins was noted, in agreement with alterations in CSK organization. These results suggested that the substrate stiffness significantly affects expression balances in cytoskeletal proteins of MSCs with some implications to cellular tensegrity.
Acknowledgments
The authors sincerely thank Prof. Takehisa Matsuda of Kanazawa Institute of Technology, Japan, for his assistance with the synthesis of styrenated gelatins. We thank to Mr Yusuke Shinohara, Dr. Takahito Kawano, Dr. Tatsuya Okuda from Kyushu University and Dr. Kamburapola Jayawardena from University of Glasgow for their technical assistance. This work was supported by the following grants: Management Expenses Grants for National Universities Corporations “Nano-Macro Materials, Devices and System Research Alliance from” from the Ministry of Education, Culture, Sports, Science and Technology (MEXT) of Japan, the PRESTO program “Nanosystems and Emergent Functions” from the Japan Science Technology (JST) Agency, and Funding Program for World-Leading Innovative R&D on Science and Technology “Innovative NanoBiodevice based on Single Molecule Analysis” from Cabinet Office, Government Of Japan.
References
- Abdallah, B.M., Haack-Sorensen, M., Burns, J.S., Elsnab, B., Jakob, F., Hokland, P., and Kassem, M. 2005. Maintenance of differentiation potential of human bone marrow mesenchymal stem cells immortalized by human telomerase reverse transcriptase gene despite [corrected] extensive proliferation. Biochem. Biophys. Res. Commun., 326: 527–538.
- Aitken, A., Jones, D., Soneji, Y., and Howell, S. 1995. 14-3-3 proteins: biological function and domain structure. Biochem. Soc. Trans., 23: 605–611.
- Arora, P.D., Narani, N., McCulloch, C.A. 1999. The compliance of collagen gels regulates transforming growth factor-beta induction of alpha-smooth muscle actin in fibroblasts. Am. J. Pathol., 154: 871–882.
- Ben-Ze’ev, A. 1983. Cell configuration-related control of vimentin biosynthesis and phosphorylation in cultured mammalian cells. J. Cell Biol., 97: 858–865.
- Benoit, D.S., Schwartz, M.P., Durney, A.R., and Anseth, K.S. 2008. Small functional groups for controlled differentiation of hydrogel-encapsulated human mesenchymal stem cells. Nat. Mater., 7: 816–823.
- Bheda, A., Gullapalli, A., Caplow, M., Pagano, J.S., and Shackelford, J. 2010. Ubiquitin editing enzyme UCH L1 and microtubule dynamics: implication in mitosis. Cell Cycle, 9: 980–994.
- Bianco, P., Riminucci, M., Gronthos, S., and Robey, P.G. 2001. Bone marrow stromal stem cells: nature, biology, and potential applications. Stem Cells, 19: 180–192.
- Callister, W. and Rethwisch, D. 2000. Fundamentals of Materials Science and Engineering: An Interactive E-Text, Wiely, Somerset, NJ, ed.5
- Cleveland, D.W., Lopata, M.A., MacDonald, R.J., Cowan, N.J., Rutter, W.J., and Kirschner, M.W. 1980. Number and evolutionary conservation of alpha- and beta-tubulin and cytoplasmic beta- and gamma-actin genes using specific cloned cDNA probes. Cell, 20: 95–105.
- Curran, J.M., Chen, R., Hunt, J.A. 2005. Controlling the phenotype and function of mesenchymal stem cells in vitro by adhesion to silane-modified clean glass surfaces. Biomaterials, 26: 7057–7067.
- Curran, J.M., Stokes, R., Irvine, E., Graham, D., Amro, N.A., Sanedrin, R.G., Jamil, H., and Hunt, J.A. 2010. Introducing dip pen nanolithography as a tool for controlling stem cell behaviour: unlocking the potential of the next generation of smart materials in regenerative medicine. Lab. Chip., 10: 1662–1670.
- Dalby, M.J., Gadegaard, N., Tare, R., Andar, A., Riehle, M.O., Herzyk, P., Wilkinson, C.D., and Oreffo, R.O. 2007. The control of human mesenchymal cell differentiation using nanoscale symmetry and disorder. Nat. Mater., 6: 997–1003.
- Danowski, B.A. 1989. Fibroblast contractility and actin organization are stimulated by microtubule inhibitors. J. Cell Sci., 93 (Pt 2): 255–266.
- Davies, P.F., Barbee, K.A., Volin, M.V., Robotewskyj, A., Chen, J., Joseph, L., Griem, M.L., Wernick, M.N., Jacobs, E., Polacek, D.C., dePaola, N., and Barakat, A.I. 1997. Spatial relationships in early signaling events of flow-mediated endothelial mechanotransduction. Annu. Rev. Physiol., 59: 527–549.
- Discher, D.E., Janmey, P., Wang, Y.L. 2005. Tissue cells feel and respond to the stiffness of their substrate. Science, 310: 1139–1143.
- Eckes, B., Dogic, D., Colucci-Guyon, E., Wang, N., Maniotis, A., Ingber, D., Merckling, A., Langa, F., Aumailley, M., Delouvee, A., Koteliansky, V., Babinet, C., and Krieg, T. 1998. Impaired mechanical stability, migration and contractile capacity in vimentin-deficient fibroblasts. J. Cell Sci., 111 (Pt 13): 1897–1907.
- Engler, A.J., Sen, S., Sweeney, H.L., and Discher, D.E. 2006. Matrix elasticity directs stem cell lineage specification. Cell, 126: 677–689.
- Evans, N.D., Minelli, C., Gentleman, E., LaPointe, V., Patankar, S.N., Kallivretaki, M., Chen, X., Roberts, C.J., and Stevens, M.M. 2009. Substrate stiffness affects early differentiation events in embryonic stem cells. Eur. Cell Mater., 18: 1–13; discussion 13–14.
- Gilbert, P.M., Havenstrite, K.L., Magnusson, K.E., Sacco, A., Leonardi, N.A., Kraft, P., Nguyen, N.K., Thrun, S., Lutolf, M.P., and Blau, H.M. 2010. Substrate Elasticity Regulates Skeletal Muscle Stem Cell Self-Renewal in Culture. Science, 329: 1078–1081.
- Grabowski, E.F., Jaffe, E.A., Weksler, B.B. 1985. Prostacyclin production by cultured endothelial cell monolayers exposed to step increases in shear stress. J. Lab. Clin. Med., 105: 36–43.
- Herzt, H. 1881. Ueber die Beruhrrung fester elastischer Korper. J. Reine. Angew. Mathematik, 92: 156–171.
- Hill, P.B., Martin, R.J., Miller, H.R. 1996. Characterization of whole-cell currents in mucosal and connective tissue rat mast cells using amphotericin-B-perforated patches and temperature control. Pflugers. Arch., 432: 986–994.
- Honda, H., Kitano, Y., Hatori, K., and Matsuno, K. 1996. Dual role of tropomyosin on chemically modified actin filaments from skeletal muscle. FEBS letters, 383: 55–58.
- Hubchak, S.C., Runyan, C.E., Kreisberg, J.I., and Schnaper, H.W. 2003. Cytoskeletal rearrangement and signal transduction in TGF-beta1-stimulated mesangial cell collagen accumulation. J. Am. Soc. Nephrol., 14: 1969–1980.
- Ingber, D.E. 2003. Tensegrity I. Cell structure and hierarchical systems biology. J. Cell Sci., 116: 1157–1173.
- Ingber, D.E. 2008. Tensegrity-based mechanosensing from macro to micro. Prog. Biophys. Mol. Biol., 97: 163–179.
- Jung, Y., Kim, S.H., Kim, S.H., Kim, Y.H., Xie, J., Matsuda, T., and Min, B.G. 2008. Cartilaginous tissue formation using a mechano-active scaffold and dynamic compressive stimulation. J. Biomater. Sci. Polym., Ed 19: 61–74.
- Kantawong, F., Burchmore, R., Gadegaard, N., Oreffo, R.O., and Dalby, M.J. 2009a. Proteomic analysis of human osteoprogenitor response to disordered nanotopography. J. Royal Soc. Interface, 6: 1075–1086.
- Kantawong, F., Burchmore, R., Wilkinson, C.D., Oreffo, R.O., and Dalby, M.J. 2009b. Differential in-gel electrophoresis (DIGE) analysis of human bone marrow osteoprogenitor cell contact guidance. Acta biomaterialia, 5: 1137–1146.
- Kantawong, F., Burgess, K.E., Jayawardena, K., Hart, A., Burchmore, R.J., Gadegaard, N., Oreffo, R.O., and Dalby, M.J. 2009c. Whole proteome analysis of osteoprogenitor differentiation induced by disordered nano-topography and mediated by ERK signalling. Biomaterials, 30: 4723–4731.
- Kantawong, F., Burgess, K.E., Jayawardena, K., Hart, A., Riehle, M.O., Oreffo, R.O., Dalby, M.J., and Burchmore, R. 2011. Effects of a surface topography composite with puerariae radix on human STRO-1-positive stem cells. Acta biomaterialia, 6: 3694–3703.
- Kassem, M., Kristiansen, M., Abdallah, B.M. 2004. Mesenchymal stem cells: cell biology and potential use in therapy. Basic Clin. Pharmacol. Toxicol., 95: 209–214.
- Kawano, T. and Kidoaki, S. 2011. Elasticity boundary conditions required for cell mechanotaxis on microelastically-patterned gels. Biomaterials, 32: 2725–2733.
- Kidoaki, S. and Matsuda, T. 2008. Microelastic gradient gelatinous gels to induce cellular mechanotaxis. J. Biotechnol., 133: 225–230.
- Kilian, K.A., Bugarija, B., Lahn, B.T., and Mrksich, M. 2010. Geometric cues for directing the differentiation of mesenchymal stem cells. Proc. Natl. Acad. Sci. USA, 107: 4872–4877.
- Kocgozlu, L., Lavalle, P., Koenig, G., Senger, B., Haikel, Y., Schaaf, P., Voegel, J.C., Tenenbaum, H., and Vautier, D. 2010. Selective and uncoupled role of substrate elasticity in the regulation of replication and transcription in epithelial cells. J. Cell Sci., 123: 29–39.
- Kolodney, M.S. and Wysolmerski, R.B. 1992. Isometric contraction by fibroblasts and endothelial cells in tissue culture: a quantitative study. J. Cell Biol., 117: 73–82.
- Kolodney, M.S. and Elson, E.L. 1995. Contraction due to microtubule disruption is associated with increased phosphorylation of myosin regulatory light chain. Proc. Natl. Acad. Sci. USA, 92: 10252–10256.
- Korenaga, R., Ando, J., Tsuboi, H., Yang, W., Sakuma, I., Toyo-oka, T., and Kamiya, A. 1994. Laminar flow stimulates ATP- and shear stressdependent nitric oxide production in cultured bovine endothelial cells. Biochem. Biophys. Res. Commun., 198: 213–219.
- Lo, C.M., Wang, H.B., Dembo, M., and Wang, Y.L. 2000. Cell movement is guided by the rigidity of the substrate. Biophys. J., 79: 144–152.
- Matesic, D., Attardi, B., Dellovade, T., Pfaff, D., and Germak, J. 1997. Differential LHRH secretion, dye coupling, and protein expression in two morphologically distinct cell types identified in GT1-7 cultures. J. Neuroendocrinol., 9: 467–478.
- McBeath, R., Pirone, D.M., Nelson, C.M., Bhadriraju, K., and Chen, C.S. 2004. Cell shape, cytoskeletal tension, and RhoA regulate stem cell lineage commitment. Dev. Cell, 6: 483–495.
- McMurray, R.J., Gadegaard, N., Tsimbouri, P.M., Burgess, K.V., McNamara, L.E., Tare, R., Murawski, K., Kingham, E., Oreffo, R.O., and Dalby, M.J. 2011. Nanoscale surfaces for the long-term maintenance of mesenchymal stem cell phenotype and multipotency. Nat. Mater., 10: 637–644.
- Milner, P., Kirkpatrick, K.A., Ralevic, V., Toothill, V., Pearson, J., and Burnstock, G. 1990. Endothelial cells cultured from human umbilical vein release ATP, substance P and acetylcholine in response to increased flow. Proc. Biol. Sci., 241: 245–248.
- Mooney, D.J., Hansen, L.K., Langer, R., Vacanti, J.P., and Ingber, D.E. 1994. Extracellular matrix controls tubulin monomer levels in hepatocytes by regulating protein turnover. Mol. Biol. Cell, 5: 1281–1288.
- Nilius, B., Eggermont, J., Voets, T., and Droogmans, G. 1996. Volumeactivated Cl-channels. Gen. Pharmacol., 27: 1131–1140.
- Oh, S., Brammer, K.S., Li, Y.S., Teng, D., Engler, A.J., Chien, S., and Jin, S. 2009. Stem cell fate dictated solely by altered nanotube dimension. Proc. Natl. Acad. Sci. USA, 106: 2130–2135.
- Okino, H., Nakayama, Y., Tanaka, M., and Matsuda, T. 2002. In situ hydrogelation of photocurable gelatin and drug release. J. Biomed. Mater. Res., 59: 233–245.
- Pelham, R.J., Jr. and Wang, Y. 1997. Cell locomotion and focal adhesions are regulated by substrate flexibility. Proc. Natl. Acad. Sci. USA, 94: 13661–13665.
- Peyton, S.R., Raub, C.B., Keschrumrus, V.P., and Putnam, A.J. 2006. The use of poly(ethylene glycol) hydrogels to investigate the impact of ECM chemistry and mechanics on smooth muscle cells. Biomaterials, 27: 4881–4893.
- Pihlajaniemi, T., Myllyla, R., Kivirikko, K.I. 1991. Prolyl 4-hydroxylase and its role in collagen synthesis. J. hepatol., 13 Suppl 3: S2–7.
- Pittenger, M.F., Mackay, A.M., Beck, S.C., Jaiswal, R.K., Douglas, R., Mosca, J.D., Moorman, M.A., Simonetti, D.W., Craig, S., and Marshak, D.R. 1999. Multilineage potential of adult human mesenchymal stem cells. Science, 284: 143–147.
- Reijnders, C.M., Bravenboer, N., Holzmann, P.J., Bhoelan, F., Blankenstein, M.A., and Lips, P. 2007. In vivo mechanical loading modulates insulin-like growth factor binding protein-2 gene expression in rat osteocytes. Calcif. Tissue Int., 80: 137–143.
- Rowlands, A.S., George, P.A., Cooper-White, J.J. 2008. Directing osteogenic and myogenic differentiation of MSCs: interplay of stiffness and adhesive ligand presentation. Am. J. Physiol. Cell Physiol., 295: C1037–1044.
- Saha, K., Keung, A.J., Irwin, E.F., Li, Y., Little, L., Schaffer, D.V., and Healy, K.E. 2008. Substrate modulus directs neural stem cell behavior. Biophys. J., 95: 4426–4438.
- Schlunck, G., Han, H., Wecker, T., Kampik, D., Meyer-ter-Vehn, T., and Grehn, F. 2008. Substrate rigidity modulates cell matrix interactions and protein expression in human trabecular meshwork cells. Invest. Ophthalmol. Vis. Sci., 49: 262–269.
- Seib, F.P., Prewitz, M., Werner, C., and Bornhauser, M., 2009. Matrix elasticity regulates the secretory profile of human bone marrow-derived multipotent mesenchymal stromal cells (MSCs). Biochem. Biophys. Res. Commun., 389: 663–667.
- Shah, V., Bharadwaj, S., Kaibuchi, K., and Prasad, G.L. 2001. Cytoskeletal organization in tropomyosin-mediated reversion of ras-transformation: Evidence for Rho kinase pathway. Oncogene, 20: 2112–2121.
- Sheddon, I.N. 1965. The relation between load and penetration in the axisymmetric Boussinesq problem for a punch of arbitrary profile. Int. J. Eng. Sci., 3: 47–57.
- Smith, R.L., Donlon, B.S., Gupta, M.K., Mohtai, M., Das, P., Carter, D.R., Cooke, J., Gibbons, G., Hutchinson, N., and Schurman, D.J. 1995. Effects of fluid-induced shear on articular chondrocyte morphology and metabolism in vitro. J. Orthop. Res., 13: 824–831.
- Suginta, W., Karoulias, N., Aitken, A., and Ashley, R.H. 2001. Chloride intracellular channel protein CLIC4 (p64H1) binds directly to brain dynamin I in a complex containing actin, tubulin and 14-3-3 isoforms. Biochem. J., 359: 55–64.
- van Hemert, M.J., Steensma, H.Y., van Heusden, G.P. 2001. 14-3-3 proteins: key regulators of cell division, signalling and apoptosis. Bioessays, 23: 936–946.
- Wang, H.B., Dembo, M., Wang, Y.L. 2000. Substrate flexibility regulates growth and apoptosis of normal but not transformed cells. Am. J. Physiol. Cell Physiol., 279: C1345–1350.
- Wang, N., Butler, J.P., Ingber, D.E. 1993. Mechanotransduction across the cell surface and through the cytoskeleton. Science, 260: 1124–1127.
- Wang, N. and Stamenovic, D. 2000. Contribution of intermediate filaments to cell stiffness, stiffening, and growth. Am. J. Physiol. Cell Physiol., 279: C188–194.
- Wang, N., Naruse, K., Stamenovic, D., Fredberg, J.J., Mijailovich, S.M., Tolic-Norrelykke, I.M., Polte, T., Mannix, R., and Ingber, D.E. 2001. Mechanical behavior in living cells consistent with the tensegrity model. Proc. Natl. Acad. Sci. USA, 98: 7765–7770.
- Winer, J.P., Janmey, P.A., McCormick, M.E., and Funaki, M. 2009a. Bone marrow-derived human mesenchymal stem cells become quiescent on soft substrates but remain responsive to chemical or mechanical stimuli. Tissue Eng. Part A, 15: 147–154.
- Winer, J.P., Oake, S., Janmey, P.A. 2009b. Non-linear elasticity of extracellular matrices enables contractile cells to communicate local position and orientation. PLoS One, 4: e6382.

