Abstract
The small GTP-binding protein Rho plays a crucial role in a wide variety of cellular functions through various effector proteins. Rho-kinase is a key effector protein of Rho, which is composed of two isoforms, ROCK1 and ROCK2. To clarify the site of action of ROCK1 and ROCK2, we performed immunofluorescence and immunoelectron microscopic analyses using isoform-specific antibodies in mouse tissues. In the large and small intestines, ROCK1 immunoreactivity was predominantly identified in epithelial cells, and ROCK2 immunoreactivity was negligible. In these epithelial cells, ROCK1 immunoreactivity was distributed on plasma membranes, while ROCK1 immunogold signals were localized at cell-cell contacts and cell adhesion sites, especially at the adherens junctions at the ultrastructural level. In the bladder epithelium, however, ROCK1 and ROCK2 signals were identified at intermediate filaments, and ROCK2 signals were also observed in nuclei. In the three types of muscular cells—smooth, cardiac, and skeletal muscle cells—ROCK1 and ROCK2 also showed differential distribution. ROCK1 signals were localized at actin filaments, plasma membranes, and vesicles near plasma membranes in smooth muscle cells; at the lysosomes in skeletal muscle cells; and were undetectable in cardiac muscle cells. ROCK2 signals were localized at actin filaments and centrosomes in smooth muscle cells, at intercalated discs in cardiac muscle cells, and at Z-discs and sarcoplasmic reticulum in skeletal muscle cells. In the brain, ROCK1 immunoreactivity was distributed in glia, whereas ROCK2 immunoreactivity was observed in neurons. These results indicate that the two isoforms of Rho-kinase distribute differentially to accomplish their specific functions.
Introduction
The small GTP-binding protein Rho is a key molecule that controls a wide variety of cellular events such as cell adhesion, polarity formation, and cell migration (Hall, 1998; Fukata and Kaibuchi, 2001; Etienne-Manneville and Hall, 2002; Fukata et al., 2003; Watanabe et al., 2009). Rho accomplishes these physiological functions through various effector proteins. Rho-kinase is a serine/threonine kinase of ∼160 kDa that was identified as an effector protein of Rho (Leung et al., 1995; Ishizaki et al., 1996; Matsui et al., 1996). Rho-kinase has two isoforms, ROCK1 with 1354 amino acids and ROCK2 with 1388 amino acids, both of which have three major domains: a kinase domain, a coiled-coil domain containing the Rho-binding site, and a pleckstrin homology (PH) domain (Nakagawa et al., 1996). In this article, we designate Rho-kinase when we do not distinguish between the isoforms, whereas we designate ROCK1 or ROCK2 when we do distinguish between the isoforms. Rho-kinase has been shown to be involved in many cellular functions such as cell contraction, adhesion, migration, and neuronal growth cone guidance; these functions have been demonstrated through controlling actomyosin interactions, the formation of stress fibers and focal adhesions, and the disruption of intermediate filaments (IFs) by phosphorylating specific substrates including myosin light chain (MLC), ezrin/radixin/moesin (ERM), Na+/H+ exchanger isoform 1 (NHE1), glial fibrillary acidic protein (GFAP), vimentin, and collapsin response mediator protein 2 (CRMP2) (Riento and Ridley, 2003; Mueller et al., 2005; Shimokawa and Takeshita, 2005; Amano et al., 2010b; Arpin et al., 2011). The modes of action in physiological events by Rho-kinase have most clearly been shown by the actomyosin contraction system in vascular smooth muscles (Amano et al., 1996; Kimura et al., 1996). Rho-kinase activated by the GTP-bound form of Rho not only phosphorylates MLC directly, but also inhibits the dephosphorylation of phosphorylated MLC by inactivating MLC phosphatase (MLCP); this phenomenon occurs through the phosphorylation of the myosin phosphatase targeting subunit 1 (MYPT1) of MLCP, thereby resulting in doubly promoting actomyosin contraction.
Concerning the tissue distribution of Rho-kinases, it was reported that ROCK1 was highly expressed in non-neuronal tissues such as the liver and lungs, whereas ROCK2 was predominantly expressed in the brain and muscles (Leung et al., 1996; Matsui et al., 1996; Nakagawa et al., 1996). Using northern blot analysis, ROCK1 mRNA was detected at high levels in the heart, lung, liver, stomach, spleen, kidney, testis, placenta, and embryo, whereas ROCK2 mRNA was detected in the brain, heart, lung, skeletal muscle, placenta and embryo of rats or mice (Leung et al., 1996; Nakagawa et al., 1996). Rho-kinases were also detected in the aorta and bladder of rats through RT-PCR (Wibberley et al., 2003). Immunohistochemical analysis revealed that Rho-kinases were expressed in the corneal epithelial cells of rabbits (Nakamura et al., 2001) and in the neurons of the hippocampus, cerebral cortex and cerebellum in the bovine brain (Hashimoto et al., 1999).
Despite an increasing volume of evidence concerning the molecular mechanism of Rho-kinase and its distribution pattern as described above, the in vivo tissue distribution and subcellular localization of Rho-kinase isoforms, ROCK1 and ROCK2, remain to be clarified due to the lack of isoform-specific antibodies. Moreover, at the electron microscopy level, the subcellular localization of the isoforms remains completely unknown. In this study, we examined the tissue distribution and subcellular localization of ROCK1 and ROCK2 in mouse tissues. We showed that ROCK1 and ROCK2 had distinct tissue distribution and subcellular localization patterns in many of the tissues tested. Our present data suggest that each isoform of Rho-kinase distributes differentially and accomplishes specific functions in these tissues.
Materials and Methods
Small interfering RNA transfection
HeLa cells were maintained in DMEM (Sigma, St. Louis, MO) supplemented with 10% fetal bovine serum (FBS; SAFC Biosciences, Lenexa, KS). HeLa cells were transfected with small interfering RNA (siRNA) by Lipofectamine RNAiMAX (Invitrogen, Carlsbad, CA), according to the manufacturer’s protocol. The control siRNA sequence was 5′-CAGUCGCGUUUGCGACUGG-3′. siRNA sequences of ROCK1 and ROCK2 were used for targeting ROCK1 or ROCK2, as previously described (Vega et al., 2011). Oligonucleotide siRNAs with dTdT overhangs at each 3′ terminus were obtained from Greiner-Japan (Tokyo, Japan). The cells were lysed by SDS sample buffer or fixed with 4% paraformaldehyde (PFA) for 10 min at room temperature (RT) 72 h after transfection. Western blot analysis was performed as described below. In immunostaining, the cells were permeabilized with 0.2% Triton X-100 for 10 min at RT and blocked with 1% bovine serum albumin (BSA) (Nacalai, Kyoto, Japan) for 30 min at RT. The cells were incubated with anti-ROCK1 antibody (1:200 dilution) (Epitomics, Burlingame, CA) or anti-ROCK2 antibody (1:400 dilution) (Katoh et al., 2001) for 1 h at RT and with Alexa488-conjugated anti-rabbit IgG (1:400 dilution) (Invitrogen) for 1 h at RT.
Animals
Normal adult mice (8-week-old C57BL/6 mice) were obtained from SLC (Japan SLC, Hamamatsu, Japan). All animal procedures were performed with the approval of the Animal Care and Use Committee of The Mie University.
Preparation of tissue homogenate
Mice were transcardially perfused with cold PBS containing Complete EDTA-free Protease Inhibitor Cocktail (Roche Diagnostics, Mannheim, Germany) under anesthesia. Tissues (brain, esophagus, stomach, small intestine, large intestine, liver, pancreas, lung, kidney, bladder, heart, aorta and diaphragm) were removed and homogenized in homogenizing buffer (20 mM Tris-HCl [pH 7.5], 2 mM EDTA, 1 mM DTT) containing 10% sucrose. The total protein concentration was determined using Bio-Rad Dc protein assay reagents (Bio-Rad, Richmond, CA). Each tissue sample was mixed with SDS sample buffer and boiled for 10 min.
Western blot analysis
Equal amounts of protein from cell lysates or tissue homogenates were subjected to SDS-PAGE and transferred onto PVDF membranes. The membranes were blocked with 50% Block Ace (Dainihon Pharmaceutical, Osaka, Japan) in 20 mM Tris-buffered saline (pH 7.5) for 1 h at RT and then incubated with the primary antibody against ROCK1 (1:500 dilution), ROCK2 (1:400 dilution) or α-tubulin (1:1000 dilution) (Sigma) at 4°C overnight. After washing the membranes three times with 20 mM Tris-buffered saline (pH 7.5) containing 0.05% Tween-20 (TBST), the membranes were incubated with horseradish peroxidase- (HRP) conjugated anti-rabbit or anti-mouse IgG (1:1000 dilution) (GE Healthcare Japan, Tokyo, Japan) for 1 h at RT. After washing, immunoreactive bands were visualized by the ECL plus Western blotting detection system (GE Healthcare Japan).
Immunofluorescence microscopic analysis
Mice were transcardially perfused with freshly prepared 2% PFA in 0.1 M phosphate buffer (PB, pH 7.4) under anesthesia. Subsequently, the tissues were removed and postfixed in the same fixative for 6 h. For cryoprotection, the tissues were soaked in 0.1 M PB containing 25% sucrose at 4°C overnight and sectioned with a cryostat (Leica, Bensheim, Germany). The frozen sections were air-dried at 4°C and washed with 0.1 M PB. Fixed cells or sections were blocked with 20% Block Ace in 0.1 M PB containing 0.01% saponin for 30 min at RT in a humidified chamber and then incubated with the primary antibody against ROCK1 (1:200 dilution), ROCK2 (1:400 dilution), GFAP (1:400 dilution) (Sigma) or synaptophysin (1:800 dilution) (Chemicon, Temecula, CA) in dilution buffer (0.1 M PB containing 5% Block Ace and 0.01% saponin) for 2 days at 4°C. After incubation with the primary antibody, the sections were washed 5 times with washing buffer (0.1 M PB containing 0.005% saponin) for 10 min and then incubated with Alexa488-conjugated anti-rabbit IgG (1:400 dilution), Alexa594-conjugated anti-mouse IgG (1:400 dilution), Alexa594-conjugated phalloidin (1:100 dilution) or Alexa647-conjugated phalloidin (1:100 dilution) (Invitrogen) in dilution buffer at 4°C overnight. After washing, the specimens were examined using a confocal laser scanning microscope (Fluoview FV1000; Olympus, Tokyo, Japan). Offline image analysis was performed using Olympus FV1000 software.
Immunoelectron microscopic analysis
Immunoelectron microscopic analysis, using the silver-enhanced immunogold method, was mainly performed as previously described (Mizoguchi et al., 1994). After incubation with the primary antibody (ROCK1 or ROCK2) and washing as described above, the samples were incubated with 1.4 nm gold particle-conjugated goat anti-rabbit IgG (1:100 dilution) (Nanogold; Nanoprobes, Yaphank, NY) at 4°C overnight, postfixed with 1% glutaraldehyde in 0.1 M PB for 10 min at RT, and washed with 50 mM HEPES (pH 5.8) for 15 min 4 times. To ease detection, the gold particles in the samples were silver-enhanced by the HQ silver kit (Nano-probes) in the dark. The samples were washed, postfixed with 0.5% osmium tetroxide (OsO4) in 0.1 M PB for 90 min at 4°C and stained with 2% uranyl acetate in 50% ethanol for 30 min at 4°C. Then, the samples were dehydrated by passage through a graded series of ethanol (50, 60, 70, 80, 90, 95 and 100%) and propylene oxide and embedded in epoxy resin (Nacalai) for 2 days at 60°C. From this sample, ultrathin sections were cut, stained with uranyl acetate and lead citrate, and observed with a transmission electron microscope (JEM-1011 EX; JEOL, Akishima, Japan).
Hippocampal neuron culture
Mouse hippocampal neuronal cultures were prepared from embryonic day (E) 17 mice according to Goslin et al. (1998) with slight modifications. Hippocampal neurons, isolated by trypsin treatment, were plated at a density of 3000 cells/cm2 on poly-L-lysine-coated cover glasses in Minimum Essential Medium (MEM, Invitrogen) containing 10% horse serum. After the cells attached, the coverslips were transferred to a dish with glial cells and maintained in Neurobasal medium (Invitrogen) with a B27 supplement (Invitrogen) above the glial feeder layer. After 3 days in culture, the neurons were fixed with 2% PFA for 3 h at RT and blocked with 20% Block Ace for 10 min at RT. The neurons were incubated with anti-ROCK1 antibody (1:200 dilution) or anti-ROCK2 antibody (1:400 dilution) at 4°C overnight followed by Alexa488-conjugated anti-rabbit IgG (1:400 dilution) and Alexa594-conjugated phalloidin (1:100 dilution) (Invitrogen) at 4°C overnight. Immunoelectron microscopic analysis was performed as described above.
Results
Expression patterns of ROCK1 and ROCK2 in mouse tissues by western blot analysis
To confirm the specificity of the anti-ROCK1 and ROCK2 antibodies used in this study, we examined whether each antibody specifically recognized ROCK1 or ROCK2 through western blot analysis using cell lysates transfected with siRNA specific for ROCK1 or ROCK2. Each antibody recognized a single band with a molecular mass of approximately 160 kDa in HeLa cell lysates, and each band was undetectable only when siRNA specific for ROCK1 or ROCK2 was transfected into HeLa cells (Fig. 1A). The expression of α-tubulin was not changed by these siRNA transfections (Fig. 1A). As observed by immunostaining HeLa cells, ROCK1 immunoreactivity (IR) or ROCK2 IR was abolished by siRNA knockdown (Fig. 1B and C). These results indicate that each antibody used in this study specifically recognized ROCK1 or ROCK2.

Next, we examined the expression of ROCK1 and ROCK2 in various tissues by western blot analysis. ROCK1 and ROCK2 were expressed almost ubiquitously in the mouse tissues, but the expression pattern of ROCK1 was distinct from that of ROCK2 (Fig. 2). The anti-ROCK1 antibody specifically recognized a single band with a molecular mass of approximately 160 kDa in all mouse tissues, whereas the anti-ROCK2 antibody recognized a single band with a molecular mass of 160 kDa in most tissues and recognized two bands with molecular mass of 160 kDa and 170 kDa in the diaphragm (Fig. 2, lower panel, black arrows). ROCK1 expression was high in the brain, esophagus, stomach, small intestine, large intestine, lungs and bladder; moderate in the liver, pancreas, aorta and diaphragm and low in the kidneys and heart (Fig. 2, upper panel). ROCK2 expression was high in the brain, lung, kidneys and bladder and moderate in the esophagus, stomach, small intestine, large intestine, liver, pancreas, heart, aorta and diaphragm (Fig. 2, lower panel). These results demonstrate that both ROCK1 and ROCK2 are expressed in most of the mouse tissues tested.

We performed immunofluorescence and immunoelectron microscopic analyses in mouse tissues. The ROCK1 or ROCK2 IR described below was specific for anti-ROCK1 or anti-ROCK2 antibody, respectively, because immunocytochemical signals were not observed in the absence of primary antibodies.
Large intestine and small intestine (duodenum)
In the large intestine, ROCK1 IR was much stronger in epithelial cells than in smooth muscle cells (Fig. 3A), whereas ROCK2 IR was mainly observed in smooth muscle cells (Fig. 3D). In the epithelial cells of the large intestine, strong ROCK1 IR was identified on plasma membranes, especially the lateral membranes, and weak ROCK1 IR was observed diffusely in the cytoplasm (Insets in Fig. 3A–C). In the small intestine (duodenum), predominant localization of ROCK1 IR in epithelial cells and localization of ROCK2 IR in smooth muscle cells were demonstrated (Fig. 3G and J). In the epithelial cells of the duodenum, ROCK1 IR was enriched on plasma membranes, especially at the apical junctions (Insets in Fig. 3G–I, white arrows). Ultrastructurally, ROCK1 immunogold signals were highest at the adhesion junctions (AJs) and were moderate at the tight junctions (TJs) and desmosomes (Fig. 3M and N). In addition to apical junctions, ROCK1 signals were also observed at the cell-cell contact sites of lateral plasma membranes without junctional specializations (Fig. 3N, a black arrowhead or a black arrow). ROCK1 signals were undetectable at the apical and basal plasma membranes in the epithelial cells of the large and small intestines (data not shown). In the acinar cells of the exocrine pancreas, which are regarded as typical epithelial cells, strong ROCK1 IR was observed on plasma membranes, whereas weak ROCK2 IR was observed in the cytoplasm and nuclei (data not shown). In the bronchus, which contains respiratory epithelial cells, the predominant localization of ROCK1 IR in epithelial cells and that of ROCK2 IR in smooth muscle cells were demonstrated (data not shown).

In liver hepatocytes, which are regarded as atypical epithelial cells, strong ROCK1 IR was observed on plasma membranes, and weak ROCK1 IR was observed diffusely in the cytoplasm (Fig. 4A, white arrows); weak ROCK2 IR was observed in the cytoplasm and nuclei (Fig. 4F, white arrowheads). Ultrastructurally, in hepatocytes, ROCK1 IR was observed at cell-cell adhesion sites surrounding the bile canaliculi, with the highest ROCK1 signals observed at the AJs and moderate signals at TJs and desmosomes (Fig. 4G). ROCK1 signals were also identified on plasma membranes at cell-cell contact sites without junctional specializations (Fig. 4H, black arrows).
Bladder
The bladder has a unique epithelial structure composed of basal, intermediate, and umbrella cells. This epithelial structure is extremely flattened each time the bladder is filled with urine. In the bladder, both ROCK1 and ROCK2 IR were stronger in epithelial cells than in smooth muscle cells (Fig. 5A and G). In the bladder epithelial cells, strong ROCK1 IR was identified in basal cells (Fig. 5D, white arrows) and in a part of umbrella cells (Fig. 5D, white arrowheads), and weak ROCK1 IR was observed in intermediate cells (Fig. 5D). However, strong ROCK2 IR was observed in intermediate and basal cells, and weak ROCK2 IR was observed in umbrella cells (Fig. 5J). ROCK2 IR was observed in the cytoplasm and nuclei of intermediate and basal cells (Fig. 5J, white arrows). Ultrastructurally, both ROCK1 and ROCK2 IR were observed on IFs in umbrella cells (Fig. 5M, N, O, and P; N and P black arrows). Moreover, strong ROCK2 IR was observed at one side of the centrosome of umbrella cells (Fig. 5Q, a black arrow). However, in basal cells, ROCK2 IR was diffusely distributed in the cytoplasm and in the nuclei, where euchromatin, but not heterochromatin, was positive for ROCK2 immunogold signals (Fig. 5R). These results suggest that in bladder epithelial cells, both ROCK1 and ROCK2 are involved in the regulation of IFs and that ROCK2 might participate in the formation and maintenance of centrosomes and in controlling intranuclear events.

In the aorta, strong ROCK1 and ROCK2 IR were observed in smooth muscle cells (ROCK1, Fig. 6A; ROCK2, Fig. 6E). In bladder smooth muscle cells, ROCK1 IR was enriched in plasma membranes (Fig. 6K, a white arrow), whereas ROCK2 IR was observed in the cytoplasm and nuclei (Fig. 6Q, a white arrow). Ultrastructurally, both ROCK1 and ROCK2 IR were observed on actin filaments in the smooth muscle cells of the aorta and bladder (Fig. 6D, H, P and T; black arrows) and as clusters in the cytoplasm (Fig. 6D, J, P and T; white arrowheads). Moreover, ROCK1 IR was observed at plasma membranes in the smooth muscle cells of the aorta and bladder (Fig. 6D and O, black arrowheads), whereas strong ROCK2 IR was observed at one side of the centrosome in aortic smooth muscle cells (Fig. 6I; a black arrow). ROCK1 IR was also observed on vesicles near the plasma membrane (Fig. 6N, double black arrowheads) in bladder smooth muscle cells.
Cardiac muscle
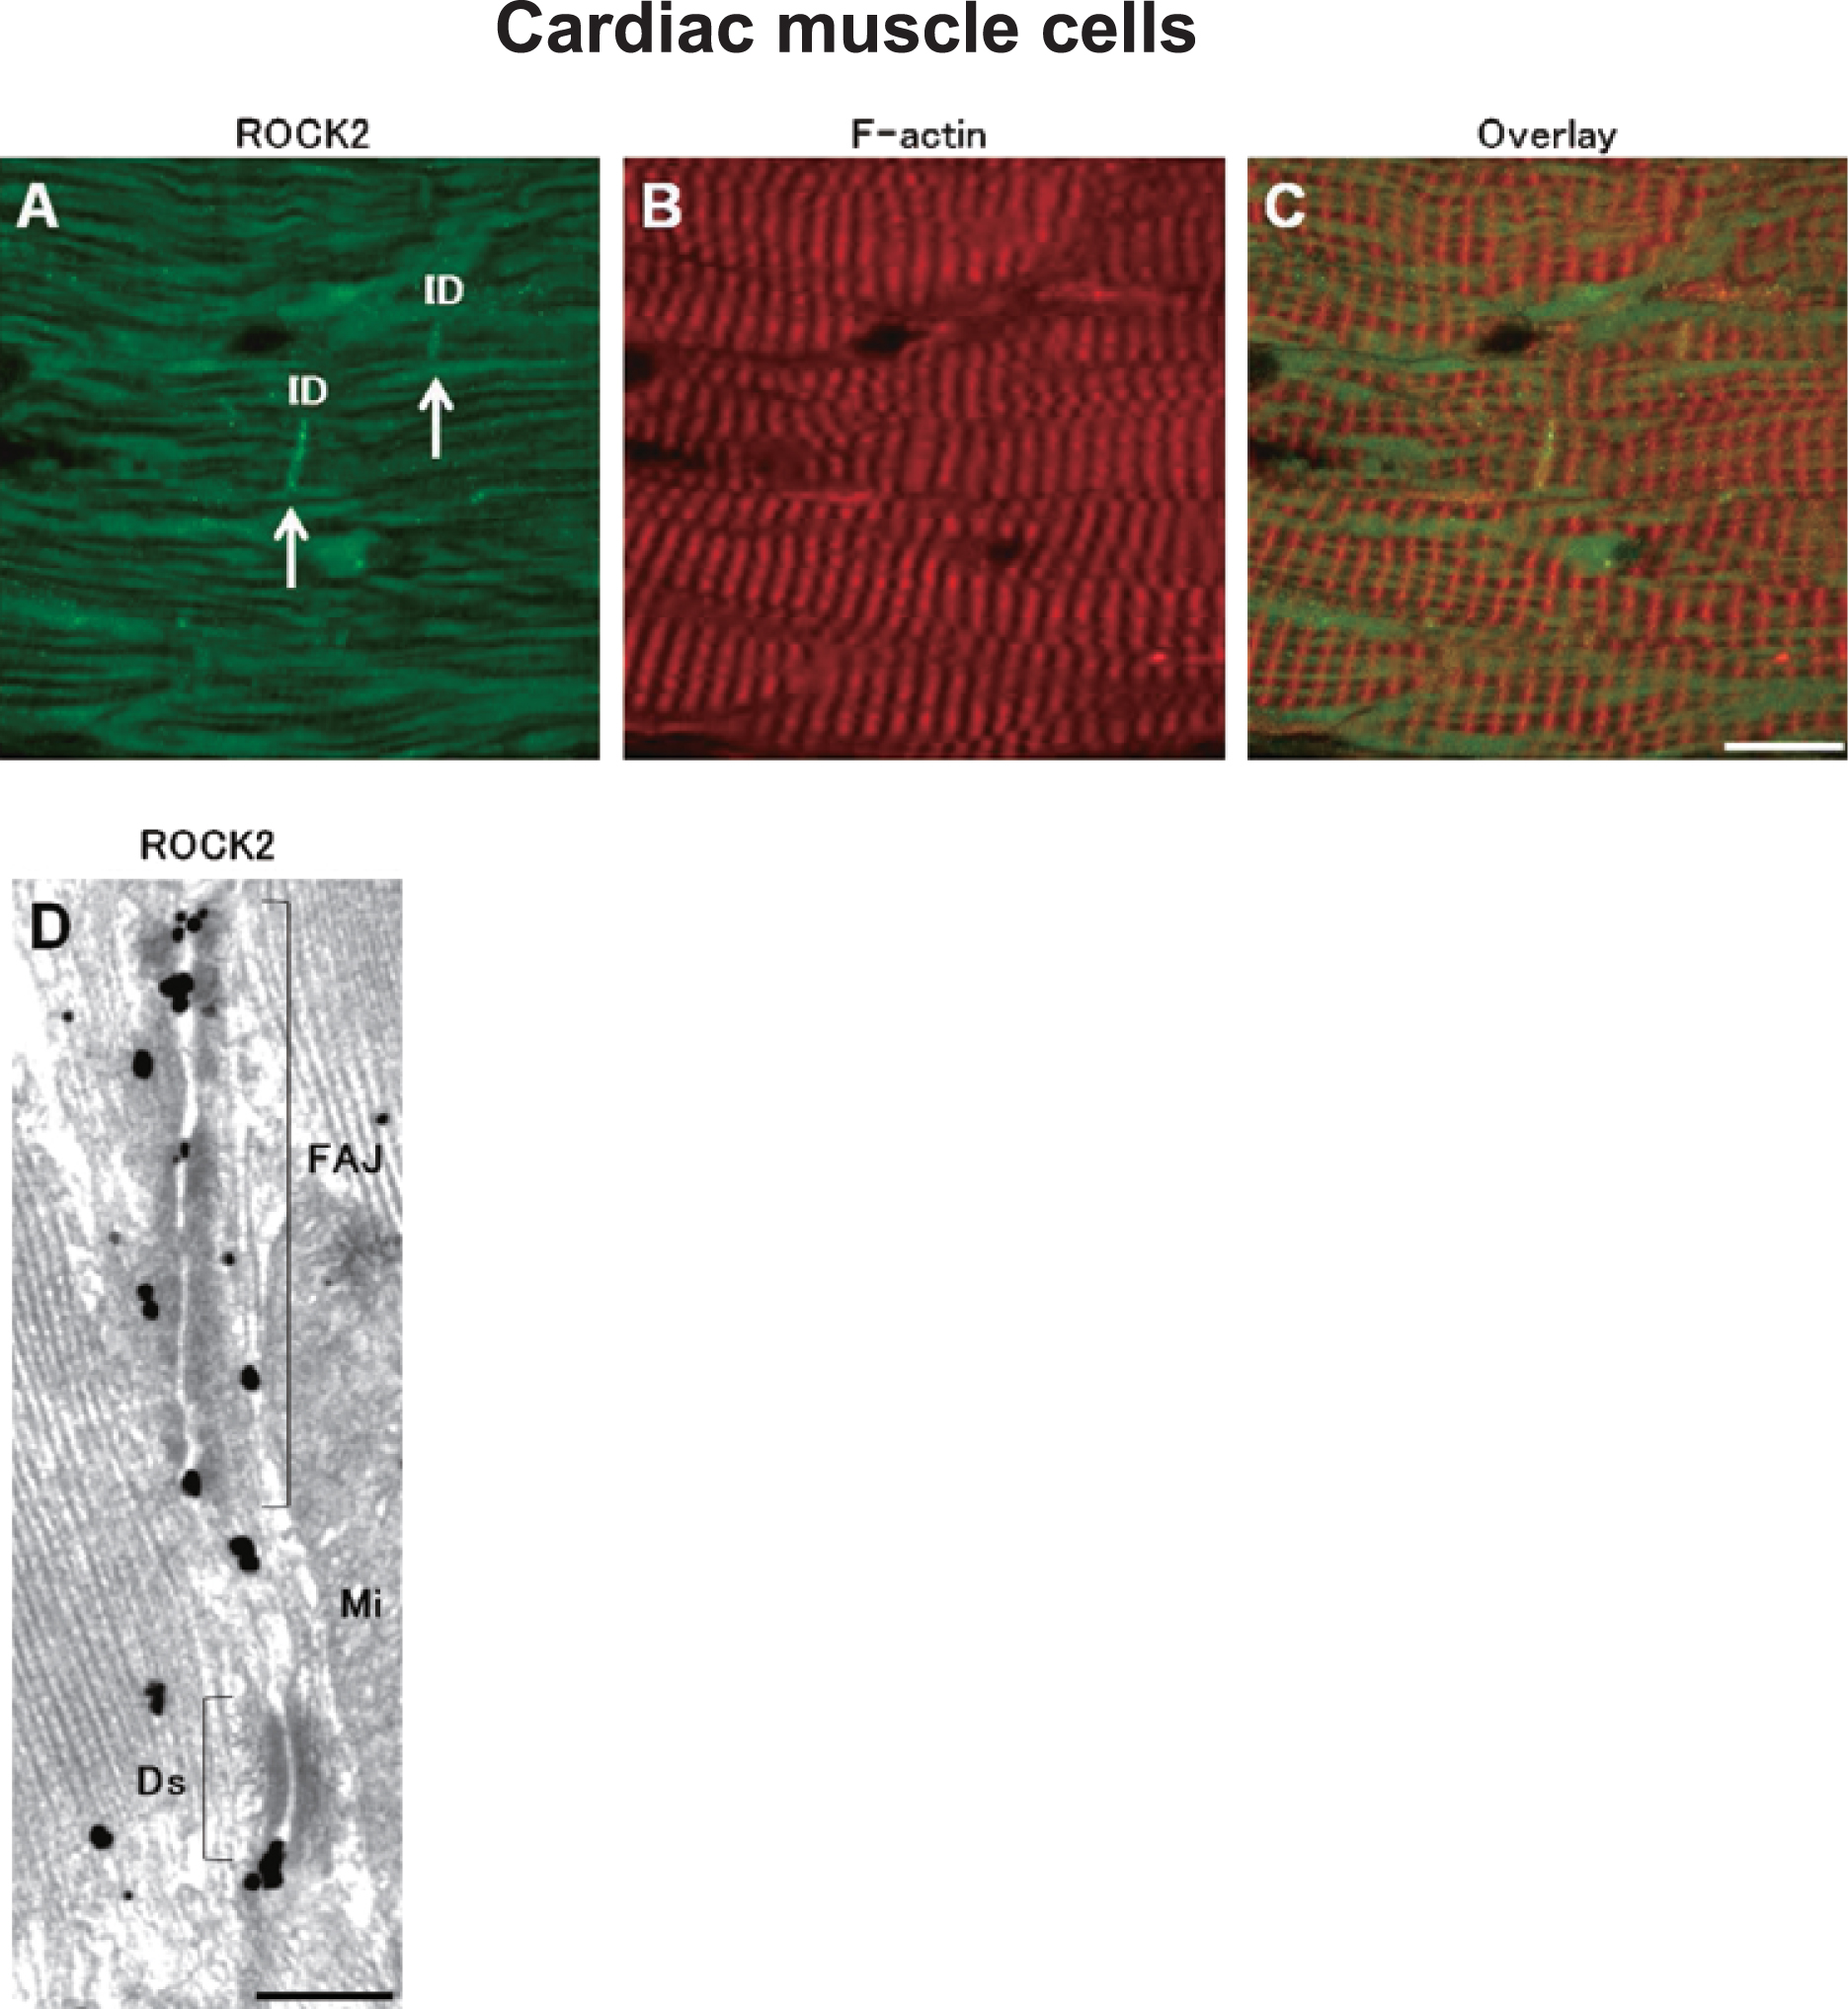
In cardiac muscles, strong ROCK2 IR was observed at intercalated discs (Fig. 7A, white arrows), whereas ROCK1 IR was undetectable (data not shown). Ultrastructurally, ROCK2 IR was concentrated at the fascia adherens junctions and desmosomes of intercalated discs in myocardial cells (Fig. 7D). These results suggest that ROCK2 is involved in cell-cell adhesion in cardiac muscle.
Skeletal muscle (Diaphragm)
In the diaphragm, strong ROCK1 IR was observed as dots near Z-discs in skeletal muscle cells (Fig. 8A, white arrows), whereas ROCK2 IR was observed at or near Z-discs (Fig. 8E, a white arrow) and between Z-discs (Fig. 8E, a white arrowhead). Ultrastructurally, ROCK1 IR was observed on lysosomal membranes near Z-discs (Fig. 8D). ROCK2 IR signals were identified near Z-discs (Fig. 8H, black arrows), on Z-discs (Fig. 8I, black arrows), and on the sarcoplasmic reticulum (Fig. 8J, black arrows), which most likely corresponded with the small punctate ROCK2 IR between Z-discs observed by immunofluorescence. These results suggest that ROCK1 is related to the formation and maintenance of lysosomes and that ROCK2 is involved in skeletal muscle contraction at the Z-discs and sarcoplasmic reticula.
Neural tissues (Brain)
In the cerebral cortex, ROCK1 IR was observed in astrocytes (Fig. 9A, white arrows) where GFAP, an astrocytic marker protein, was co-localized (Fig. 9B and D, white arrows). ROCK2 IR was observed in neurons including cortical pyramidal cells (Fig. 9E and G, white arrows). ROCK2 IR was also observed in the hippocampus (data not shown) as previously reported (Hashimoto et al., 1999). In the cerebellum, ROCK1 IR was observed in Bergmann glia (Fig. 9H, white arrows) because ROCK1 IR co-localized with GFAP (Fig. 9I and K, white arrows), whereas ROCK2 IR was observed in Purkinje cells (Fig. 9L and N, white arrows). Ultrastructurally, ROCK2 IR was observed at the trans-Golgi network (TGN), in the pyramidal cells of cerebral cortex (Fig. 9O and P, black arrows), in the Purkinje cells of cerebellum (Fig. 9Q and R, black arrows), and in the CA1 pyramidal cells of hippocampus (Fig. 9S and T, black arrows). Moreover, ROCK2 IR was observed at synapses in the cerebellar molecular layer (Fig. 9U–X; U, black arrows, near active zone; V, at presynapse only; W, at both pre- and postsynapse; X, at postsynapse only). These results suggest that ROCK1 is involved in glial cell function, whereas ROCK2 is involved in the TGN and synaptic functions in neurons.

In the diaphragm, ROCK2 IR was observed in the motor nerve terminals of neuromuscular junctions (Fig. 10A, white arrows), whereas ROCK2 IR was co-localized with synaptophysin, a presynaptic marker protein (Fig. 10B and D, white arrows). Ultrastructurally, ROCK2 IR was observed at the active zones of motor nerve terminals in neuromuscular junctions (Fig. 10E, black arrows). These results suggest that ROCK2 is related to neurotransmitter release in the nerve terminals.
Cultured neurons
In cultured hippocampal neurons, ROCK2 IR was observed in neuronal perikarya and growth cones (Fig. 11D, white arrows), whereas ROCK1 IR was undetectable (data not shown). Ultrastructurally, in growth cones, ROCK2 IR was observed on vesicles (Fig. 11G, black arrowheads), diffusely in cytoplasm (Fig. 11G, black arrows), and on actin filaments (Fig. 11G, white arrowheads). These results suggest that ROCK2 is involved in growth cone dynamics.
Summary of tissue distribution and subcellular localization of ROCK1 and ROCK2
Table I shows the summary of tissue distribution and sub-cellular localization of ROCK1 and ROCK2. ROCK1 localizes at cell-cell adhesion sites and at IFs in epithelial cells; at actin filaments, vesicles and lysosomes in muscular cells; and in glial cells in the brain. ROCK2 localizes at IFs and in nuclei in epithelial cells; at actin filaments, centrosomes, intercalated discs, Z-discs and sarcoplasmic reticulum in muscle cells; and at TGN and pre- and postsynaptic elements in neurons in the brain.
Table I
Summary of distribution and subcellular localization of Rho-kinases
| Organ |
ROCK1
|
ROCK2
|
| LM
|
EM
|
LM
|
EM
|
| Tissue or Cell type |
Subcellular distribution |
Subcellular localization |
Tissue or Cell type |
Subcellular distribution |
Subcellular localization |
| Large intestine |
Epithelium (++) |
PM (Lateral membrane) |
N.D. |
Epithelium (±) |
N.D. |
N.D. |
| Smooth muscle (±) |
|
|
Smooth muscle (+) |
|
|
| Small intestine (Duodenum) |
Epithelium (+) |
PM (Lateral membrane) |
PM (Lateral membrane) |
Epithelium (±) |
N.D. |
N.D. |
|
Apical junction |
AJ |
|
|
|
| Smooth muscle (±) |
|
|
Smooth muscle (++) |
|
|
| Liver |
Hepatocyte (+) |
PM |
PM |
Hepatocyte (±) |
Cytoplasm |
N.D. |
|
|
Cell-cell adhesion sites |
|
Nucleus |
|
|
|
(TJ, AJ, Desmosome) |
|
|
|
| Bladder |
Epithelium (+) |
Cytoplasm |
IF |
Epithelium (++) |
Cytoplasm |
IF Centrosome |
|
|
|
|
Nucleus |
Euchromatin |
| Smooth muscle (±) |
Cytoplasm |
Actin filament |
Smooth muscle (±) |
Cytoplasm |
Actin filament |
|
|
Clusters in cytoplasm |
|
|
Clusters in cytoplasm |
|
|
Vesicles |
|
Nucleus |
|
|
PM |
PM |
|
|
|
| Smooth muscles in aorta |
Smooth muscle (++) |
Cytoplasm |
Actin filament |
Smooth muscle (++) |
Cytoplasm |
Actin filament |
|
|
Clusters in cytoplasm |
|
|
Clusters in cytoplasm |
|
|
PM |
|
|
Centrosome |
| Cardiac muscles |
Cardiac muscle (−) |
|
|
Cardiac muscle (+) |
Intercalated disc |
FAJ, Desmosome |
| Skeletal muscles in diaphragm |
Skeletal muscle (+) |
Large puncta in cytoplasm |
Lysosome |
Skeletal muscle (+) |
Z-disc |
Z-disc |
|
|
|
|
Small puncta |
SR |
|
|
|
|
NMJ |
Active zone |
| Brain |
Glia (+) |
N.D. |
N.D. |
Neuron (+) |
Pericarya |
TGN |
|
|
|
|
Dendrites |
Synapse |
|
|
|
|
Axons |
Synapse |
|
|
|
|
|
Active zone |
| Cultured neuron |
Neuron (−) |
|
|
Neuron (+) |
Growth cone |
Actin filament |
|
|
|
|
|
Vesicles |
The distribution and subcellular localization of Rho-kinases in each organ were classified into six groups by Rho-kinase isoforms (ROCK1, ROCK2) and microscopic levels (LM, EM). LM, light microscopy; EM, electron microscopy; PM, plasma membrane; AJ, adherens junction; FAJ, fascia adherens junction; TJ, tight junction; IF, intermediate filament; SR, sarcoplasmic reticulum; NMJ, neuromuscular junction; TGN, trans-Golgi network. Expression levels; ++, very high; +, high; ±, low; −, undetectable; N.D., not determined.
Discussion
Validity of antibodies
The immunoreactive bands for anti-ROCK1 or anti-ROCK2 antibody that were detected in western blot analysis of HeLa cell lysates were specifically abolished by isoform-specific knockdown (Fig. 1A). In all of the membranes probed, a single band was detected in western blot analysis of mouse tissue homogenates except for the diaphragm when probed with ROCK2, where there were two bands (Fig. 2). Immunostaining as described above for both ROCK1 and ROCK2 IR was not observed in the absence of primary antibodies. Therefore, we concluded that the anti-ROCK1 and anti-ROCK2 antibodies used in this study reacted with their counterpart proteins specifically. Because ROCK2 has splicing isoforms at the mRNA level in skeletal muscle tissues such as the diaphragm (Pelosi et al., 2007), we believe that the additional band of ROCK2 in the diaphragm (Fig. 2, lower panel; an upper black arrow) corresponds to a splicing variant of ROCK2, called ROCK2m.
Distinct distribution of Rho-kinase isoforms in each tissue
In the large intestine and duodenum, ROCK1 IR was predominantly identified in epithelial cells. In these tissues, ROCK1 IR was demonstrated to be associated with plasma membranes, especially at cell-cell contacts and cell adhesion sites including the AJs (Fig. 3A and G). Concerning the epithelial localization of ROCK1, it has been reported that ROCK1, but not ROCK2, contributes to epithelial polarity (Yu et al., 2008; Daley et al., 2012).
Interestingly, in the bladder, the predominant localization of ROCK1 IR on the epithelial plasma membranes was not preserved. ROCK1 and ROCK2 IR were identified in the bladder epithelial cells (Fig. 5A and G), where both were localized on IFs (Fig. 5M–P). Bladder epithelial cells are exposed to unusual mechanical stretching and hydrostatic pressure when the bladder fills with urine. It is likely that to resist these stresses, both ROCK1 and ROCK2 are expressed at high levels in bladder epithelial cells and are involved in the regulation of IF functions.
In the brain, ROCK1 was distributed in glial cells (Fig. 9A and H). RhoA is expressed in the Bergmann glia of the cerebellum, suggesting that RhoA is involved in Purkinje dendrite outgrowth (Richard et al., 2008). In contrast, ROCK2 was distributed in the neurons (Fig. 9E and L). The function of ROCK2 in neurons is discussed in detail below.
Subcellular localization of each isoform of Rho-kinases
Plasma membrane
We have shown that ROCK1 is localized on the plasma membrane in epithelial cells of the large and small intestines (Fig. 3A–C, G–I and N) and the hepatocytes of the liver (Fig. 4A and H). ROCK1 localization on plasma membranes was also identified in aortic smooth muscle cells (Fig. 6D) and bladder smooth muscle cells (Fig. 6K and O). It has been reported that ROCK1 phosphorylates and activates Na+/H+ exchanger isoform 1, NHE1 (Tominaga et al., 1998; Tominaga and Barber, 1998; Denker et al., 2000) and that Rho-kinases inhibit the activity of Na+/H+ exchanger isoform 3 (NHE3), another type of ion exchanger (Szászi et al., 2000). Because NHE1 and NHE3 are localized on the plasma membrane in MDCK cells (Noel et al., 1996) and NHE1 is in the mouse endometrial epithelium (Wang et al., 2003), it is likely that the ROCK1 localized on the plasma membrane may participate in phosphorylating these substrates.
Cell-cell adhesion sites
We have demonstrated that ROCK1 is at cell-cell adhesion sites, especially at the AJs in epithelial cells of the small intestine (Fig. 3M and N) and liver hepatocytes (Fig. 4G). The Rho/Rho-kinase signal transduction pathway is required for the establishment of cadherin-dependent cell-cell adhesion (Braga et al., 1997; Shewan et al., 2005). The localization of ROCK1 on the epithelial apical junctions is coupled to the Shroom3 or Willin-Par3-aPKC pathway (Nishimura and Takeichi, 2008; Ishiuchi and Takeichi, 2011). Moreover, ROCK1 associates with E-cadherin complexes in a p120-catenin dependent manner at the AJs (Smith et al., 2012). Therefore, our present ultrastructural data clearly demonstrate for the first time that ROCK1 molecules are most highly concentrated at the AJs and that their specific localization may contribute to apical junction formation through interactions between ROCK1 and E-cadherin complexes. In the epithelial cells of the large and small intestines, ROCK1 localization has also been demonstrated at cell-cell contact sites without junctional specializations on lateral membranes (Fig. 3A–C, G–I, M and N). ROCK1 may play a role in non-junctional cell-cell apposition in these epithelial cells.
A previous report has shown at the light microscopy level, ROCK2 is distributed in intercalated discs (Stepanova et al., 2010). In this study, we found that at the electron microscopy level, ROCK2 is localized at the fascia adherens junctions and desmosomes of intercalated discs (Fig. 7D). Fascia adherens junctions and desmosomes are essential for the mechanical coupling of myocardial cells. Fascia adherens junctions provide anchorage for actin filaments, and desmosomes provide anchorage for IFs (Sheikh et al., 2009). ROCK2 phosphorylates ERM family proteins, which are cross-linkers of the plasma membrane and actin filaments, and recruits ERM family proteins to plasma membranes (Fukata et al., 1998; Matsui et al., 1998). The ERM family proteins are distributed in the intercalated discs of myocardial cells (Darmellah et al., 2009). Thus, these data suggest that in myocardial cells, ROCK2 regulates cell-cell adhesion through ERM family proteins.
Cytoskeleton
We have shown that both ROCK1 and ROCK2 localize at actin filaments in muscular cells and neuronal growth cones (Fig. 6D, H, P, and T, back arrows; Fig.11G, white arrowheads). These data may suggest that ROCK1 and ROCK2 control actomyosin contraction and growth cone movement on the actin filaments. ROCK2 has been shown to localize at actin clustered at postsynaptic density (PSD) (Fig. 9W and X); these implications will be discussed below in the section about synapses.
ROCK2 has been shown to be localized at the centrosomes in bladder epithelial cells and aortic smooth muscle cells (Fig. 5Q and Fig. 6I). It has been reported that ROCK2 regulates centrosome duplication by interacting with Nucleophosmin/B23 at centrosomes (Ma et al., 2006; Kanai et al., 2010) and that ROCK1 is involved in centrosome positioning (Chevrier et al., 2002). The localization of ROCK2 at centrosomes supports these reports.
We have shown that ROCK2 is localized at the Z-discs in skeletal muscle cells (Fig. 8I). Myosin phosphatase targeting subunit 2 (MYPT2), one of the substrates of Rho-kinases, is localized at the Z-discs in myocardial cells (Okamoto et al., 2006). The colocalization of ROCK2 and its substrate MYPT2 at Z-discs strongly suggests an unidentified novel regulatory mechanism in skeletal muscle contraction.
We have shown that ROCK1 and ROCK2 are localized on IFs in bladder epithelial cells (Fig. 5N and P). Previous reports have shown that: 1) Rho-kinases are highly expressed in the bladder (Wibberley et al., 2003); 2) Cytokeratin-7 or Cytokeratin-20 is highly expressed in the bladder epithelial cells of mice (Veranic and Jezernik, 2002); 3) The phosphorylation of IFs by protein kinases such as Rho-kinases induces the disassembly of IFs, and the filament structures are maintained by the balance between the phosphorylation and dephosphorylation of IFs (Izawa and Inagaki, 2006). Therefore, ROCK1 and ROCK2 appear to interact with IFs and regulate their phosphorylation level, thereby cooperatively participating in the maintenance of cell shape in bladder epithelial cells.
Intracellular vesicular organelles
We have shown that ROCK1 is localized to the lysosomal membrane of skeletal muscle cells (Fig. 8D). It has previously been shown that the overexpression of dominant-active Rho-kinases causes the translocation of lysosomes to the cell surface in human breast cancer cells (Nishimura et al., 2003). The localization of ROCK1 on the lysosomal membrane indicates the direct involvement of Rho-kinases in the translocation of lysosomes in vivo.
ROCK1 has been shown to be localized at vesicles near the plasma membrane in bladder smooth muscle cells (Fig. 6N). Previous reports show that Rho plays a key role in the regulation of vesicular transport (Symons and Rusk, 2003; Ridley, 2006) and that Rho-kinases are required for myosin II-mediated vesicular transport during M phase in clam oocytes (Wöllert et al., 2003). Thus, the localization of ROCK1 at vesicles supports these reports.
In this paper, we have shown that ROCK2 is localized to the sarcoplasmic reticulum in the skeletal muscle cells of the diaphragm (Fig. 8J). The Rho-kinase inhibitor Y-27632 inhibits Ca2+ influx from the sarcoplasmic reticulum to the cytoplasm in the tracheal smooth muscle cells of guinea pigs (Ito et al., 2002). ROCK2 may be involved in Ca2+ release from the sarcoplasmic reticulum in skeletal muscle cells and regulate skeletal muscle contraction.
We have also shown that ROCK2 is localized at the TGN in the neurons of the cerebral cortex, cerebellum and hippocampus (Fig. 9P, R and T). Previous reports show that Rho-kinases are associated with the Golgi network in COS7 cells (Riento et al., 2003) and that the inhibition of Rhokinases affects the orientation or polarity of the Golgi network in NIH3T3 cells, F9 teratocarcinoma cells, and cultured neurons (Magdalena et al., 2003; LaMonica et al., 2009; Yao et al., 2009). Our results demonstrating that ROCK2 was localized at the TGN, the most trans part of the Golgi network, are further supporting evidence that ROCK2 is involved in the regulation of the orientation or polarity of the Golgi network.
Nuclei
We have shown that ROCK2 is localized in the nuclei of hepatocytes and bladder epithelial cells (Fig. 4F, Fig. 5J and 5R). It has been reported that ROCK2 is localized in the nuclei of HeLa cells and that ROCK2 phosphorylates and activates p300 acetyltransferase, which modulates gene transcription (Tanaka et al., 2006). The localization of ROCK2 in nuclei supports the likelihood of this event. In fact, ROCK2 was localized at euchromatin (Fig. 5R) where transcriptional events are active.
Synapses, Growth cones
We have shown that ROCK2 is distributed in cortical pyramidal cells (Fig. 9E) and cerebellar Purkinje cells (Fig. 9L). It has been reported that Rho-kinases are highly expressed in the brain (Leung et al., 1996; Matsui et al., 1996; Nakagawa et al., 1996) and that ROCK2 is distributed in the neurons of the cerebral cortex, cerebellum and hippocampus in the bovine brain (Hashimoto et al., 1999). We also have found that ROCK2 is distributed in the neurons of the cerebral cortex, cerebellum and hippocampus in the mouse brain and that ROCK2 is ultrastructurally localized at synapses in the cerebellar molecular layer (Fig. 9U–X). In the hippocampus of ROCK2 knockout mice, it has been reported that synaptic transmission and long-term potentiation (LTP) are impaired and that the number of synapses is decreased. ROCK2 appears to play a critical role in the regulation of synaptic function of the hippocampus (Zhou et al., 2009). Our present data support the importance of ROCK2 in synaptic function.
We have shown that ROCK2 is localized at presynapses including active zones (Fig. 9U–W and Fig. 10E). It is known that AP180, one of the endocytic proteins of synaptic vesicles, is a substrate of ROCK2 (Amano et al., 2010a) and that Rho is an activator of neurotransmitter release at pre-synapses (McMullan et al., 2006). ROCK2 has also been shown to localize at postsynapses (Fig. 9W and X). Profilin is a major actin-regulatory protein in the excitatory postsynapse (Ackermann and Matus, 2003) and a substrate of Rho-kinase (Shao et al., 2008; Bauer et al., 2009). Active RhoA directly interacts with N-methyl-D-aspartate-(NMDA) type receptors and recruits the Rho-kinase/profilin complex to the PSD and then activates it, thereby stabilizing actin filaments (Schubert et al., 2006). Therefore, ROCK2 appears to be involved in the regulation of synaptic vesicle transport or neurotransmitter release in presynapses and in the regulation of the actin cytoskeleton in postsynapses.
ROCK2 has also been shown to localize in growth cones in cultured neurons (Fig. 11D and G). We have reported that ROCK2 phosphorylates CRMP2 and that this phosphorylation is required for growth cone collapse (Arimura et al., 2000). The localization of ROCK2 in growth cones supports its involvement in growth cone collapse.
Cytoplasm
We have demonstrated that clusters of immunogold signals for ROCK1 or ROCK2 IR are present in the cytoplasm in the smooth muscle cells of the aorta and bladder and that the clusters are not associated with the cytoskeleton or any organelle (Fig. 6D, J, P and T; white arrowheads). These results suggest that both ROCK1 and ROCK2 play a role in an unknown function in the cytoplasm in addition to the regulation of the actin cytoskeleton. Future research is expected to reveal the possible function of these Rho-kinase clusters.
Phenotypes of ROCK1 and ROCK2 knockout mice and knockdown cultured cells
In this study, we have found a distinctive tissue distribution and subcellular localization of ROCK1 and ROCK2. It is reported that ROCK1 and ROCK2 knockout mice have different phenotypes. In ROCK1 knockout mice, an open eyelid at birth or omphalocele in neonates was observed (Shimizu et al., 2005), whereas in ROCK2 knockout mice, hemorrhage in embryos or hematoma in embryos and neonates was observed (Thumkeo et al., 2003). Moreover, in vitro studies using Rho-kinase isoform-specific knockdown suggest that ROCK1 and ROCK2 play distinct roles in fibroblasts (Yoneda et al., 2005, 2007), keratinocytes (Lock and Hotchin, 2009; Lock et al., 2012), preadipocytes (Noguchi et al., 2007), adipocytes (Chun et al., 2012), endothelial cells (Mong and Wang, 2009; Bryan et al., 2010; Shimada and Rajagopalan, 2010), vascular smooth muscle cells (Zhao et al., 2012) and cancer cells (Wong et al., 2009; Inaba et al., 2010; Vega et al., 2011). Other functional differences between ROCK1 and ROCK2 have been reviewed (Noma et al., 2006; Shi and Wei, 2007; Nunes et al., 2010; Satoh et al., 2011). Our results and these reports indicate that Rho-kinases play distinct functions in an isoform-specific manner in each tissue in vivo. In fact, distinct roles for Rho-kinases have been shown in the rat prostate (Saito et al., 2011), fetal lung development of mice (Cloutier et al., 2010), mouse development and heart failure (Shi et al., 2011), the cardiovascular system (Satoh et al., 2011) or neointima formation following vascular injury (Noma et al., 2008). Further research is required to better understand the function and substrate specificity of each Rho-kinase isoform.
Acknowledgments
The authors thank Dr. Satoru Ogawa (Mie University, Mie, Japan) for electron microscopic techniques; Dr. Keisuke Kuroda (Nagoya University, Aichi, Japan) for helpful discussion; and Ms. Takako Ishii (Nagoya University, Aichi, Japan) and Ms. Itsuko Kobayashi (Mie University, Mie, Japan) for secretarial assistance. This work was supported by Grants-in-Aid for Fundamental Scientific Research (B) (23300284) from the Ministry of Education, Culture, Sports, Science and Technology of Japan.
References
- Ackermann, M. and Matus, A. 2003. Activity-induced targeting of profilin and stabilization of dendritic spine morphology. Nat. Neurosci., 6: 1194–1200.
- Amano, M., Ito, M., Kimura, K., Fukata, Y., Chihara, K., Nakano, T., Matsuura, Y., and Kaibuchi, K. 1996. Phosphorylation and activation of myosin by Rho-associated kinase (Rho-kinase). J. Biol. Chem., 271: 20246–20249.
- Amano, M., Tsumura, Y., Taki, K., Harada, H., Mori, K., Nishioka, T., Kato, K., Suzuki, T., Nishioka, Y., Iwamatsu, A., and Kaibuchi, K. 2010a. A proteomic approach for comprehensively screening substrates of protein kinases such as Rho-kinase. PLoS One, 5: e8704.
- Amano, M., Nakayama, M., Kaibuchi, K. 2010b. Rho-kinase/ROCK: A key regulator of the cytoskeleton and cell polarity. Cytoskeleton (Hoboken), 67: 545–554. Review.
- Arimura, N., Inagaki, N., Chihara, K., Ménager, C., Nakamura, N., Amano, M., Iwamatsu, A., Goshima, Y., and Kaibuchi, K. 2000. Phosphorylation of collapsin response mediator protein-2 by Rho-kinase. Evidence for two separate signaling pathways for growth cone collapse. J. Biol. Chem., 275: 23973–23980.
- Arpin, M., Chirivino, D., Naba, A., and Zwaenepoel, I. 2011. Emerging role for ERM proteins in cell adhesion and migration. Cell Adh. Migr., 5: 199–206.
- Bauer, P.O., Wong, H.K., Oyama, F., Goswami, A., Okuno, M., Kino, Y., Miyazaki, H., and Nukina, N. 2009. Inhibition of Rho kinases enhances the degradation of mutant huntingtin. J. Biol. Chem., 284: 13153–13164.
- Braga, V.M., Machesky, L.M., Hall, A., and Hotchin, N.A. 1997. The small GTPases Rho and Rac are required for the establishment of cadherin-dependent cell-cell contacts. J. Cell Biol., 137: 1421–1431.
- Bryan, B.A., Dennstedt, E., Mitchell, D.C., Walshe, T.E., Noma, K., Loureiro, R., Saint-Geniez, M., Campaigniac, J.P., Liao, J.K., and D’Amore, P.A. 2010. RhoA/ROCK signaling is essential for multiple aspects of VEGF-mediated angiogenesis. FASEB J., 24: 3186–3195.
- Chevrier, V., Piel, M., Collomb, N., Saoudi, Y., Frank, R., Paintrand, M., Narumiya, S., Bornens, M., and Job, D. 2002. The Rho-associated protein kinase p160ROCK is required for centrosome positioning. J. Cell Biol., 157: 807–817.
- Chun, K.H., Araki, K., Jee, Y., Lee, D.H., Oh, B.C., Huang, H., Park, K.S., Lee, S.W., Zabolotny, J.M., and Kim, Y.B. 2012. Regulation of glucose transport by ROCK1 differs from that of ROCK2 and is controlled by actin polymerization. Endocrinology, 153: 1649–1662.
- Cloutier, M., Tremblay, M., Piedboeuf, B. 2010. ROCK2 is involved in accelerated fetal lung development induced by in vivo lung distension. Pediatr. Pulmonol., 45: 966–976.
- Daley, W.P., Gervais, E.M., Centanni, S.W., Gulfo, K.M., Nelson, D.A., and Larsen, M. 2012. ROCK1-directed basement membrane positioning coordinates epithelial tissue polarity. Development, 139: 411–422.
- Darmellah, A., Rücker-Martin, C., Feuvray, D. 2009. ERM proteins mediate the effects of Na+/H+ exchanger (NHE1) activation in cardiac myocytes. Cardiovasc. Res., 81: 294–300.
- Denker, S.P., Huang, D.C., Orlowski, J., Furthmayr, H., and Barber, D.L. 2000. Direct binding of the Na-H exchanger NHE1 to ERM proteins regulates the cortical cytoskeleton and cell shape independently of H+ translocation. Mol. Cell, 6: 1425–1436.
- Etienne-Manneville, S. and Hall, A. 2002. Rho GTPases in cell biology. Nature, 420: 629–635. Review.
- Fukata, Y., Kimura, K., Oshiro, N., Saya, H., Matsuura, Y., and Kaibuchi, K. 1998. Association of the myosin-binding subunit of myosin phosphatase and moesin: dual regulation of moesin phosphorylation by Rho-associated kinase and myosin phosphatase. J. Cell Biol., 141: 409–418.
- Fukata, M. and Kaibuchi, K. 2001. Rho-family GTPases in cadherinmediated cell-cell adhesion. Nat. Rev. Mol. Cell Biol., 2: 887–897.
- Fukata, M., Nakagawa, M., Kaibuchi, K. 2003. Roles of Rho-family GTPases in cell polarisation and directional migration. Curr. Opin. Cell Biol., 15: 590–597.
- Goslin, K., Asumussen, H., Banker, G. 1998. Rat hippocampal neurons in low-density culture. Culturing Nerve Cells ( G. Banker and K. Goslin, eds.), MIT Press, Cambridge, MA, pp.339–370.
- Hall, A. 1998. Rho GTPases and the actin cytoskeleton. Science, 279: 509–514.
- Hashimoto, R., Nakamura, Y., Kosako, H., Amano, M., Kaibuchi, K., Inagaki, M., and Takeda, M. 1999. Distribution of Rho-kinase in the bovine brain. Biochem. Biophys. Res. Commun., 263: 575–579.
- Inaba, N., Ishizawa, S., Kimura, M., Fujioka, K., Watanabe, M., Shibasaki, T., and Manome, Y. 2010. Effect of inhibition of the ROCK isoform on RT2 malignant glioma cells. Anticancer Res., 30: 3509–3514.
- Ishiuchi, T. and Takeichi, M. 2011. Willin and Par3 cooperatively regulate epithelial apical constriction through aPKC-mediated ROCK phosphorylation. Nat. Cell Biol., 13: 860–866.
- Ishizaki, T., Maekawa, M., Fujisawa, K., Okawa, K., Iwamatsu, A., Fujita, A., Watanabe, N., Saito, Y., Kakizuka, A., Morii, N., and Narumiya, S. 1996. The small GTP-binding protein Rho binds to and activates a 160 kDa Ser/Thr protein kinase homologous to myotonic dystrophy kinase. EMBO J., 15: 1885–1893.
- Ito, S., Kume, H., Yamaki, K., Katoh, H., Honjo, H., Kodama, I., and Hayashi, H. 2002. Regulation of capacitative and noncapacitative receptor-operated Ca2+ entry by Rho-kinase in tracheal smooth muscle. Am. J. Respir. Cell Mol. Biol., 26: 491–498.
- Izawa, I. and Inagaki, M. 2006. Regulatory mechanisms and functions of intermediate filaments: A study using site- and phosphorylation state-specific antibodies. Cancer Sci., 97: 167–174.
- Kanai, M., Crowe, M.S., Zheng, Y., Vande Woude, G.F., and Fukasawa, K. 2010. RhoA and RhoC are both required for the ROCK II-dependent promotion of centrosome duplication. Oncogene, 29: 6040–6050.
- Katoh, K., Kano, Y., Amano, M., Onishi, H., Kaibuchi, K., and Fujiwara, K. 2001. Rho-kinase–mediated contraction of isolated stress fibers. J. Cell Biol., 153: 569–584.
- Kimura, K., Ito, M., Amano, M., Chihara, K., Fukata, Y., Nakafuku, M., Yamamori, B., Feng, J., Nakano, T., Okawa, K., Iwamatsu, A., and Kaibuchi, K. 1996. Regulation of myosin phosphatase by Rho and Rho-associated kinase (Rho-kinase). Science, 273: 245–248.
- LaMonica, K., Bass, M., Grabel, L. 2009. The planar cell polarity pathway directs parietal endoderm migration. Dev. Biol., 330: 44–53.
- Leung, T., Manser, E., Tan, L., and Lim, L. 1995. A novel serine/threonine kinase binding the Ras-related RhoA GTPase which translocates the kinase to peripheral membranes. J. Biol. Chem., 270: 29051–29054.
- Leung, T., Chen, X.Q., Manser, E., and Lim, L. 1996. The p160 RhoA-binding kinase ROKα is a member of a kinase family and is involved in the reorganization of the cytoskeleton. Mol. Cell Biol., 16: 5313–5327.
- Lock, F.E. and Hotchin, N.A. 2009. Distinct roles for ROCK1 and ROCK2 in the regulation of keratinocyte differentiation. PLoS One, 4: e8190.
- Lock, F.E., Ryan, K.R., Poulter, N.S., Parsons, M., and Hotchin, N.A. 2012. Differential regulation of adhesion complex turnover by ROCK1 and ROCK2. PLoS One, 7: e31423.
- Ma, Z., Kanai, M., Kawamura, K., Kaibuchi, K., Ye, K., and Fukasawa, K. 2006. Interaction between ROCK II and nucleophosmin/B23 in the regulation of centrosome duplication. Mol. Cell Biol., 26: 9016–9034.
- Magdalena, J., Millard, T.H., Machesky, L.M. 2003. Microtubule involvement in NIH 3T3 Golgi and MTOC polarity establishment. J. Cell Sci., 116: 743–756.
- Matsui, T., Amano, M., Yamamoto, T., Chihara, K., Nakafuku, M., Ito, M., Nakano, T., Okawa, K., Iwamatsu, A., and Kaibuchi, K. 1996. Rho-associated kinase, a novel serine/threonine kinase, as a putative target for small GTP binding protein Rho. EMBO J., 15: 2208–2216.
- Matsui, T., Maeda, M., Doi, Y., Yonemura, S., Amano, M., Kaibuchi, K., Tsukita, S., and Tsukita, S. 1998. Rho-kinase phosphorylates COOH-terminal threonines of ezrin/radixin/moesin (ERM) proteins and regulates their head-to-tail association. J. Cell Biol., 140: 647–657.
- McMullan, R., Hiley, E., Morrison, P., and Nurrish, S.J. 2006. Rho is a presynaptic activator of neurotransmitter release at pre-existing synapses in C. elegans. Genes Dev., 20: 65–76.
- Mizoguchi, A., Yano, Y., Hamaguchi, H., Yanagida, H., Ide, C., Zahraoui, A., Shirataki, H., Sasaki, T., and Takai, Y. 1994. Localization of Rabphilin-3A on the synaptic vesicle. Biochem. Biophys. Res. Commun., 202: 1235–1243.
- Mong, P.Y. and Wang, Q. 2009. Activation of Rho kinase isoforms in lung endothelial cells during inflammation. J. Immunol., 182: 2385–2394.
- Mueller, B.K., Mack, H., Teusch, N. 2005. Rho kinase, a promising drug target for neurological disorders. Nat. Rev. Drug Discov., 4: 387–398.
- Nakagawa, O., Fujisawa, K., Ishizaki, T., Saito, Y., Nakao, K., and Narumiya, S. 1996. ROCK-I and ROCK-II, two isoforms of Rho-associated coiled-coil forming protein serine/threonine kinase in mice. FEBS Lett., 392: 189–193.
- Nakamura, M., Nagano, T., Chikama, T., and Nishida, T. 2001. Role of the small GTP-binding protein Rho in epithelial cell migration in the rabbit cornea. Invest. Ophthalmol. Vis. Sci., 42: 941–947.
- Nishimura, T. and Takeichi, M. 2008. Shroom3-mediated recruitment of Rho kinases to the apical cell junctions regulates epithelial and neuroepithelial planar remodeling. Development, 135: 1493–1502.
- Nishimura, Y., Itoh, K., Yoshioka, K., Tokuda, K., and Himeno, M. 2003. Overexpression of ROCK in human breast cancer cells: evidence that ROCK activity mediates intracellular membrane traffic of lysosomes. Pathol. Oncol. Res., 9: 83–95.
- Noel, J., Roux, D., Pouysségur, J. 1996. Differential localization of Na+/H+ exchanger isoforms (NHE1 and NHE3) in polarized epithelial cell lines. J. Cell Sci., 109: 929–939.
- Noguchi, M., Hosoda, K., Fujikura, J., Fujimoto, M., Iwakura, H., Tomita, T., Ishii, T., Arai, N., Hirata, M., Ebihara, K., Masuzaki, H., Itoh, H., Narumiya, S., and Nakao, K. 2007. Genetic and pharmacological inhibition of Rho-associated kinase II enhances adipogenesis. J. Biol. Chem., 282: 29574–29583.
- Noma, K., Oyama, N., Liao, J.K. 2006. Physiological role of ROCKs in the cardiovascular system. Am. J. Physiol., Cell Physiol., 290: C661– C668. Review.
- Noma, K., Rikitake, Y., Oyama, N., Yan, G., Alcaide, P., Liu, P.Y., Wang, H., Ahl, D., Sawada, N., Okamoto, R., Hiroi, Y., Shimizu, K., Luscinskas, F.W., Sun, J., and Liao, J.K. 2008. ROCK1 mediates leukocyte recruitment and neointima formation following vascular injury. J. Clin. Invest., 118: 1632–1644.
- Nunes, K.P., Rigsby, C.S., Webb, R.C. 2010. RhoA/Rho-kinase and vascular diseases: what is the link? Cell. Mol. Life Sci., 67: 3823–3836.
- Okamoto, R., Kato, T., Mizoguchi, A., Takahashi, N., Nakakuki, T., Mizutani, H., Isaka, N., Imanaka-Yoshida, K., Kaibuchi, K., Lu, Z., Mabuchi, K., Tao, T., Hartshorne, D.J., Nakano, T., and Ito, M. 2006. Characterization and function of MYPT2, a target subunit of myosin phosphatase in heart. Cell. Signal., 18: 1408–1416.
- Pelosi, M., Marampon, F., Zani, B.M., Prudente, S., Perlas, E., Caputo, V., Cianetti, L., Berno, V., Narumiya, S., Kang, S.W., Musarò, A., and Rosenthal, N. 2007. ROCK2 and its alternatively spliced isoform ROCK2m positively control the maturation of the myogenic program. Mol. Cell Biol., 27: 6163–6176.
- Richard, V., Dulon, D., Hafidi, A. 2008. Expression of Rho GTPases Rho-A and Rac1 in the adult and developing gerbil cerebellum. Int. J. Dev. Neurosci., 26: 723–732.
- Ridley, A.J. 2006. Rho GTPases and actin dynamics in membrane protrusions and vesicle trafficking. Trends Cell Biol., 16: 522–529. Review.
- Riento, K. and Ridley, A.J. 2003. ROCKs: multifunctional kinases in cell behaviour. Nat. Rev. Mol. Cell Biol., 4: 446–456. Review.
- Riento, K., Guasch, R.M., Garg, R., Jin, B., and Ridley, A.J. 2003. RhoE binds to ROCK I and inhibits downstream signaling. Mol. Cell Biol., 23: 4219–4229.
- Saito, M., Ohmasa, F., Shomori, K., Dimitriadis, F., Ohiwa, H., Shimizu, S., Tsounapi, P., Kinoshita, Y., and Satoh, K. 2011. Rhos and Rho kinases in the rat prostate: their possible functional roles and distributions. Mol. Cell. Biochem., 358: 207–213.
- Satoh, K., Fukumoto, Y., Shimokawa, H. 2011. Rho-kinase: important new therapeutic target in cardiovascular diseases. Am. J. Physiol. Heart Circ. Physiol., 301: H287–H296.
- Schubert, V., Da Silva, J.S., Dotti, C.G. 2006. Localized recruitment and activation of RhoA underlies dendritic spine morphology in a glutamate receptor-dependent manner. J. Cell Biol., 172: 453–467.
- Shao, J., Welch, W.J., Diprospero, N.A., and Diamond, M.I. 2008. Phosphorylation of profilin by ROCK1 regulates polyglutamine aggregation. Mol. Cell. Biol., 28: 5196–5208.
- Sheikh, F., Ross, R.S., Chen, J. 2009. Cell-cell connection to cardiac disease. Trends Cardiovasc. Med., 19: 182–190. Review.
- Shewan, A.M., Maddugoda, M., Kraemer, A., Stehbens, S.J., Verma, S., Kovacs, E.M., and Yap, A.S. 2005. Myosin 2 is a key Rho kinase target necessary for the local concentration of E-cadherin at cell-cell contacts. Mol. Biol. Cell, 16: 4531–4542.
- Shi, J. and Wei, L. 2007. Rho kinase in the regulation of cell death and survival. Arch. Immunol. Ther. Exp. (Warsz.), 55: 61–75.
- Shi, J., Zhang, L., Wei, L. 2011. Rho-kinase in development and heart failure: insights from genetic models. Pediatr. Cardiol., 32: 297–304.
- Shimada, H. and Rajagopalan, L.E. 2010. Rho kinase-2 activation in human endothelial cells drives lysophosphatidic acid-mediated expression of cell adhesion molecules via NF-κB p65. J. Biol. Chem., 285: 12536–12542.
- Shimizu, Y., Thumkeo, D., Keel, J., Ishizaki, T., Oshima, H., Oshima, M., Noda, Y., Matsumura, F., Taketo, M.M., and Narumiya, S. 2005. ROCK-I regulates closure of the eyelids and ventral body wall by inducing assembly of actomyosin bundles. J. Cell Biol., 168: 941–953.
- Shimokawa, H. and Takeshita, A. 2005. Rho-kinase is an important therapeutic target in cardiovascular medicine. Arterioscler. Thromb. Vasc. Biol., 25: 1767–1775.
- Smith, A.L., Dohn, M.R., Brown, M.V., and Reynolds, A.B. 2012. Association of Rho-associated protein kinase 1 with E-cadherin complexes is mediated by p120-catenin. Mol. Biol. Cell, 23: 99–110.
- Stepanova, O.V., Chadin, A.V., Masiutin, A.G., Kulikova, T.G., Gurin, Ya.V., Sergeeva, I.A., and Shirinsky, V.P. 2010. Rho-associated protein kinase is involved in establishing the cardiomyocyte contractile phenotype. Biophysics, 55: 775–779.
- Symons, M. and Rusk, N. 2003. Control of vesicular trafficking by Rho GTPases. Curr. Biol., 13: R409–R418.
- Szászi, K., Kurashima, K., Kapus, A., Paulsen, A., Kaibuchi, K., Grinstein, S., and Orlowski, J. 2000. RhoA and Rho kinase regulate the epithelial Na+/H+ exchanger NHE3. Role of myosin light chain phosphorylation. J. Biol. Chem., 275: 28599–28606.
- Tanaka, T., Nishimura, D., Wu, R.C., Amano, M., Iso, T., Kedes, L., Nishida, H., Kaibuchi, K., and Hamamori, Y. 2006. Nuclear Rho kinase, ROCK2, targets p300 acetyltransferase. J. Biol. Chem., 281: 15320–15329.
- Thumkeo, D., Keel, J., Ishizaki, T., Hirose, M., Nonomura, K., Oshima, H., Oshima, M., Taketo, M.M., and Narumiya, S. 2003. Targeted disruption of the mouse Rho-associated kinase 2 gene results in intrauterine growth retardation and fetal death. Mol. Cell. Biol., 23: 5043–5055.
- Tominaga, T., Ishizaki, T., Narumiya, S., and Barber, D.L. 1998. p160ROCK mediates RhoA activation of Na-H exchange. EMBO J., 17: 4712–4722.
- Tominaga, T. and Barber, D.L. 1998. Na-H exchange acts downstream of RhoA to regulate integrin-induced cell adhesion and spreading. Mol. Biol. Cell, 9: 2287–2303.
- Vega, F.M., Fruhwirth, G., Ng, T., and Ridley, A.J. 2011. RhoA and RhoC have distinct roles in migration and invasion by acting through different targets. J. Cell Biol., 193: 655–665.
- Veranic, P. and Jezernik, K. 2002. Trajectorial organisation of cytokeratins within the subapical region of umbrella cells. Cell Motil. Cytoskeleton, 53: 317–325.
- Wang, X.F., Yu, M.K., Lam, S.Y., Leung, K.M., Jiang, J.L., Leung, P.S., Ko, W.H., Leung, P.Y., Chew, S.B., Liu, C.Q., Tse, C.M., and Chan, H.C. 2003. Expression, immunolocalization, and functional activity of Na+/H+ exchanger isoforms in mouse endometrial epithelium. Biol. Reprod., 68: 302–308.
- Watanabe, T., Sato, K., Kaibuchi, K. 2009. Cadherin-mediated intercellular adhesion and signaling cascades involving small GTPases. Cold Spring Harb. Perspect. Biol., 1: a003020.
- Wibberley, A., Chen, Z., Hu, E., Hieble, J.P., and Westfall, T.D. 2003. Expression and functional role of Rho-kinase in rat urinary bladder smooth muscle. Br. J. Pharmacol., 138: 757–766.
- Wöllert, T., DePina, A.S., DeSelm, C.J., and Langford, G.M. 2003. Rhokinase is required for myosin-II-mediated vesicle transport during Mphase in extracts of clam oocytes. Biol. Bull., 205: 195–197.
- Wong, C.C., Wong, C.M., Tung, E.K., Man, K., and Ng, I.O. 2009. Rhokinase 2 is frequently overexpressed in hepatocellular carcinoma and involved in tumor invasion. Hepatology, 49: 1583–1594.
- Yao, L., McCaig, C.D., Zhao, M. 2009. Electrical signals polarize neuronal organelles, direct neuron migration, and orient cell division. Hippocampus, 19: 855–868.
- Yoneda, A., Multhaupt, H.A., Couchman, J.R. 2005. The Rho kinases I and II regulate different aspects of myosin II activity. J. Cell Biol., 170: 443–453.
- Yoneda, A., Ushakov, D., Multhaupt, H.A., and Couchman, J.R. 2007. Fibronectin matrix assembly requires distinct contributions from Rho kinases I and -II. Mol. Biol. Cell, 18: 66–75.
- Yu, W., Shewan, A.M., Brakeman, P., Eastburn, D.J., Datta, A., Bryant, D.M., Fan, Q.W., Weiss, W.A., Zegers, M.M., and Mostov, K.E. 2008. Involvement of RhoA, ROCK I and myosin II in inverted orientation of epithelial polarity. EMBO Rep., 9: 923–929.
- Zhao, Y., Lv, M., Lin, H., Hong, Y., Yang, F., Sun, Y., Guo, Y., Cui, Y., Li, S., and Gao, Y. 2012. ROCK1 induces ERK nuclear translocation in PDGF-BB-stimulated migration of rat vascular smooth muscle cells. IUBMB Life, 64: 194–202.
- Zhou, Z., Meng, Y., Asrar, S., Todorovski, Z., and Jia, Z. 2009. A critical role of Rho-kinase ROCK2 in the regulation of spine and synaptic function. Neuropharmacology, 56: 81–89.