Abstract
Protein Kinase D (PKD) 1, 2, and 3 are members of the PKD family. PKDs influence many cellular processes, including cell polarity, structure of the Golgi, polarized transport from the Golgi to the basolateral plasma membrane, and actin polymerization. However, the role of the PKD family in cell polarity has not yet been elucidated in vivo. Here, we show that KO mice displayed similar localization of the apical and basolateral proteins, transport of VSV-G and a GPI-anchored protein, and similar localization of actin filaments. As DKO mice were embryonic lethal, we generated MEFs that lacked all PKD isoforms from the PKD1 and PKD2 double floxed mice using Cre recombinase and PKD3 siRNA. We observed a similar localization of various organelles, a similar time course in the transport of VSV-G and a GPI-anchored protein, and a similar distribution of F-actin in the PKD-null MEFs. Collectively, our results demonstrate that the complete deletion of PKDs does not affect the transport of VSV-G or a GPI-anchored protein, and the distribution of F-actin. However, simultaneous deletion of PKD1 and PKD2 affect embryonic development, demonstrating their functional redundancy during development.
Introduction
Protein Kinase D (PKD) is a member of the serine/threonine protein kinase family. PKDs are known to be effectors of diacylglycerol (DAG) and protein kinase C (PKC) (Lint et al., 2002; Manning et al., 2002). Each of these proteins has a highly conserved DAG binding site in a cysteine-rich domain (CRD). The binding of DAG to the CRD is necessary for its recruitment to the trans-Golgi network (TGN) (Baron and Malhotra, 2002; Fu and Rubin, 2011). PKC ε and η, which bind to the PH domain of PKD, function as negative regulators of kinase activity (Iglesias and Rozengurt, 1998; Waldron et al., 1999). Half of the C-terminus comprises the catalytic kinase domain, which consists of an activation loop (Fu and Rubin, 2011).
The mammalian PKD family consists of three members: PKD1, PKD2, and PKD3 (Fu and Rubin, 2011). These proteins are widely expressed, although the expression of the individual PKDs varies between tissues. It is thought that there is a functional redundancy between the different PKDs (Matthews et al., 2010; Ellwanger et al., 2011).
PKDs were first discovered to be necessary for vesiculation of the Golgi (Jamora et al., 1999). They were later shown to be essential for the fission of vesicles from the TGN that travel to the basolateral plasma membrane (Liljedahl et al., 2001; Yeaman et al., 2004). Many articles have recently shown that PKDs are also involved in other cellular processes, including axonal elongation, proliferation, adhesion, migration, apoptosis, and cell survival, as well as higher order biological processes such as cardiac hypertrophy, angiogenesis, immune responses, and insulin secretion (Bisbal et al., 2008; Rozengurt et al., 2005; Carnegie et al., 2008; Fielitz et al., 2008; Ha et al., 2008; Wang et al., 2008; Ivison et al., 2007; Ren et al., 2009; Yin et al., 2008; Sumara et al., 2009; Gehart et al., 2012 ). Most of these studies used cell culture model systems. Thus, to clarify the in vivo functions of PKD1 and PKD2 in mammals, particularly their functions in epithelial cell polarity and polarized transport, we generated PKD1 and PKD2 knockout (KO) and double KO (DKO) mice. Additionally, to understand the redundancy among PKDs, we generated MEFs deficient in all PKD isoforms using PKD1 and PKD2 knockout and PKD3 siRNA knockdown.
Materials and Methods
Generation of PKD1 and PKD2 knockout mice
All animal procedures were performed according to the guidelines of the Animal Care and Experimentation Committee of Gunma University and Osaka University. The animals were bred at the Institute of Animal Experience Research of Gunma University and Osaka University. PKD1 and PKD2 KO mice were generated largely according to previous work (Sato et al., 2007). For genotyping by PCR analysis, we used the following primers:
5'-CATCATCACACCCATGCCCTCAAGT-3' (Primer a),
5'-CCCAGTTACTCCAAAGTGATTCAAT-3' (Primer b),
5'-CCGTACAGTTCCACAAAGGCATCCT-3' (Primer c),
5'-AAACCCTCCCATGAATGAAGCCCTT-3' (Primer d)
5'-TCTATTTAGCCCAGCCCCCTCCCACT-3' (Primer e),
5'-TGGCCCAGCATTGGGGCAGAATGAA-3' (Primer f), and
5'-TCCAGGCCATCCACAGCTACACAGT-3' (Primer g).
Primers a and b detected the PKD1 wild-type allele. Primers a and c detected the PKD1 geo allele. Primers d and b detected the PKD1 null allele. Primers e and f detected the PKD2 wild-type allele. Primers e and c detected the PKD2 geo allele. Primers e and g detected the PKD2 null allele.
cDNA and plasmids
The pEF-FLAG-Syt II plasmid was a generous gift from Dr. Mitsunori Fukuda (Tohoku University).
The pcDNA3.1-SSH1L-Myc-His plasmid, which encodes slingshot, was a generous gift from Dr. Kensaku Mizuno (Tohoku University).
Antibodies
The following antibodies were used: anti-PKD1 (which recognizes both PKD1 and 2), anti-PKD3, anti-phospho-cofilin, anti-cofilin, anti-myc (Cell Signaling Technology); anti-DPP IV (R&D Systems); anti-lamin B, anti-EEA1 (Santa Cruz); anti-LAMP2 (clone 1D4B and Abl-93; Developmental Studies Hybridoma Bank, IA, USA); anti-GS28 (BD Biosciences); anti-Na+/K+-ATPase (Upstate Biotechnology); FITC Lotus lectin (EY laboratories); Alexa 488-phalloidin (Invitrogen); anti-FLAG (Sigma). Nuclei were stained by 4',6-diamidino-2-phenylindole (DAPI). An anti-GFP rabbit polyclonal antibody was raised against recombinant Hisx6-tagged GFP and affinity purified. A polyclonal antibody that specifically recognizes PKD2 (peptide C-ALINGDVPMEEAADYSEADKSSISDELEDSGVIPGSHSESALHASEEEEGEGHKAQSSLGY) was also raised in rabbits and affinity purified. The anti-Golgin 97 antibody was a kind gift from Dr. Nobuhiro Nakamura (Kyoto Sangyo University).
Histological and western blot analysis
Eight- to nine-week-old mice were used for histology and immunofluorescence microscopy. The mice were fixed by perfusion with 3% (w/v) paraformaldehyde in a 0.1 M phosphate buffer (pH 7.4) and were processed as previously described (Sato et al., 2007). We performed HE and immunofluorescence staining according to previous procedures (Sato et al., 2007). Western blot analysis was performed as previously described (Sato et al., 2007). For western blot analysis, 25 μg of protein was loaded per lane.
RNA Isolation and RT-PCR
Total RNA was extracted from the cultured MEF cells using the NucleoSpin RNA II Kit (Macherey-Nagel) according to the manufacturer’s instructions. Total RNA was primed with random primers (6mers) to synthesize first-strand cDNA using reverse transcriptase (Takara). The primers used for PCR were as follows:
PKD1 sense primer A (Exon 16): 5'-AAATGTGTTGCTGGCATCAGCCGAC-3',
PKD1 antisense primer B (Exon 19): 5'-GCGTTCTCCAATTCTGCATTCCAGC-3',
PKD2 F sense primer C (Exon 14): 5'-GGAGATGATCCTCTCCAGTGAGAAG-3',
PKD2 antisense primer D (Exon 18): 5'-GATATATCGCTCGCCCATCTTTCCC-3',
GAPDH sense primer: 5'-ATGACATCAAGAAGGTGGTG-3',
GAPDH antisense primer: 5'-TGTCATACCAGGAAATGAGC-3'.
Primary MEF culture
PKD1+/+ or PKD1geo/geo embryos were generated by mating the PKD1geo/+ and PKD1geo/+ mice and were dissected on embryonic day 13.5 (E13.5) to obtain mouse embryonic fibroblast (MEF) cultures. PKD1flox/flox; PKD2flox/flox mice were generated by mating between PKD1flox/+; PKD2flox/+ females and male mice. The PKD1flox/flox; PKD2flox/flox mice were dissected on E13.5, and MEFs were isolated through trypsinization of the embryos. MEFs were cultured in DMEM (WAKO) supplemented with 10% fetal calf serum at 37°C in a humidified 5% CO2/95% air atmosphere.
Expression of Cre recombinase was achieved by infection with an adenovirus that expressed Cre recombinase (Ad-Cre). The cells were incubated with Ad-Cre for 2 days, and the culture medium was changed; the cells were incubated for an additional four days (6 days after infection) to promote the depletion of PKD1 and PKD2.
Knockdown of PKD3 via siRNA transfection
siRNAs targeting PKD3 were purchased from Sigma-Aldrich. The sequences of siRNA#1 and siRNA#2 PKD3 are 5'-GGCTATTAAAGUGATTGATTT-3' and 5'-GCAATTGACTTGATAAACATT-3', respectively.
Knockdown of PKD3 and treatment with Cre recombinase was performed as below.
MEFs were incubated with Ad-Cre for two days, and the culture medium was changed; the cells were incubated for an additional four days (6 days after infection), followed by transfection with PKD3 siRNA.
MEFs were trypsinized and 5×10⁵ MEFs were suspended in 45 μl of cold Opti-MEM (Life technologies) and were added to 5 μl of a 20 pmol/μl siRNA solution. The cells and siRNA were mixed and transferred into pre-chilled 0.2 cm electrode gap cuvettes (Bex Co., Ltd). The cuvettes were pulsed once with an EDIT-TYPE CUY21 electroporator (Tokiwa Science). The cells were plated in 6-well culture plates containing DMEM (WAKO) supplemented with 10% fetal calf serum and were incubated at 37°C in a humidified 5% CO2 chamber.
Staining of the organelles in the MEFs
MEFs were fixed in 3% paraformaldehyde in PBS for 15 min at RT. To stain the Golgi, the MEFs were incubated with anti-GS28 and anti-Golgin 97 antibodies in 0.05% saponin, 5% normal donkey serum in PBS at 37°C for 1 hr, washed, and then incubated in Alexa594-anti-mouse IgG or anti-rabbit IgG, respectively, in 0.05% saponin, 5% normal donkey serum in PBS for 1 hr at RT. To stain the early endosomes and lysosomes, the anti-EEA and anti-LAMP2 antibodies were used, respectively. For examination of endocytosis, cultured MEFs were incubated in the culture medium containing 1 mg/ml FITC-dextran (Sigma) for 1 hr at 37°C, washed with PBS, and fixed in 3% paraformaldehyde. Slingshot (pcDNA3.1-SSH1L-Myc-His) cDNAs were transfected by electroporation using Nucleofector IIS (Lonza). Other cDNAs were transfected by EDIT-TYPE CUY21 electroporator (Tokiwa Science). MEFs were photographed using a confocal microscope (FV-1000D, Olympus). The images were processed using Adobe Photoshop (Adobe Systems).
Protein transport from the ER to the plasma membrane through the Golgi
MEFs were infected with an adenovirus encoding ts045-vesicular stomatitis virus-encoded glycoprotein fused with GFP (VSVGts-GFP) or CD59 fused with GFP (CD59-GFP). The cells infected with the adenovirus containing VSVGts-GFP were incubated at 40°C for 20 hrs and were then shifted to 32°C to allow the transport of the protein from the ER to the plasma membrane through the Golgi.
The cells infected with the adenovirus encoding CD59-GFP were incubated at 37°C for 12 hrs and were then treated with brefeldin A (BFA) (Wako) for 6 hrs to dissociate the Golgi. The cells were washed with PBS and incubated at 37°C. For later studies, we used a temperature-sensitive GPI-anchored protein modified from VSV-G(ex)-FLAG-EGFP-GPI (VSV-G extracellular oligomerization domain-FLAG-mCherry-GPI or mCherry-GPIts) (Maeda et al., 2008) to synchronize the trafficking of an apical cargo. The cells were subsequently fixed and processed for immunofluorescence.
Biotinylation of cell surface proteins
To more precisely monitor the transport of VSV-G to the plasma membrane, we measured the amount of VSV-G on the cell surface using surface biotinylation. The surface biotinylation assay was carried out as previously described (Diao et al., 2008). Cells from 3.5-cm dishes were washed twice with ice-cold PBS and were incubated with PBS containing 0.5 mg/ml sulfo-NHS-LC-Biotin (Thermo scientific) at 4°C for 30 min. The cells were washed with cold PBS, quenched with 50 mM NH4Cl in PBS for 15 min at 4°C, and again washed with cold PBS. The cells were extracted in 1 ml of 0.5% Triton X-100 in PBS containing protease inhibitors for 15 min on ice. The extracts were purified by centrifugation, and the supernatants were incubated with 10 μl of streptavidin beads (Solulink) at 4°C for 1 hr. Supernatants were collected for assessment of EndoH resistance. After washing the beads three times with 0.5% Triton X-100 in PBS, the bound proteins were eluted by boiling in SDS sample buffer and were analyzed by WB with an anti-GFP antibody. For assessment of EndoH resistance, dithiothreitol (final concentration 1 mM) were added to the supernatants and 100ul of the supernatants were incubated with or without 0.5 μl of endoglycosidase H (activity 5.0 U/ml; Calbiochem) overnight at 37°C before the addition of SDS-PAGE sample buffer. Samples were analyzed by WB with an anti-GFP antibody.
Results
Generation of PKD1 and PKD2-deficient mice
To determine the biological functions of PKD1 and PKD2 in vivo, we generated PKD1 KO (PKD1geo/geo) mice and PKD2 KO (PKD2geo/geo) mice. A selection cassette that contained SA-PGK-β geo pA was incorporated into the targeting vector (Fig. 1A and Fig. 2A). Following homologous recombination of the targeting vector in ES cells, the homologous recombinant clones were identified using Southern blot analysis (Fig. 1B and Fig. 2B). After generating chimeric mice, we bred PKDgeo/+ mice by mating the chimeric mice with C57BL/6J mice. Finally, we intercrossed the PKDgeo/+ mice to obtain PKDgeo/geo mice (Fig. 1A, C and Fig. 2A, C).


Previous studies have shown that most of PKD1 knockout mice or mutant mice homozygous for catalytic inactive PKD1 were embryonic lethal (Fielitz et al., 2008; Matthews et al., 2010). Only two mice were born alive from more than 150 mutant mice which were homozygous for catalytic inactive PKD1 (Matthews et al., 2010). In contrast, our PKD1geo/geo mice and PKD2geo/geo mice were born at the expected Mendelian ratio (Table I and Table II) and exhibited normal growth and development after birth. The life spans of both PKD1geo/geo mice and PKD2geo/geo mice were similar to those of the control mice. Both PKD1geo/geo mice and PKD2geo/geo mice exhibited no gross abnormalities.
Table I
Results of intercrosses between PKD1
geo/+
|
PKD1+/+ |
PKD1geo/+ |
PKD1geo/geo |
| Live born |
38 (27.1%) |
69 (49.3%) |
33 (23.6%) |
| Mendelian Ratio |
25% |
50% |
25% |
Table II
Results of intercrosses between PKD2
geo/+
|
PKD2+/+ |
PKD2geo/+ |
PKD2geo/geo |
| Live born |
40 (26.8%) |
73 (49%) |
36 (24.2%) |
| Mendelian Ratio |
25% |
50% |
25% |
At an mRNA level, we showed that PKD1 or PKD2 was absent in the MEFs from PKD1geo/geo mice and PKD2geo/geo mice, respectively (Fig. 1D and Fig. 2D) using primers localized in exons coding near the 3' end of the transcripts (Fig. 1A and Fig. 2A). To confirm the absence of PKD1 or PKD2 protein in PKD1geo/geo mice and PKD2geo/geo mice, we also performed western blot (WB) analysis of the lung tissues from control mice, PKD1geo/geo mice, and PKD2geo/geo mice. Though we were able to raise a PKD2-specific antibody, we were not able to raise a PKD1-specific antibody, even after extensive trials. All commercially available antibodies against PKD1 are cross-reactive to the PKD2 protein. Thus, we used one of the commercially available antibodies for WB analysis on the lung lysates. Because the molecular weights of PKD1 and PKD2 are different, we were able to distinguish PKD1 and PKD2. According to our WB results, expression of the PKD1 and PKD2 proteins was completely eliminated and no truncated proteins were detected in the tissues of PKD1geo/geo and PKD2geo/geo mice (Fig. 1E, Fig. 2E). Thus, we called both PKD1geo/geo mice and PKD1–/– mice as PKD1 KO mice in this paper. To determine the distribution of PKD1 among the different tissues, we used various tissues from the PKD2 KO mice. We found that PKD1 protein was expressed in the brain, lung, heart, thymus, spleen, pancreas, large intestine, kidney, and testis (Fig. 1F). Using our anti-PKD2 antibody, we found that PKD2 protein was expressed in the lung, thymus, spleen, and testis (Fig. 2F). These results largely reflected the distribution of the mRNA observed in a previous study (Oster et al., 2006).
To examine the expression of other PKD proteins, we performed WB analysis in various tissues from PKD1 KO, PKD2 KO, and WT mice using an anti-PKD2 specific antibody that was generated in our laboratory and the commercially available anti-PKD1 and PKD3 antibodies. The loss of PKD1 protein did not cause a difference in the expression of PKD2 and PKD3 (Fig. 1G). The loss of PKD2 proteins also did not cause a difference in the expression of PKD1 and PKD3 (Fig. 2G).
We then carried out histological examinations to determine whether PKD1 and PKD2 were necessary for the establishment and maintenance of organs. Histological examinations of the cerebellum, lung, heart, thymus, spleen, liver, small intestine, kidney, and testis by hematoxylin and eosin (HE) staining showed that these organs were similar in the control and KO mice (Fig. 3A, B).
PKD1 and PKD2 are not essential for the localization of apical and basolateral markers
PKD1 and PKD2 have been reported to be involved in basolateral transport (Yeaman et al., 2004). Thus, we analyzed the polarity of epithelial cells to investigate the effects of PKD1 and PKD2 depletion.
HE staining of the kidney, in which PKD1 is expressed, showed no obvious abnormalities in either of the KO (PKD1geo/geo or PKD2geo/geo) mice compared to the control mice (Fig. 3). We also performed immunofluorescence staining using a basolateral marker, Na+/K+-ATPase, and an apical marker, DPP IV (dipeptidyl peptidase IV). Na+/K+-ATPase localized to the basolateral membrane in both the KO and control renal tubules (Fig. 4A). The localization of DPP IV was also identical between the KO and control mice in the apical plasma membrane of the renal epithelial cells (Fig. 4B). We did not examine the epithelial cells in the small intestine because the expression levels of PKD1 and PKD2 in the small intestine are very low (Fig. 1F and Fig. 2F).
These results suggest that PKD1 and PKD2 are not essential for the distribution of apical and basolateral membrane proteins in the kidney.
PKD1 KO and PKD2 KO do not affect the morphology or localization of the Golgi and other organelles
PKD1 and PKD2 are localized to the Golgi where they play roles in vesicle scission (Lint et al., 2002; Liljedahl et al., 2001; Maeda et al., 2001). HeLa cells, which express a kinase-inactive form of PKD, were shown to display TGN tubulation (Liljedahl et al., 2001). Therefore, we expected that we would be able to observe changes in the morphology of organelles, particularly tubule formation in the Golgi or TGN. To examine the morphology of the Golgi, TGN, and other organelles, we stained MEFs from the PKD1 KO (PKD1geo/geo) and PKD2 KO (PKD2geo/geo) mice with various organelle markers (Fig. 5A). However, we did not observe significant differences in the morphology of the Golgi, TGN, early endosome, and lysosome between the KO and control MEFs. To examine the morphology of the Golgi and TGN in vivo, we stained the Golgi in the kidney, pancreas and testis tissues. We observed similar morphologies of the Golgi and TGN in the control and KO samples (Fig. 5B).

It has been reported that PKD1 and PKD2 are involved in the transport of the temperature-sensitive VSV-G or CD4 proteins to the plasma membrane (Liljedahl et al., 2001; Yeaman et al., 2004; Campelo and Malhotra, 2012). In all of these reports, kinase inactive forms of PKD1 and PKD2 specifically affected the TGN to plasma membrane trafficking in HeLa cells while transport from the ER and Golgi complex were not affected. To determine whether a blockade of membrane protein transport occurs, we monitored the transport of the temperature-sensitive VSV-G protein tagged with GFP (VSV-G tsO45-GFP), which was also used as a basolateral marker. We did not observe a significant difference in the localization of VSV-G between the KO (PKD1geo/geo or PKD2geo/geo) and control MEFs (Fig. 6A). To quantitatively assess the transport of VSV-G from the TGN to plasma membrane, we measured the amount of VSV-G on the plasma membrane by surface biotinylation (Fig. 6B, C). However, we were unable to find a difference in the amount of surface VSV-G between the KO and control MEFs. We also did not observe a difference in the transport of GFP-tagged CD59 (CD59-GFP), a GPI-anchored protein, from the ER to the plasma membrane in the KO and control MEFs (Fig. 7A).


Recently, a set of cargo molecules was reported to be transported by a distinct membranous transporter, CARTS (CARriers of the TGN to the cell Surface) and PKD was responsible for this transport (Wakana et al., 2012). Therefore, to understand the involvement of PKD1 and PKD2 in the transport of CARTS, we examined the distribution of synaptotagmin II, which was previously shown to be transported by CARTS (Wakana et al., 2012). However, we did not find any differences in the distribution of synaptotagmin II between the KO and control MEFs (Fig. 7B).
Therefore, we did not observe abnormalities in the intracellular transport of apical/basolateral cargo and CARTS in the KO MEFs.
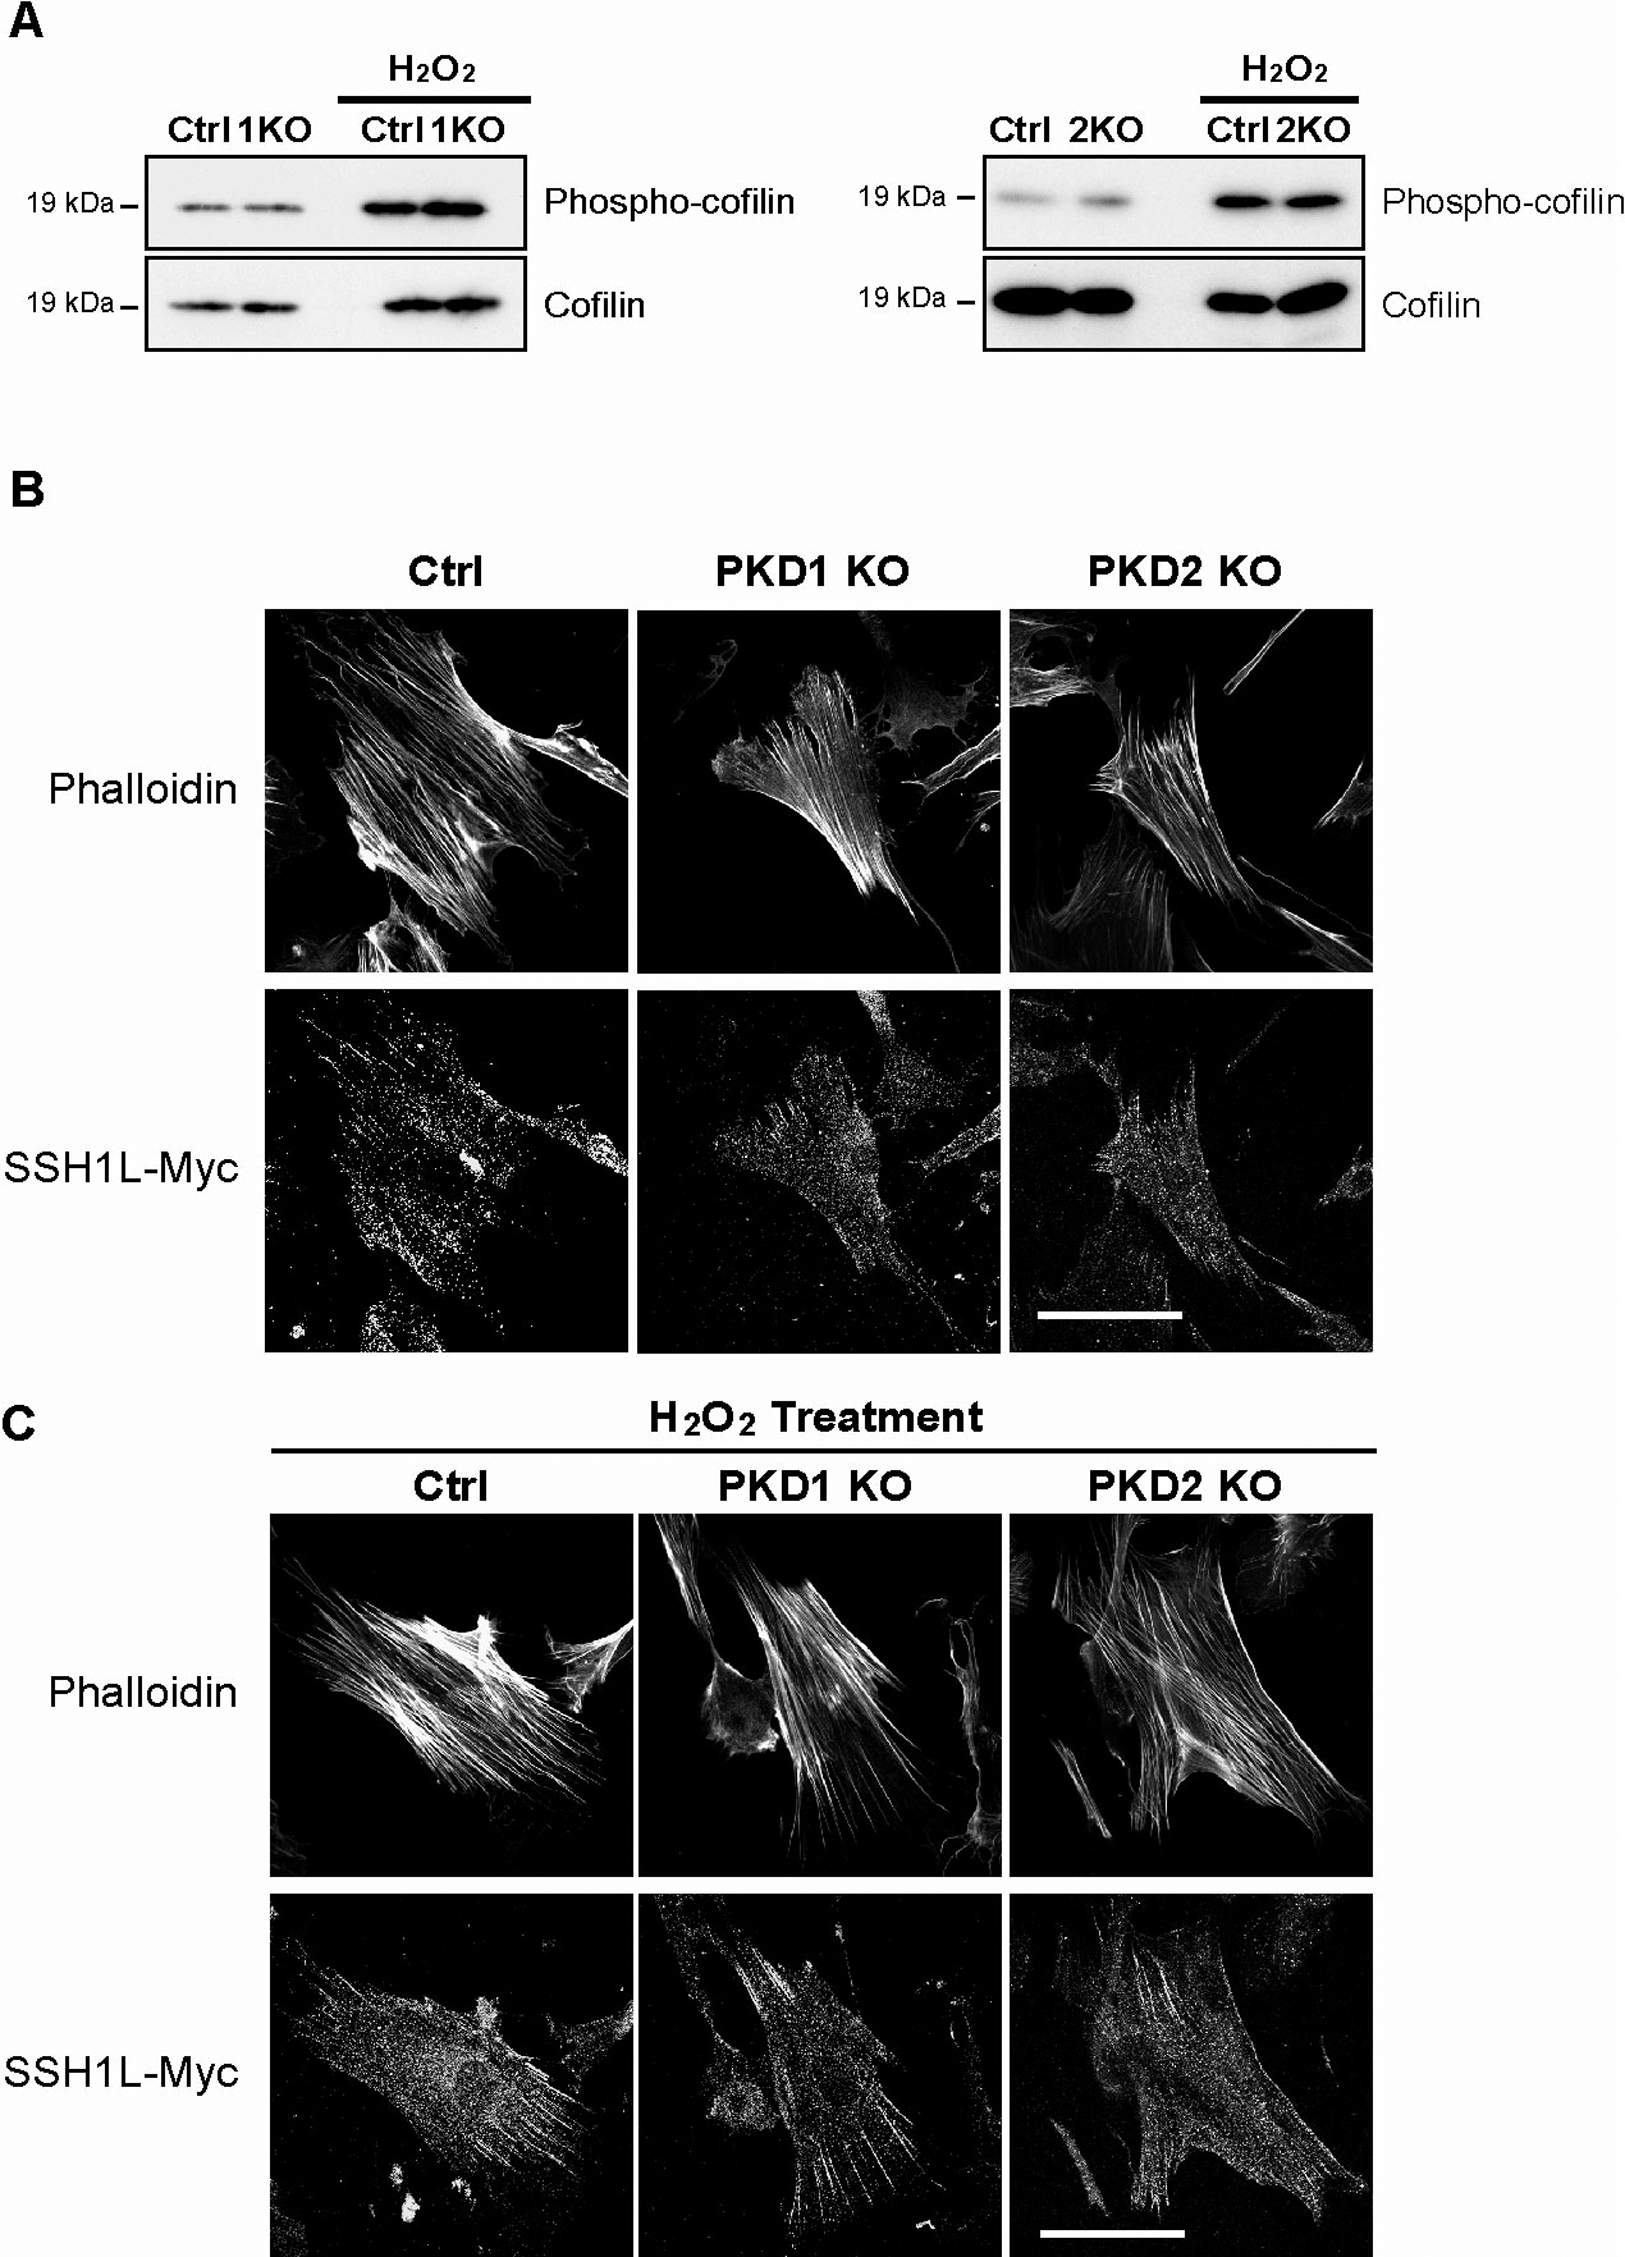
PKD1 and PKD2 are not essential for the phosphorylation of cofilin
It was recently reported that the slingshot phosphatase was inactivated by phosphorylation by a member of the PKD family. Inactivated slingshot can no longer dephosphorylate cofilin, which is known to sever and depolymerize actin filaments (Eiseler et al., 2009). Thus, in the absence of PKD1 or PKD2, slingshot is expected to be more active and dephosphorylate more cofilin, allowing the now active cofilin to sever and depolymerize more actin filaments. The severing of actin filaments creates barbed ends, which serve as foci for actin polymerization. This induces the formation of more filopodia and lamellipodia. Thus, in PKD1 KO (PKD1geo/geo) or PKD2 KO (PKD2geo/geo) MEFs, a reduction of stress fibers, F-actin polymers, and an increment of filopodia and lamellipodia were expected to be observed.
To investigate this hypothesis, we monitored the phosphorylation of cofilin by WB analysis using a phospho-cofilin-specific antibody. We were unable to observe differences in the level of phosphorylated cofilin (Fig. 8A) in either the presence or absence of H2O2, which activates the PKDs. Additionally, when we visualized the actin filaments and slingshot (SSH1L)-Myc in the MEFs, there were no overt differences in the number or localization of the actin filaments and slingshot between the KO and control MEFs (Fig. 8B, C).
Depletion of all PKD isoforms did not affect the distribution of organelles, cargo transport to the plasma membrane, localization of CARTS cargos, and the distribution of F-actin
Because we did not find any differences in cell polarity in the epithelial tissues, the transport of cargos, the localization of organelles, or the phosphorylation of slingshot, we suspected that the redundancy among the PKD isoforms could be the reason for the lack of phenotype. Thus, to investigate this possibility, we generated PKD1 and PKD2 DKO (PKD1geo/geo; PKD2geo/geo) mice. After extensive intercrosses, we were unable to find any adult DKO mice; thus, we concluded the functional redundancy between PKD1 and PKD2 during embryogenesis. After examination of the embryos at various ages, we found that the DKO mice died between 8.5 dpc and 10.5 dpc (Table III).
Table III
Results of intercrosses between PKD1
geo/+; PKD2
geo/geo
|
PKD1+/+; PKD2geo/geo |
PKD1geo/+; PKD2geo/geo |
PKD1geo/geo; PKD2geo/geo |
| E13.5 dpc (1x mating, 5 mice) |
1 (20%) |
4 (80%) |
0 |
| E10.5 dpc (2x mating, 18 mice) |
2 (11.1%) |
16 (88.9%) |
0 |
| E8.5 dpc (5x mating, 42 mice) |
8 (19.1%) |
25 (59.5%) |
9 (21.4%) |
| Mendelian Ratio |
25% |
50% |
25% |
To examine the cellular function of PKD1 and 2, we generated PKD1flox/flox; PKD2flox/flox mice and collected their MEFs. After treatment with Cre recombinase using an adenovirus vector, we successfully deleted both PKD1 and PKD2 alleles (PKD1–/–; PKD2–/–) in the MEFs (Fig. 9A). To further deplete PKD3, we treated the PKD1flox/flox; PKD2flox/flox MEFs with Cre recombinase and PKD3 siRNA. Using two different siRNA against PKD3, we were able to knock down PKD3 expression in addition to the deletion of PKD1 and PKD2 (Fig. 9A). Even in the absence of all PKD isoforms, the distributions of the Golgi, TGN, early endosome, and lysosome appeared similar to those of the control MEFs (Fig. 9B). In addition, we observed similar amount and distribution of endosomes after FITC-dextran uptake, indicating endocytosis was not significantly affected in PKD-null MEFs (Fig. 9B). We also found a similar distribution of slingshot and actin filaments (Fig. 9C, D) and a similar localization of CARTS (Fig. 10C) in the PKD-null MEFs. We also examined the transport of VSV-G and GPI-anchored proteins in the absence of all PKDs. Both markers were transported in a similar time frame in the PKD-null MEFs and the control MEFs (Fig. 10A, B). To quantitatively assess the amount of VSV-G on the plasma membrane, we performed surface biotinylation to detect the VSV-G on the plasma membrane (Fig. 10D). However, we were unable to find a difference in the amount of surface VSV-G between the PKD-null MEFs and control MEFs. To know the defects in earlier secretory processes, we examined endoH-resistance of VSV-G protein which reflects the glycosylation and transport from the ER to Golgi. We also did not observe difference in the extent of endoH-resistant fraction of VSV-G protein in the early secretory pathway (Fig. 10E).


From these findings, PKD1 and PKD2 are necessary for embryonic development. However, PKD1, 2, and 3 are not required for organelle distribution, transport of various proteins, and the distribution of F-actin.
Discussion
PKD1 and PKD2 are thought to be essential for epithelial and neuronal cell polarity. They are also thought to be necessary for the polarized transport of basolateral proteins from the TGN to the basolateral plasma membranes. A number of papers have reported the involvement of PKD1 and PKD2 in a number of biological activities, and the number of these activities is rapidly increasing. Despite its biological importance, an examination of these biological activities in PKD1 KO mice and PKD2 KO mice had not yet been performed. As our main interest is in polarized transport (apical and basolateral transport) underlying the cell polarity of epithelial cells and neurons, we examined the intracellular transport and cell polarity of cells from PKD1 and PKD2 single KO and DKO mice, although other important cell biological functions, such as the transport of CARTS and F-actin distribution, were also examined. The expression of kinase inactive PKD did not affect endocytosis, transport from the ER to Golgi, and transport from the Golgi to endosomes (Yeaman et al., 2004; Campelo and Malhotra, 2012), Here, we observed similar distribution of early endosomes (EEA1) and late endosomes/lysosomes (lamp2) in MEFs deficient in all PKDs (Fig. 9B). In addition, we observed similar uptake of FITC-dextran between control and PKD-null MEFs. Thus, it is unlikely that PKDs are involved in endocytotic pathways.
Unexpectedly, we were unable to find any overt abnormalities in any of the areas we examined in the PKD1 and PKD2 KO and DKO mice. The most likely reason for this is that other PKDs compensated for the loss of PKD1 or PKD2 in these areas, as there are three isoforms of PKD: PKD1, 2, and 3. In particular, PKD1 and 2 have common domain compositions and similar phosphorylation sites. Thus, PKD2 could likely compensate for the loss of PKD1 and vice versa. Additionally, though structurally less homologous, the possibility that PKD3 compensates for PKD1 or PKD2 cannot be ruled out. In addition, in previous papers, a kinase-dead form of PKD1 or PKD2 was frequently used to test its function. However, it is possible that the kinase-dead form of PKD1 or PKD2 also exerted negative effects on the functions of the other isoforms. To examine the possible redundancies between the different isoforms of PKDs, we generated PKD1 and PKD2 DKO mice. The DKO mice died between 8.5 dpc and 10.5 dpc, which clearly indicated that PKD1 and PKD2 are functionally redundant during embryonic development. As the DKO mice died at an early embryonic stage, we were unable to analyze their cellular phenotype further because of the limited amount of cells. Thus, we used MEFs from double floxed mice (PKD1flox/flox; PKD2flox/flox) treated with Cre recombinase to generate PKD1 and PKD2 DKO MEFs. Additionally, we knocked down PKD3 expression using PKD3 siRNA along with Cre recombinase to generate MEFs that lacked all PKD isoforms. However, even when we examined the MEFs deficient in all PKDs, we were unable to find abnormalities in organelle distribution, transport of VSV-G and GPI-anchored proteins to the plasma membrane, and distribution of F-actin.
The apparent loss of phenotype in these MEFs is surprising because possible redundancy among the PKDs should be totally excluded. This result indicates that other species of kinases, such as PKCs, may compensate for the loss of PKDs, as PKDs are structurally similar to PKCs. On the other hand, no DKO embryos were viable after 10.5 dpc, suggesting the importance of PKD1 and PKD2 in embryonic development. This suggests the importance of PKD1 and PKD2 in a certain type of cells during development.
Concerning differences between the phenotype of the KO mice in this paper and those of the preceding papers, we consider it may be due to a difference in the structure of the targeting vectors because similar discrepancies were reported several times in the past (Ohno et al., 1994; Olson et al., 1996). In these cases, a difference in the position or direction of the promoter and drug resistance gene was reported to affect the expression or splicing of neighboring genes.
Collectively, this study indicates the essential function of PKD1 and PKD2 during development and the unexpected redundancy between PKDs and other molecules in the MEFs, with regard to the distribution of organelles, transport of proteins, and F-actin distribution.
Acknowledgments
We would like to thank M. Takano, T. Horie, C. Ohsawa, A, Watanabe, A. Goto, H. Togawa, and T. Ban for assisting with cell culture, immunostaining, and animal care. This work was supported by Suzuken Memorial Foundation, Daiwa Securities Health Foundation, grants-in-aid and the 21st century Centre of Excellence Program from the Japanese Ministry of Education, Culture, Sports, Science and Technology to A.H., as well as The Science and Technology Foundation of Japan (JSTF) and the Life Science Foundation of Japan.
Conflict of interest
The authors declare that they have no conflicts of interest.
References
- Baron, C.L. and Malhotra, V. 2002. Role of diacylglycerol in PKD recruitment to the TGN and protein transport to the plasma membrane. Science, 295: 325–328.
- Bisbal, M., Conde, C., Donoso, M., Bollati, F., Sesma, J., Quiroga, S., Díaz Añel, A., Malhotra, V., Marzolo, M.P., and Cáceres, A.l. 2008. Protein kinase D regulates trafficking of dendritic membrane proteins in developing neurons. J. Neurosci., 28: 9297–9308.
- Campelo, F. and Malhotra, V. 2012. Membrane fission: the biogenesis of transport carriers. Ann. Rev. Biochem., 81: 407–427.
- Carnegie, G.K., Soughayer, J., Smith, F.D., Pedroja, B.S., Zhang, F., Diviani, D., Bristow, M.R., Kunkel, M.T., Newton, A.C., Langeberg, L.K., and Scott, J.D. 2008. AKAP-Lbc mobilizes a cardiac hypertrophy signaling pathway. Mol. Cell, 32: 169–179.
- Diao, A., Frost, L., Morohashi, Y., and Lowe, M. 2008. Coordination of golgin tethering and SNARE assembly: GM130 binds syntaxin 5 in a p115-regulated manner. J. Biol. Chem., 283: 6957–6967.
- Eiseler, T., Döppler, H., Yan, I.K., Kitatani, K., Mizuno, K., and Storz, P. 2009. Protein kinase D1 regulates cofilin-mediated F-actin reorganization and cell motility through slingshot. Nat. Cell Biol., 11: 545–556.
- Ellwanger, K., Kienzle, C., Lutz, S., Jin, Z.G., Wiekowski, M.T., Pfizenmaier, K., and Hausser, A. 2011. Protein kinase D controls voluntary-running-induced skeletal muscle remodelling. Biochem. J., 440: 327–334.
- Fielitz, J., Kim, M.S., Shelton, J.M., Qi, X., Hill, J.A., Richardson, J.A., Bassel-Duby, R., and Olson, E.N. 2008. Requirement of protein kinase D1 for pathological cardiac remodeling. Proc. Natl. Acad. Sci. USA, 105: 3059–3063.
- Fu, Y. and Rubin, C.S. 2011. Protein kinase D: coupling extracellular stimuli to the regulation of cell physiology. EMBO Rep., 12: 785–796.
- Fukuda, M., Kanno, E., and Mikoshiba, K. 1999. Conserved N-terminal cystein motif is essential for homo-and heterodimer formation of synaptotagmin III, V, VI and X. J. Biol. Chem., 274: 31421–31427.
- Gehart, H., Goginashvili, A., Beck, R., Morvan, J., Erbs, E., Formentini, I., De Matteis, M.A., Schwab, Y., Wieland, F.T., and Ricci, R. 2012. The BAR domain protein Arfaptin-1 controls secretory granule biogenesis at the trans-Golgi network. Dev. Cell, 23: 756–768.
- Ha, C.H., Wang, W., Jhun, B.S., Wong, C, Hausser, A., Pfizenmaier, K., McKinsey, T.A., Olson, E.N., and Jin, Z.G. 2008. Protein kinase D-dependent phosphorylation and nuclear export of histone deacetylase 5 mediates vascular endothelial growth factor-induced gene expression and angiogenesis. J. Biol. Chem., 283: 14590–14599.
- Iglesias, T. and Rozengurt, E. 1998. Protein kinase D activation by mutations within its pleckstrin homology domain. J. Biol. Chem., 273: 410–416.
- Ivison, S.M., Graham, N.R., Bernales, C.Q., Kifayet, A., Ng, N., Shobab, L.A., and Steiner, T.S. 2007. Protein kinase D interaction with TLR5 is required for inflammatory signaling in response to bacterial flagellin. J. Immunol., 178: 5735–5743.
- Jamora, C., Yamanouye, N., Lint, J.V., Laudenslager, J., Vandenheede, J.R., Faulkner, D.J., and Malhotra, V. 1999. Gβγ-mediated regulation of Golgi organization is through the direct activation of protein kinase D. Cell, 98: 59–68.
- Liljedahl, M., Maeda, Y., Colanzi, A., Ayala, I., Lint, J.V., and Malhotra, V. 2001. Protein kinase D regulates the fission of cell surface destined transport carriers from the Trans-Golgi Network. Cell, 104: 409–420.
- Lint, J.V., Rykx, A., Maeda, Y., Vantus, T., Sturany, S., Malhotra, V., Vandenheede, J.R., and Seufferlein, T. 2002. Protein kinase D: an intracellular traffic regulator on the move. Trends Cell Biol., 12: 193–200.
- Maeda, Y., Beznoussenko, G.V., Lint, J.V., Mironov, A.A., and Malhotra, V. 2001. Recruitment of protein kinase D to the trans-Golgi network via the first cystein-rich domain. EMBO J., 20: 5982–5990.
- Maeda, Y., Ide, T., Koike, M., Uchiyama, Y., and Kinoshita, T. 2008. GPHR is a novel anion channel critical for acidification and functions of the Golgi apparatus. Nat. Cell Biol., 10: 1135–1145.
- Manning, G., Whyte, D.B., Martinez, R., Hunter, T., and Sudarsanam, S. 2002. The protein kinase complement of the human genome. Science, 298: 1912–1934.
- Matthews, S.A., Navarro, M.N., Sinclair, L.V., Emslie, E., Feijoo-Carnero, C., and Cantrell, D.A. 2010. Unique functions for protein kinase D1 and protein kinase D2 in mammalian cells. Biochem. J., 432: 153–163.
- Ohno, H., Goto, S., Taki, S., Shirasawa, T., Nakano, H., Miyatake, S., Aoe, T., Ishida, Y., Maeda, H., Shirai, T. et al. 1994. Targeted disruption of the CD3 eta locus causes high lethality in mice: modulation of Oct-1 transcription on the opposite strand. EMBO J., 13: 1157–1165.
- Olson, E.N., Arnold, H.H., Rigby, P.W., and Wold, B.J. 1996. Know your neighbors: three phenotypes in null mutants of the myogenic bHLH gene MRF4. Cell, 85: 1–4.
- Oster, H., Abraham, D., and Leitges, M. 2006. Expression of the protein kinase D (PKD) family during mouse embryogenesis. Gene Expr. Patterns, 6: 400–408.
- Ren, M., Feng, H., Fu, Y., Land, M., and Rubin, C.S. 2009. Protein kinase D is an essential regulator of C. elegans innate immunity. Immunity, 30: 521–532.
- Rozengurt, E., Rey, O., and Waldron, R.T. 2005. Protein kinase D signaling. J. Biol. Chem., 280: 13205–13208.
- Sato, T., Mushiake, S., Kato, Y., Sato, K., Sato, M., Takeda, N., Ozono, K., Miki, K., Kubo, Y., Tsuji, A., Harada, R., and Harada, A. 2007. The Rab8 GTPase regulates apical protein localization in intestinal cells. Nature, 448: 366–369.
- Sumara, G., Formentini, I., Collins, S., Sumara, I., Windak, R., Bodenmiller, B., Ramracheya, R., Caille, D., Jiang, H., Platt, K.A., Meda, P., Aebersold, R., Rorsman, P., and Ricci, R. 2009. Regulation of PKD by the MAPK p38 in insulin secretion and glucose homeostasis. Cell, 136: 235–248.
- Wakana, Y., Galen, J.V., Meissner, F., Scarpa, M., Polishchuk, R.S., Mann, M., and Malhotra, V. 2012. A new class of carriers that transport selective cargo from the trans Golgi network to the cell surface. EMBO J., 31: 3976–3990.
- Waldron, R.T., Iglesias, T., and Rozengurt, E. 1999. The pleckstrin homology domain of protein kinase D interacts preferentially with the eta isoform of protein kinase C. J. Biol. Chem., 274: 9224–9230.
- Wang, S., Li, X., Parra, M., Verdin, E., Bassel-Duby, R., and Olson, E.N. 2008. Control of endothelial cell proliferation and migration by VEGF signaling to histone deacetylase 7. Proc. Natl. Acad. Sci. USA, 105: 7738–7743.
- Yeaman, C., Ayala, M.I., Wright, J.R., Bard, F., Bossard, C., Ang, A., Maeda, Y., Seufferlein, T., Mellman, I., Nelson, W.J., and Malhotra, V. 2004. Protein kinase D regulates basolateral membrane protein exit from trans-Golgi network. Nat. Cell Biol., 6: 106–112.
- Yin, D.M., Huang, Y.H., Zhu, Y.B., and Wang, Y. 2008. Both the establishment and maintenance of neuronal polarity require the activity of protein kinase D in the Golgi apparatus. J. Neurosci., 28: 8832–8843.