Abstract
Stem cells from human exfoliated deciduous teeth (SHED) are isolated from the dental pulp tissue of primary teeth and can differentiate into neuronal cells. Although SHED are a desirable type of stem cells for transplantation therapy and for the study of neurological diseases, a large part of the neuronal differentiation machinery of SHED remains unclear. Recent studies have suggested that mitochondrial activity is involved in the differentiation of stem cells. In the present work, we investigated the neuronal differentiation machinery of SHED by focusing on mitochondrial activity. During neuronal differentiation of SHED, we observed increased mitochondrial membrane potential, increased mitochondrial DNA, and elongated mitochondria. Furthermore, to examine the demand for mitochondrial activity in neuronal differentiation, we then differentiated SHED into neuronal cells in the presence of rotenone, an inhibitor of mitochondrial respiratory chain complex I, and carbonyl cyanide m-chlorophenyl hydrazone (CCCP), a mitochondrial uncoupler, and found that neuronal differentiation was inhibited by treatment with rotenone and CCCP. These results indicated that increased mitochondrial activity was crucial for the neuronal differentiation of SHED.
Key words: mitochondria, differentiation, stem cells, dental pulp, exfoliated deciduous teeth
Introduction
Stem cells from human exfoliated deciduous teeth (SHED) are isolated from the dental pulp tissue of primary teeth (Miura et al., 2003). Exfoliated deciduous teeth are usually discarded as medical waste; therefore, SHED can be easily collected from exfoliated deciduous teeth with cooperation and agreement from the patient. SHED express embryonic stem cell markers Oct-4 and Nanog, the mesenchymal stem cell marker stromal precursor antigen-1 (STRO-1), and the neuronal stem cell marker Nestin and possess high proliferation capacity; SHED also show multidifferentiation potential and can differentiate into neuronal, osteogenic, adipogenic, and hepatogenic cells (Ma et al., 2012; Miura et al., 2003; Yamaza et al., 2015). SHED have been shown to be able to differentiate into neurons, astrocytes, and oligodendrocytes (Jarmalavičiūtė et al., 2013; Miura et al., 2003; Nourbakhsh et al., 2011; Sakai et al., 2012). The dopaminergic differentiation of SHED has been reported previously, and the engraftment of dopaminergic neurons obtained from SHED in the brain has been shown to improve the production of dopamine and the abnormal behaviors of Parkinsonian rats (Fujii et al., 2015; Wang et al., 2010). Different protocols for the neuronal differentiation of SHED have been established. Therefore, SHED are promising stem cells for transplantation therapy, clinical research, and drug discovery for neurological diseases. However, the mechanisms underlying the neuronal differentiation of SHED remain unclear.
Mitochondria play a central role in ATP production, cellular Ca2+ buffering, and apoptosis. Additionally, mitochondrial DNA (mtDNA) mutations induce aberrations in oxidative phosphorylation (Keogh and Chinnery, 2015), and embryonic stem cells (ESCs) harboring mtDNA mutations have been reported to show reduced neuronal differentiation (Kirby et al., 2009). Inhibition of mitochondrial complex III, a complex required for oxidative phosphorylation, blocks the neuronal differentiation of ESCs (Pereira et al., 2013). Furthermore, inhibition of mitochondrial complex III results in high expression of Oct-4 during the neuronal differentiation of ESCs (Pereira et al., 2013). These results suggest that mitochondrial activity is involved in the neuronal differentiation of stem cells.
In this study, to examine the demand for mitochondrial activity in the neuronal differentiation of SHED, we analyzed the mitochondrial membrane potential (MMP), mitochondrial mass, mtDNA contents, and mitochondrial morphology during neuronal differentiation. We also examined the effects of rotenone, a mitochondrial inhibitor, and carbonyl cyanide 3-chlorophenylhydrazone (CCCP), a mitochondrial uncoupler, on the neuronal differentiation of SHED. Our findings will provide a platform for further studies focusing on the use of SHED in clinical research and drug discovery focusing on mitochondrial activity.
Materials and Methods
Ethics statement
Experiments using human samples were reviewed and approved by the Kyushu University Institutional Review Board for Human Genome/Gene Research and were conducted in accordance with the Declaration of Helsinki.
Isolation and culture of SHED
An exfoliated deciduous tooth was collected from a 4-year-old child at Pediatric & Special Needs Dentistry, Kyushu University Hospital, with the permission of the child’s parents. The isolation and culture of SHED were performed as described previously (Miura et al., 2003) with small modifications. The dental pulp was gently isolated from a residual crown and treated with 3 mg/mL collagenase I (Washington, NJ, USA) and 4 mg/mL dispase II (Wako Pure Chemical Industries, Osaka, Japan) in phosphate-buffered saline (PBS) containing 2 mM CaCl2 for 60 min at 37°C. Next, the undigested tissues and cell aggregates were removed by filtration through a 70-μm cell strainer (Corning, NY, USA). Single-cell suspensions were then seeded into a 6-well plate (Corning) and cultured in alpha modification of Eagle’s medium (α-MEM; Sigma-Aldrich, MO, USA) supplemented with 15% fetal bovine serum (FBS; Sigma-Aldrich), 100 μM l-ascorbic acid 2-phosphate (Wako Pure Chemical Industries), 2 mM l-glutamine (Life Technologies, NY, USA), 250 μg/mL fungizone (Life Technologies), 100 U/mL penicillin, and 100 μg/mL streptomycin (Life Technologies) at 37°C in an atmosphere containing 5% CO2. SHED at passages 5–10 were used in this study. For sphere formation, 2×10⁵ SHED were cultured in 6-well plates for suspension culture (Greiner Bio-one, Frickenhausen, Germany). After 24 h, spheres were observed under an IX41 microscope (Olympus, Tokyo, Japan) equipped with a digital camera NEX-5T (Sony, Tokyo, Japan) with an NY-1S adaptor (MeCan Imaging, Saitama, Japan).
Neural differentiation of SHED
The differentiation of SHED into neuronal cells was performed as described previously (Miura et al., 2003). To differentiate SHED into neuronal cells, SHED were cultured in neurobasal A medium (Life Technologies) supplemented with 2% B27 supplement (Life Technologies), 40 ng/mL basic fibroblast growth factor (bFGF; Peprotech, NJ, USA), and 20 ng/mL epidermal growth factor (EGF; Sigma-Aldrich) for 2 or 10 days at 37°C in an atmosphere containing 5% CO2. The medium was changed after 5 days.
Immunocytochemistry
Cells cultured on coverslips were fixed with 4% paraformaldehyde in 0.1 M sodium phosphate buffer (pH 7.4) for 10 min at room temperature and then permeabilized with 0.1% Triton X-100 in PBS for 5 min. For the detection of N-methyl-d-aspartate receptor subunit 1 (NMDAR1), the permeabilization step was skipped. The cells were blocked with 2% bovine serum albumin (BSA; Wako Pure Chemical Industries) in PBS for 20 min and then incubated with the following primary antibodies: anti-STRO-1 (Millipore, CA, USA), anti-Nestin (Millipore), anti-β-tubulin III (Sigma-Aldrich), anti-microtubule-associated protein 2 (MAP2; Sigma-Aldrich), anti-Tom20 (Santa Cruz Biotechnology, CA, USA), and anti-NMDAR1 (Millipore). After 90 min, the cells were incubated with Alexa Fluor-conjugated secondary antibodies (Life Technologies) in the dark for 60 min. After staining with antibodies, the nuclei were stained with 1 μg/mL 4',6-diamidino-2-phenylindole dihydrochloride (DAPI; Dojindo, Kumamoto, Japan). The cells were then mounted using ProLong Diamond (Life Technologies). Fluorescent images were captured using an Axio Imager M2 (Zeiss, Oberkochen, Germany) equipped with ApoTome2 (Zeiss). The length of the cells was measured and analyzed using MetaMorph (Molecular Devices, CA, USA). To evaluate the cell numbers for 10 days after neuronal differentiation, 5 images of the cells stained with anti-β-tubulin III and DAPI were randomly taken from each of the 5 experiments. The cell numbers were then analyzed using MetaMorph (Molecular Devices).
Western blotting
The cells were washed three times with PBS and then lysed with sample buffer (62.5 mM Tris-HCl buffer [pH 6.8] containing 2% sodium dodecyl sulfate [SDS], 5% β-mercaptoethanol, and 10% glycerol). The cell lysates were incubated for 95°C and analyzed by SDS-polyacrylamide gel electrophoresis (PAGE). Subsequently, immunoblotting was performed using anti-β-tubulin III (Sigma-Aldrich), anti-Nestin (Millipore), anti-Tom20 (Santa Cruz Biotechnology), and anti-heat shock protein 90 (HSP90; Santa Cruz Biotechnology) antibodies. The immunoreactive bands were detected using ECL Prime (GE Healthcare, Buckinghamshire, UK) and analyzed using LAS-1000 pro (Fuji Film, Tokyo, Japan) and Image Gauge software (Fuji Film).
Measurement of mitochondrial membrane potential
JC-1 is a cationic dye that accumulates in the mitochondria depending on the MMP and forms aggregates. JC-1 shows a fluorescence emission shift from green (monomer; 527 nm) to red (aggregate; 590 nm) after forming aggregates (Reers et al., 1991). The MMP can therefore be measured by determining the ratio of red to green fluorescent signals. SHED were incubated with 1 μM JC-1 (Life Technologies) for 10 min and then washed three times with PBS. The cells were then treated with Tryple Express (Life Technologies) to detach them from the culture plates and collected in tubes. Next, the cells were centrifuged at 800×g for 5 min, and the collected cells were resuspended in PBS. JC-1 aggregates and monomers were measured using a FACSCalibur (BD Bioscience, CA, USA). Populations of 10,000 cells were analyzed for each sample, and JC-1 signals were detected using the FL2 and FL1 channels for aggregates and monomers, respectively. Geometric means of red and green fluorescence were measured using Cell Quest software (BD Bioscience), and the ratio of red/green fluorescence was calculated.
To observe JC-1 aggregates and monomers using confocal microscopy, SHED were cultured on glass-bottomed dishes (ibidi, Munich, Germany). SHED were then incubated with 1 μM JC-1 (Life Technologies) for 10 min, and the culture medium was changed. Fluorescent images of JC-1 aggregates and monomers were acquired using a C2 confocal microscope (Nikon, Tokyo, Japan).
RNA extraction and quantitative real-time polymerase chain reaction (PCR)
Total RNA was extracted from the cells using an RNAeasy Mini Kit (Qiagen, Hilden, Germany). First-strand cDNA was synthesized using a SuperScript III First Strand Synthesis System (Life Technologies). The sequences of primer sets used in this study were as follows: β-tubulin III, 5'-CTCAGGGGCCTTTGGACATC-3' (β-tubulin III forward) and 5'-CAGGCAGTCGCAGTTTTCAC-3' (β-tubulin III reverse); postsynaptic density protein 95 (PSD95), 5'-TCGGTGACGACCCATCCAT-3' (PSD95 forward) and 5'-GCACGTCCACTTCATTTACAAAC-3' (PSD95 reverse); gamma-aminobutyric acid (GABA) receptor α2, 5'-GCCAATCAATCGGAAAGGAGAC-3' (GABA receptor α2 forward) and 5'-TTCCCATCCCAAGCCCATCCTC-3' (GABA receptor α2 reverse); and 18S rRNA, 5'-CGGCTACCACATCCAAGGAA-3' (18S rRNA forward) and 5'-GCTGGAATTACCGCGGCT-3' (18S rRNA reverse). Real-time quantitative PCR was performed using GoTaq qPCR Master Mix (Promega, WI, USA) and analyzed with StepOnePlus Real-Time PCR Systems (Life Technologies). The relative expression levels of the target genes were analyzed using the comparative the threshold cycle (CT) method by normalizing to 18S rRNA.
Measurement of mtDNA amount by quantitative real-time PCR
mtDNA and nuclear DNA were extracted from the cells using a QIAamp DNA mini kit (Qiagen). Mitochondrial tRNALEU(UUR) was detected using the following primer set: 5'-CACCCAAGAACAGGGTTTGT-3' (tRNA F3212) and 5'-TGGCCATGGGTATGTTGTTA-3' (tRNA R3319) (Venegas and Halberg, 2012). Nuclear β-2-microglobulin (β2M) was detected using the primer set 5'-TGCTGTCTCCATGTTTGATGTATCT-3' (β2M F594) and 5'-TCTCTGCTCCCCACCTCTAAGT-3' (β2M R679) (Venegas and Halberg, 2012). Real-time PCR was performed as described for mRNA measurement. Analysis of the relative amount of mtDNA was performed as described previously (Venegas and Halberg, 2012).
Measurement of living cell numbers and the percentages of living cells
A total of 5×10⁴ SHED were seeded into 6-well plates (Corning). After 24 h, SHED were treated with rotenone (Sigma-Aldrich; 1–1,000 nM) and CCCP (Wako Pure Chemical Industries; 2.5–50 μM) for 2 days. The cells were then collected by trypsinization and stained with 0.4% trypan blue solution (Wako Pure Chemical Industries). The cells were counted with a hemocytometer, and living and dead cells were distinguished by trypan blue staining. To calculate the percentage of living cells, the living cells were divided by the total cell count (living cells and dead cells).
Detection of mitochondrial reactive oxygen species (mtROS)
A total of 5×10⁵ SHED were seeded into 6-well plates (Corning). After 24 h, SHED were treated with DMSO, 100 nM rotenone (Sigma-Aldrich), or 100 nM rotenone with 5 mM N-acetyl-l-cysteine (NAC; Sigma-Aldrich) for 2 days. Then, the cells were incubated with 5 μM MitoSOX Red (Life Technologies) for 10 min and washed three times with PBS. The cells were then treated with Tryple Express (Life Technologies) to detach them from the culture plates and collected in tubes. Next, the cells were centrifuged at 800×g for 5 min, and the collected cells were resuspended in PBS. The fluorescent signal of MitoSOX Red was measured using a FACSCalibur (BD Bioscience).
Statistical analysis
Statistical analyses were performed with Wilcoxon tests using JMP software (SAS Institute, NC, USA). Differences with P values of less than 0.05 were considered significant.
Results
Isolation and characterization of SHED
To analyze the neuronal differentiation of SHED, SHED were isolated from a primary tooth and were then cultured until passage 5. The isolated SHED showed a fibroblast-like morphology (Fig. 1A). To evaluate the stem cell properties of these SHED, we examined sphere formation ability (Pastrana et al., 2011) and stem cell marker expression. SHED formed spheres when cultured under nonadherent conditions (Fig. 1B). SHED expressed STRO-1 (a mesenchymal stem cell marker, Fig. 1C). Moreover, although there were differences in the expression levels among the different cells (Fig. 1E; white arrow indicates strong expression), all SHED expressed Nestin (a neuronal stem cell marker, Fig. 1D). These results indicated that SHED isolated in this study possessed stem cell characteristics, as described previously (Miura et al., 2003).
Differentiation of SHED into neuronal cells
Next, we examined the neuronal differentiation capacity of the cultured SHED. SHED were cultured in neuronal differentiation medium (Miura et al., 2003) for 10 days. Undifferentiated and neuronally differentiated SHED were stained with antibodies against the neuronal cell marker proteins. SHED expressed β-tubulin III and MAP2 both before (Fig. 2A, B) and after neuronal differentiation (Fig. 2C, D). After neuronal differentiation, elongation of the cells and neurite-like structures were observed (Fig. 2C, D; indicated using white arrows). Moreover, the expression of NMDAR1 was observed in neurite-like structures as puncta after neuronal differentiation (Fig. 2E and F).

Next, the expression of the neuronal stem cell and neuronal cell marker proteins β-tubulin III and Nestin were examined using western blotting. After neuronal differentiation, the expression levels of β-tubulin III and Nestin were increased in SHED (Fig. 3A–C). In addition, real-time PCR analysis showed that the expression levels of the neuronal cell markers β-tubulin III (Fig. 3D), PSD95 (Fig. 3E), and GABA receptor α2 (Fig. 3F) were increased after neuronal differentiation of SHED. These increases in neuronal cell markers indicated that SHED differentiated into neuronal cells. In addition, Nestin is expressed during the early stages of neuronal differentiation, e.g., neuronal stem cells, progenitors, and immature neuronal cells (Von Bohlen Und Halbach, 2007). Thus, the increase in Nestin expression after neuronal differentiation suggested that neuronally differentiated SHED in this study were in the early stage of neuronal differentiation and were still progressing towards neuronal linage differentiation.

To analyze mitochondrial activity during the neuronal differentiation of SHED, MMP was measured by staining with JC-1. Undifferentiated and neuronally differentiated SHED were incubated with JC-1, and the JC-1 aggregates (red) and monomers (green) were detected by confocal microscopy. After neuronal differentiation for 2 days, the JC-1 aggregates (red) increased when compare with that before neuronal differentiation (Fig. 4A and B, left panel). Furthermore, we analyzed the ratio of JC-1 aggregates/monomers using flow cytometry. The ratio of JC-1 aggregates/monomers was increased by 1.87-fold after neuronal differentiation for 2 days (Fig. 4C–E). Moreover, after neuronal differentiation for 10 days, the ratio of JC-1 aggregates/monomers was increased by 2.88-fold compared with that before neuronal differentiation (Fig. 4F).

Next, we examined the factors involved in mitochondrial activity, mtDNA contents, and mitochondrial mass and morphology during neuronal differentiation of SHED. After neuronal differentiation for 2 or 10 days, the amount of mtDNA was increased (Fig. 5A, B). Next, to evaluate mitochondrial mass, we measured the amount of Tom20, which is often used to measure mitochondrial mass as a mitochondrial marker protein (Bueno et al., 2015; Burbulla et al., 2014). There were no significant differences in the amount of Tom20 before and after neuronal differentiation (Fig. 5C), suggesting that mitochondrial mass was not changed during the neuronal differentiation of SHED. Moreover, we examined morphology of mitochondria during neuronal differentiation of SHED (Fig. 5D–F). After neuronal differentiation, elongated mitochondria were observed in neurite-like structures (Fig. 5E, F; indicated using white arrows). These results indicated that increased MMP and mtDNA and elongated mitochondria were involved in the neuronal differentiation of SHED.

To evaluate the involvement of mitochondrial activity in neuronal differentiation, SHED were treated with rotenone, a mitochondrial complex I inhibitor, and CCCP, a mitochondrial uncoupler, during their neuronal induction. To examine the effects of rotenone and CCCP without reducing cell growth and viability, we examined the concentration-dependent toxicities of rotenone and CCCP in SHED. SHED were cultured in the presence or absence (DMSO) of rotenone or CCCP for 2 days, and the numbers and percentages of living cells were then measured. In the presence of 1,000 nM rotenone and more than 7.5 μM CCCP, the number of living cells was significantly reduced (Fig. 6A, C). In addition, 1,000 nM rotenone and 50 μM CCCP significantly reduced the percentages of living cells (Fig. 6B, D). Next, we evaluated the inhibitory effects of rotenone and CCCP on the MMP under neuronal differentiation conditions. SHED were cultured in neuronal differentiation medium in the presence or absence of 100 nM rotenone and 5 and 7.5 μM CCCP for 2 days, and the MMP was then measured using JC-1. Notably, 100 nM rotenone and 7.5 μM CCCP markedly reduced MMP during the neuronal differentiation of SHED (Fig. 6E, F). In contrast, 5 μM CCCP did not reduced the MMP (Fig. 6F). Thus, these data showed that 100 nM rotenone and 7.5 μM CCCP could be used without substantially reducing cell growth and viability; accordingly, we used 100 nM rotenone and 7.5 μM CCCP for further experiments.

SHED were differentiated into neuronal cells in the presence or absence (DMSO) of 100 nM rotenone and 7.5 μM CCCP for 10 days. The generation of neurite-like structures was reduced in the presence of rotenone and CCCP compared with that observed in the absence of these chemicals (Fig. 7A–C; white arrows). Furthermore, measurement of cell length revealed that the elongation of cells was inhibited by rotenone and CCCP (Fig. 7E), and the expression of β-tubulin III and Nestin was reduced in the presence of rotenone and CCCP (Fig. 7F–H). Because treatment with 7.5 μM CCCP resulted in reduction of number of cells after 2 days of culture (Fig. 6C), we measured the cell numbers after neuronal differentiation for 10 days in the presence or absence (DMSO) of 7.5 μM CCCP. Although the cell numbers showed reduction after treatment with 7.5 μM CCCP (Fig. 6G; 73.0%; compared with DMSO control), similar to our observation after 2 days of culture (71.7%; compared with DMSO and 7.5 μM CCCP treatment in Fig. 6C), no significant difference was observed in the cell numbers between the DMSO and 7.5 μM CCCP treated cells (P=0.12). Accordingly, these results showed that inhibition of mitochondrial activity by rotenone and CCCP reduced the neuronal differentiation of SHED.
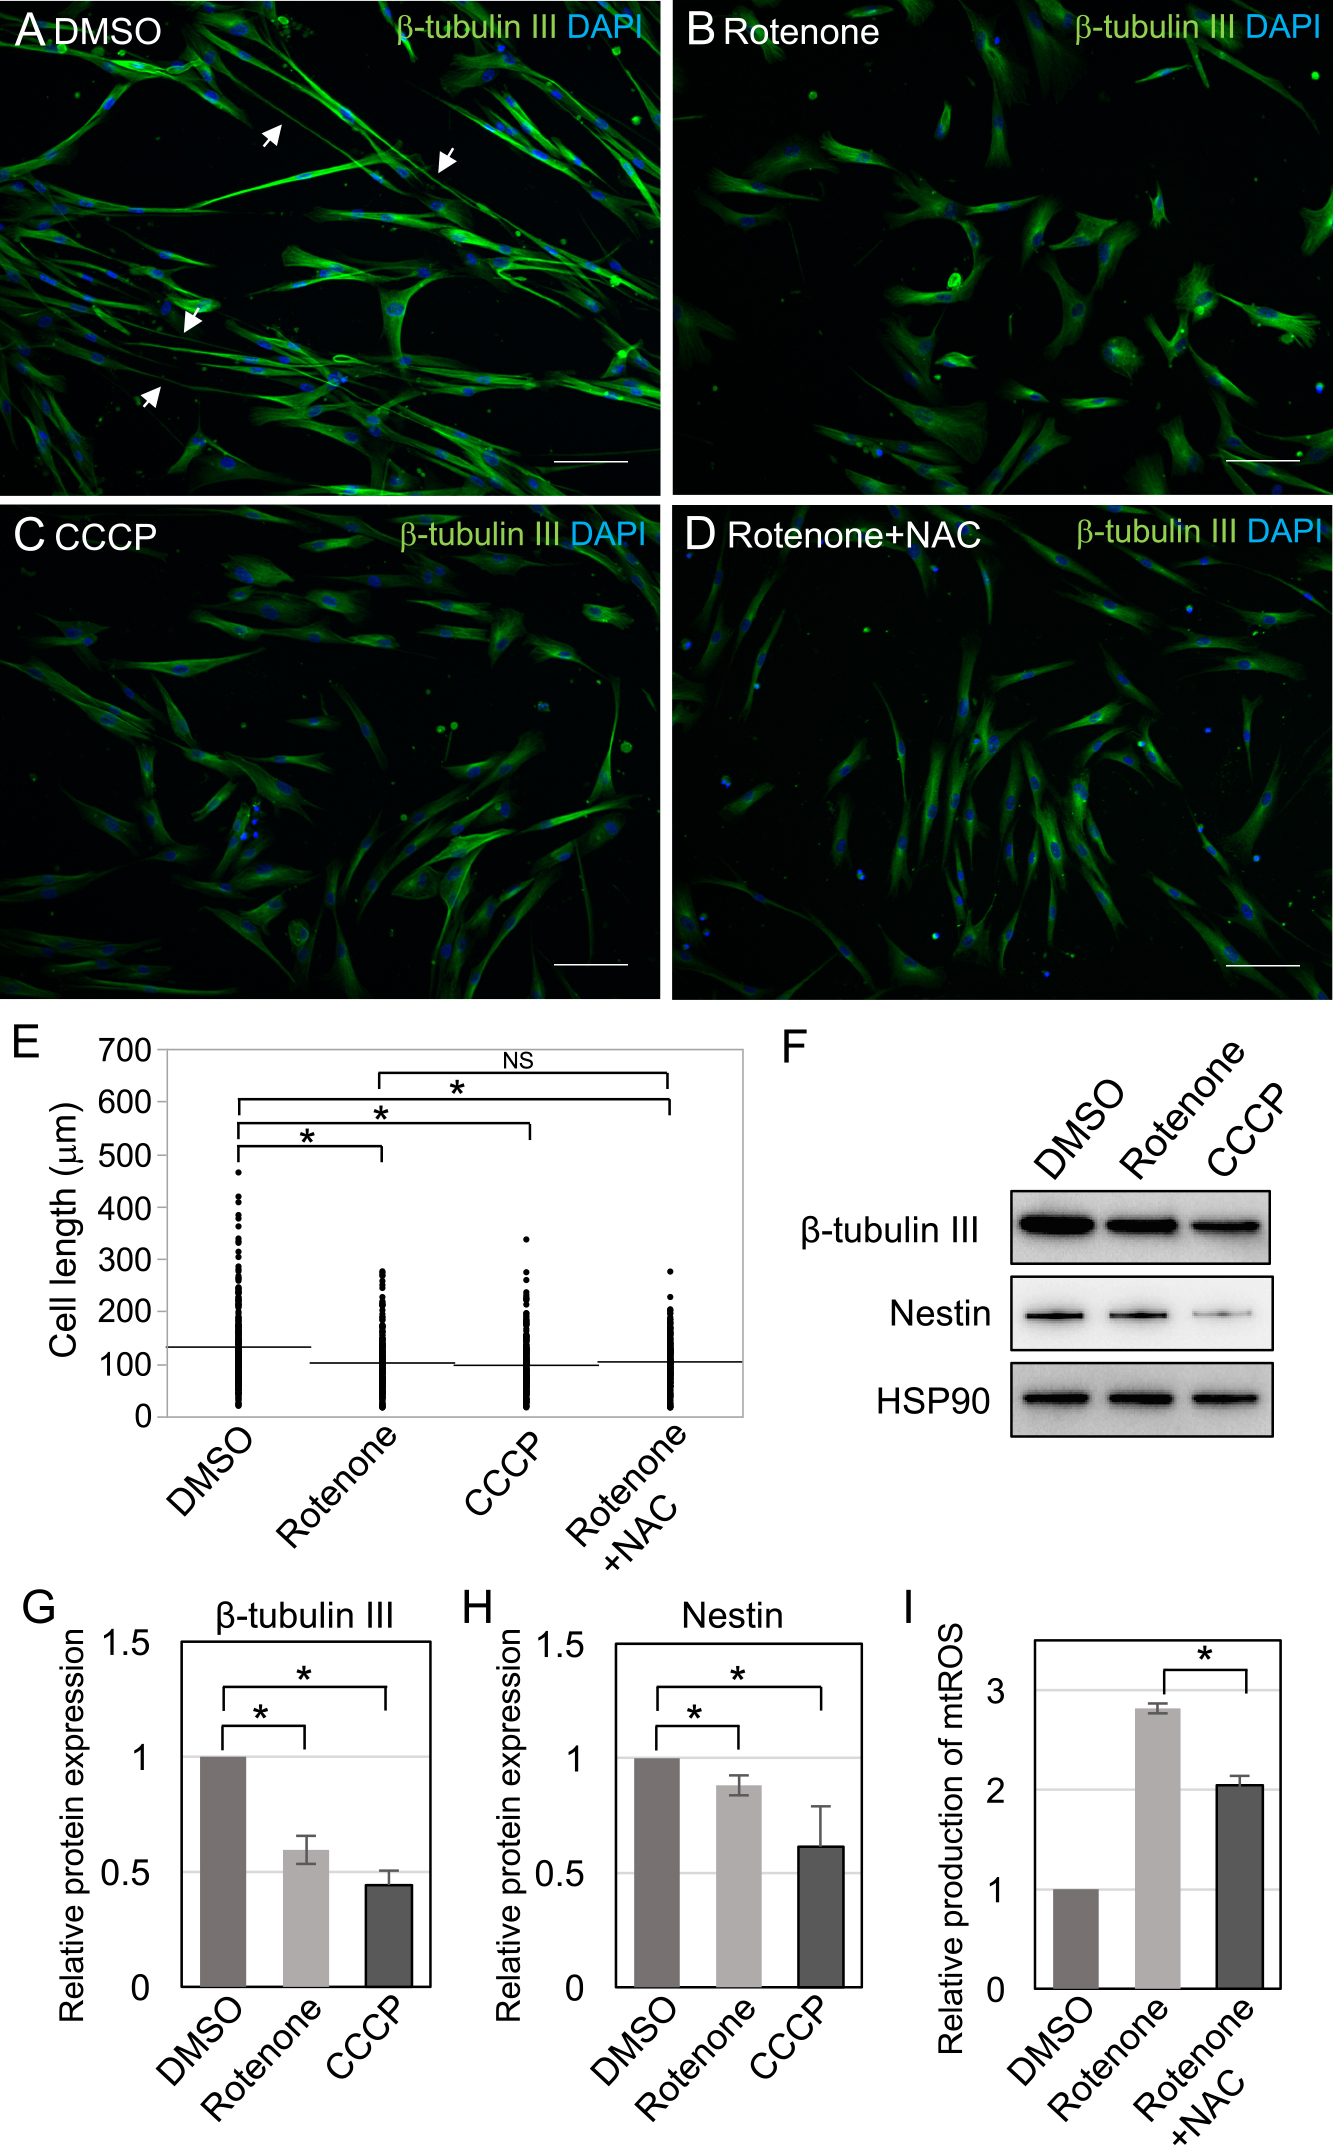
Rotenone increases the production of mtROS (Cadenas et al., 1977), and mtROS production reduces the neuronal differentiation of ESCs (Pereira et al., 2013). mtROS production increased when SHED were cultured with rotenone (Fig. 7I). To prevent the effects of mtROS on neuronal differentiation, we examined the role of the antioxidant NAC. NAC significantly reduced mtROS production increased by rotenone (Fig. 7I). However, when SHED were differentiated into neuronal cells with rotenone and NAC, the reduction of neurite-like structures and elongation of the cells were observed, similar to rotenone treatment alone (Fig. 7D, E). This result indicated that the inhibitory effects of rotenone on neuronal induction of SHED were not caused by mtROS, but were instead caused by reduction of mitochondrial activity.
Discussion
In this study, we demonstrated the involvement of mitochondria in the neuronal differentiation of SHED. The amount of mtDNA was increased during neuronal differentiation. mtDNA contains 37 genes, 13 of which are involved in mitochondrial oxidative phosphorylation (Anderson et al., 1981). The amount of mtDNA is correlated with mitochondrial respiratory activity and changes depending on energy requirements (D’Erchia et al., 2015). Our results showed that the mass of the mitochondria did not change during neuronal differentiation, suggesting that mtDNA content in each mitochondrion was increased and that mitochondrial function was increased during neuronal differentiation of SHED.
Mitochondrial morphology is highly diversified and is correlated with mitochondrial activity. Elongated mitochondria possess high mitochondrial respiratory capacity, and the opposite is also true (Picard et al., 2013). In the present study, elongated mitochondria were observed in neurite-like structures after neuronal differentiation of SHED. Mitochondrial localization in axons and local ATP production were required for the events of neuronal outgrowth, including growth corn motility and cytoskeletal assembly (Bernstein and Bamburg, 2003; Morris and Hollenbeck, 1993; Ruthel and Hollenbeck, 2003; Vaarmann et al., 2016). In addition, elongated mitochondria have been observed in the neurites of cortical neurons during neuronal differentiation (Cho et al., 2014). Thus, our results suggested that localization and elongation of mitochondrial in neurites are important for neuronal development of SHED.
We showed that mitochondrial activity was increased during the neuronal differentiation of SHED and that inhibition of mitochondrial activity delayed neuronal differentiation. Our results were similar to the results of previous studies of the neuronal differentiation of ESCs. Similar to SHED, ESCs also exhibit increased mitochondrial activity during differentiation (Pereira et al., 2013). Furthermore, the inhibition of mitochondrial activity also reduces the neuronal differentiation of ESCs (Pereira et al., 2013). Interestingly, to maintain their stemness, ESCs harbor a limited number of mitochondria and reduce their mitochondrial activity before differentiation (Armstrong et al., 2010; Chen et al., 2012). The mitochondrion is a major site of ROS generation due to oxidative phosphorylation, and high levels of ROS damage both mitochondrial and genomic DNA (Cooke et al., 2003; Shokolenko et al., 2009). Therefore, ESCs are thought to reduce their mitochondrial activity before differentiation to maintain the integrity of their mitochondrial and genomic DNA (Saretzki et al., 2004, 2008). Accordingly, we speculate that SHED may also reduce their mitochondrial activity before differentiation to avoid DNA damage from high levels of ROS in order to maintaining their stemness.
Metabolic changes in glycolysis and oxidative phosphorylation are involved in the differentiation and reprogramming of stem cells. The amounts of mtDNA and ATP levels are reduced during the reprogramming of inducible pluripotent stem cells (iPSCs) (Prigione et al., 2010; Son et al., 2013). In contrast, lactate levels are increased during this period (Prigione et al., 2010). In addition, inhibition of mitochondrial activity by rotenone enhances the reprogramming of somatic cells into iPSCs (Son et al., 2013), and the inhibition of mitochondrial activity by antimycine A increases Oct-4 expression (Pereira et al., 2013). Taken together, these data indicate that low levels of mitochondrial activity tend to maintain stem cells in the undifferentiated state. Thus, the results from our study suggested that rotenone could help to maintain low levels of mitochondrial activity in SHED, resulting in a delay in neuronal differentiation.
Rotenone is an inhibitor of mitochondrial complex I. Mammalian mitochondrial complex I is composed of 45 different proteins, the flavin mononucleotide (FMN), and iron-sulfur clusters (Carroll et al., 2006). FMN accepts two electrons from NADH, which are then transferred to the reducing site of coenzyme Q (CoQ) through the ion-sulfur clusters (Sazanov, 2007). Rotenone binds to the CoQ binding site and inhibits the activity of complex I. Dysfunction of complex I causes mitochondrial diseases, such as Leigh syndrome and mitochondrial encephalomyopathy, lactic acidosis, and stroke-like episodes (MELAS) (Horváth et al., 2008; Martin et al., 2005; Schon and Manfredi, 2003). Leigh syndrome is characterized by a delay in neuron development (Johnson et al., 2016). Our experimental model with SHED and rotenone may be a suitable tool for studying the etiology of mitochondrial diseases and for the identification of novel drugs for the treatment of these diseases.
Acknowledgments
We thank Drs. Y. Ninomiya, H. Nakanishi, T. Yamaza, and K. Sanematsu and all members of the Pediatric & Special Needs Dentistry at Kyushu University Hospital for the valuable suggestions, technical support, and materials. We appreciate the technical assistance provided by the Research Support Center, Research Center for Human Disease Modeling, Kyushu University Graduate School of Medical Sciences. This work was supported by JSPS KAKENHI (grant numbers 25670877 and 16K15839). The authors deny any conflicts of interest related to this study.
References
- Anderson, S., Bankier, A.T., Barrell, B.G., de Bruijn, M.H., Coulson, A.R., Drouin, J., Eperon, I.C., Nierlich, D.P., Roe, B.A., Sanger, F., Schreier, P.H., Smith, A.J., Staden, R., and Young, I.G. 1981. Sequence and organization of the human mitochondrial genome. Nature, 290: 457–465.
- Armstrong, L., Tilgner, K., Saretzki, G., Atkinson, S.P., Stojkovic, M., Moreno, R., Przyborski, S., and Lako, M. 2010. Human induced pluripotent stem cell lines show stress defense mechanisms and mitochondrial regulation similar to those of human embryonic stem cells. Stem Cells, 28: 661–673.
- Bernstein, B.W. and Bamburg, J.R. 2003. Actin-ATP hydrolysis is a major energy drain for neurons. J. Neurosci., 23: 1–6.
- Von Bohlen Und Halbach, O. 2007. Immunohistological markers for staging neurogenesis in adult hippocampus. Cell Tissue Res., 329: 409–420.
- Bueno, M., Lai, Y., Romero, Y., Brands, J., and Stcroix, C. 2015. PINK1 deficiency impairs mitochondrial homeostasis promoting lung fibrosis. J. Clin. Invest., 125: 521–538.
- Burbulla, L.F., Fitzgerald, J.C., Stegen, K., Westermeier, J., Thost, A.-K., Kato, H., Mokranjac, D., Sauerwald, J., Martins, L.M., Woitalla, D., Rapaport, D., Riess, O., Proikas-Cezanne, T., Rasse, T.M., and Krüger, R. 2014. Mitochondrial proteolytic stress induced by loss of mortalin function is rescued by Parkin and PINK1. Cell Death Dis., 5: e1180.
- Cadenas, E., Boveris, A., Ragan, C.I., and Stoppani, A.O.M. 1977. Production of superoxide radicals and hydrogen peroxide by NADH-ubiquinone reductase and ubiquinol-cytochrome c reductase from beef-heart mitochondria. Arch. Biochem. Biophys., 180: 248–257.
- Carroll, J., Fearnley, I.M., Skehel, J.M., Shannon, R.J., Hirst, J., and Walker, J.E. 2006. Bovine complex I is a complex of 45 different subunits. J. Biol. Chem., 281: 32724–32727.
- Chen, C.T., Hsu, S.H., and Wei, Y.H. 2012. Mitochondrial bioenergetic function and metabolic plasticity in stem cell differentiation and cellular reprogramming. Biochim. Biophys. Acta - Gen. Subj., 1820: 571–576.
- Cho, B., Cho, H.M., Kim, H.J., Jeong, J., Park, S.K., Hwang, E.M., Park, J.-Y., Kim, W.R., Kim, H.J., and Sun, W. 2014. CDK5-dependent inhibitory phosphorylation of Drp1 during neuronal maturation. Exp. Mol. Med., 46: e105.
- Cooke, M.S., Evans, M.D., Dizdaroglu, M., and Lunec, J. 2003. Oxidative DNA damage: mechanisms, mutation, and disease. FASEB J., 17: 1195–1214.
- D’Erchia, A.M., Atlante, A., Gadaleta, G., Pavesi, G., Chiara, M., De Virgilio, C., Manzari, C., Mastropasqua, F., Prazzoli, G.M., Picardi, E., Gissi, C., Horner, D., Reyes, A., Sbisà, E., Tullo, A., and Pesole, G. 2015. Tissue-specific mtDNA abundance from exome data and its correlation with mitochondrial transcription, mass and respiratory activity. Mitochondrion, 20: 13–21.
- Fujii, H., Matsubara, K., Sakai, K., Ito, M., Ohno, K., Ueda, M., and Yamamoto, A. 2015. Dopaminergic differentiation of stem cells from human deciduous teeth and their therapeutic benefits for Parkinsonian rats. Brain Res., 1613: 59–72.
- Horváth, R., Reilmann, R., Holinski-Feder, E., Ringelstein, E.B., and Klopstock, T. 2008. The role of complex I genes in MELAS: A novel heteroplasmic mutation 3380G>A in ND1 of mtDNA. Neuromuscul. Disord., 18: 553–556.
- Jarmalavičiūtė, A., Tunaitis, V., Strainienė, E., Aldonytė, R., Ramanavičius, A., Venalis, A., Magnusson, K.-E., and Pivoriūnas, A. 2013. A New Experimental Model for Neuronal and Glial Differentiation Using Stem Cells Derived from Human Exfoliated Deciduous Teeth. J. Mol. Neurosci., 51: 307–317.
- Johnson, J., Lee, W., Frazier, A.E., Vaghjiani, V., Laskowski, A., Rodriguez, A.L., Cagnone, G.L., McKenzie, M., White, S.J., Nisbet, D.R., Thorburn, D.R., and St. John, J.C. 2016. Deletion of the Complex I Subunit NDUFS4 Adversely Modulates Cellular Differentiation. Stem Cells Dev., 25: 239–250.
- Keogh, M.J. and Chinnery, P.F. 2015. Mitochondrial DNA mutations in neurodegeneration. Biochim. Biophys. Acta, 1847: 1401–1411.
- Kirby, D.M., Rennie, K.J., Smulders-Srinivasan, T.K., Acin-Perez, R., Whittington, M., Enriquez, J.A., Trevelyan, A.J., Turnbull, D.M., and Lightowlers, R.N. 2009. Transmitochondrial embryonic stem cells containing pathogenic mtDNA mutations are compromised in neuronal differentiation. Cell Prolif., 42: 413–424.
- Ma, L., Makino, Y., Yamaza, H., Akiyama, K., Hoshino, Y., Song, G., Kukita, T., Nonaka, K., Shi, S., and Yamaza, T. 2012. Cryopreserved Dental Pulp Tissues of Exfoliated Deciduous Teeth Is a Feasible Stem Cell Resource for Regenerative Medicine. PLoS One, 7: e51777.
- Martin, M.A., Blazquez, A., Gutierrez-Solana, L.G., Fernandez-Moreira, D., Briones, P., Andreu, A.L., Garesse, R., Campos, Y., and Arenas, J. 2005. Leigh syndrome associated with mitochondrial complex I deficiency due to a novel mutation in the NDUFS1 gene. Arch. Neurol., 62: 659–661.
- Miura, M., Gronthos, S., Zhao, M., Lu, B., Fisher, L.W., Robey, P.G., and Shi, S. 2003. SHED : Stem cells from human exfoliated deciduous teeth. Proc. Natl. Acad. Sci. USA, 100: 5807–5812.
- Morris, R.L. and Hollenbeck, P.J. 1993. The regulation of bidirectional mitochondrial transport is coordinated with axonal outgrowth. J. Cell Sci., 104(Pt 3): 917–927.
- Nourbakhsh, N., Soleimani, M., Taghipour, Z., Karbalaie, K., Mousavi, B., Talebi, A., Nadali, F., Tanhaei, S., Nematollahi, M., Rabiei, F., Mardani, M., Bahramiyan, H., Torabinejad, M., and Baharvand, H. 2011. Induced in vitro differentiation of neural-like cells from human exfoliated deciduous teeth-derived stem cells. Int. J. Dev. Biol., 55: 189–195.
- Pastrana, E., Silva-Vargas, V., and Doetsch, F. 2011. Eyes wide open: a critical review of sphere-formation as an assay for stem cells. Cell Stem Cell, 8: 486–498.
- Pereira, S.L., Grãos, M., Rodrigues, A.S., Anjo, S.I., Carvalho, R.A., Oliveira, P.J., Arenas, E., and Ramalho-Santos, J. 2013. Inhibition of mitochondrial complex III blocks neuronal differentiation and maintains embryonic stem cell pluripotency. PLoS One, 8: e82095.
- Picard, M., Shirihai, O.S., Gentil, B.J., and Burelle, Y. 2013. Mitochondrial morphology transitions and functions: implications for retrograde signaling? Am. J. Physiol. Regul. Integr. Comp. Physiol., 304: R393-406.
- Prigione, A., Fauler, B., Lurz, R., Lehrach, H., and Adjaye, J. 2010. The senescence-related mitochondrial/oxidative stress pathway is repressed in human induced pluripotent stem cells. Stem Cells, 28: 721–733.
- Reers, M., Smith, T.W., and Chen, L.B. 1991. J-aggregate formation of a carbocyanine as a quantitative fluorescent indicator of membrane potential. Biochemistry, 30: 4480–4486.
- Ruthel, G. and Hollenbeck, P.J. 2003. Response of mitochondrial traffic to axon determination and differential branch growth. J. Neurosci., 23: 8618–8624.
- Sakai, K., Yamamoto, A., Matsubara, K., Nakamura, S., Naruse, M., Yamagata, M., Sakamoto, K., Tauchi, R., Wakao, N., Imagama, S., Hibi, H., Kadomatsu, K., Ishiguro, N., and Ueda, M. 2012. Human dental pulp-derived stem cells promote locomotor recovery after complete transection of the rat spinal cord by multiple neuro-regenerative mechanisms. J. Clin. Invest., 122: 80–90.
- Saretzki, G., Armstrong, L., Leake, A., Lako, M., and von Zglinicki, T. 2004. Stress defense in murine embryonic stem cells is superior to that of various differentiated murine cells. Stem Cells, 22: 962–971.
- Saretzki, G., Walter, T., Atkinson, S., Passos, J.F., Bareth, B., Keith, W.N., Stewart, R., Hoare, S., Stojkovic, M., Armstrong, L., von Zglinicki, T., and Lako, M. 2008. Downregulation of multiple stress defense mechanisms during differentiation of human embryonic stem cells. Stem Cells, 26: 455–464.
- Sazanov, L.A. 2007. Respiratory complex I: Mechanistic and structural insights provided by the crystal structure of the hydrophilic domain. Biochemistry, 46: 2275–2288.
- Schon, E.A. and Manfredi, G. 2003. Neuronal degeneration and mitochondrial dysfunction. J. Clin. Invest., 111: 303–312.
- Shokolenko, I., Venediktova, N., Bochkareva, A., Wilson, G.L., and Alexeyev, M.F. 2009. Oxidative stress induces degradation of mitochondrial DNA. Nucleic Acids Res., 37: 2539–2548.
- Son, M.J., Jeong, B.R., Kwon, Y., and Cho, Y.S. 2013. Interference with the mitochondrial bioenergetics fuels reprogramming to pluripotency via facilitation of the glycolytic transition. Int. J. Biochem. Cell Biol., 45: 2512–2518.
- Vaarmann, A., Mandel, M., Zeb, A., Wareski, P., Liiv, J., Kuum, M., Antsov, E., Liiv, M., Cagalinec, M., Choubey, V., and Kaasik, A. 2016. Mitochondrial biogenesis is required for axonal growth. Development, 143: 1981-1992.
- Venegas, V. and Halberg, M.C. 2012. Measurement of mitochondrial DNA copy number. In: Methods in Molecular Biology (Lee-Jun C Wong, ed.). New York (NY): Humana Press, pp. 327–335.
- Wang, J., Wang, X., Sun, Z., Wang, X., Yang, H., Shi, S., and Wang, S. 2010. Stem cells from human-exfoliated deciduous teeth can differentiate into dopaminergic neuron-like cells. Stem Cells Dev., 19: 1375–1383.
- Yamaza, T., Alatas, F.S., Yuniartha, R., Yamaza, H., Fujiyoshi, J.K., Yanagi, Y., Yoshimaru, K., Hayashida, M., Matsuura, T., Aijima, R., Ihara, K., Ohga, S., Shi, S., Nonaka, K., and Taguchi, T. 2015. In vivo hepatogenic capacity and therapeutic potential of stem cells from human exfoliated deciduous teeth in liver fibrosis in mice. Stem Cell Res. Ther., 6: 171.

