Introduction
Inflammatory bowel disease (IBD) is a chronic relapsing disorder of the gastrointestinal tract, which causes diarrhea, bloody stool, weight loss, and various other symptoms. The two major types of IBD are ulcerative colitis (UC) and Crohn’s disease (CD) (Podolsky, 2002). The prevalence rate of UC and CD is reported to be 505 and 322 per 100,000 persons, respectively, in Europe (Molodecky et al., 2012), whereas in Japan, it is reported to be 134 and 32 per 100,000 persons, respectively (Japanese Ministry of Health, Labour and Welfare, 2015). The number of IBD patients is increasing worldwide. Although the etiology of IBD remains largely unknown, it is believed to develop in genetically susceptible individuals exposed to environmental risk factors (Danese et al., 2004; Mikhailov and Furner, 2009; Podolsky, 2002). Therefore, identification of genetic factors contributing to the onset of IBD is of prime importance. In fact, many researchers have identified such susceptible genes by genome-wide association studies (GWAS) (Anderson et al., 2011; Franke et al., 2010; Jostins et al., 2012; Liu et al., 2015).
Glycosylation is the major type of post-translational modification that primarily occurs in newly synthesized proteins during the course of membrane trafficking from the endoplasmic reticulum to the Golgi apparatus. The two major types of protein glycosylation are N- and O-glycosylation. Apweiler et al. estimated that more than half of all proteins in nature are glycoproteins (Apweiler et al., 1999). Glycosylation modulates protein function, localization, and intermolecular interactions. Therefore, dysregulation of protein glycosylation has been implicated in various diseases such as type 2 diabetes (Ohtsubo et al., 2005), Alzheimer’s disease (Kizuka et al., 2015), and IBD (Fu et al., 2011; Fujii et al., 2016; Theodoratou et al., 2014). For instance, levels of core fucosylation in T cells increased in inflamed mucosa in IBD patients. Core fucosylation is catalyzed by α1-6 fucosyltransferase (FUT8), the deficiency of which ameliorates colitis in mice (Fujii et al., 2016). On the other hand, mice lacking intestinal epithelial cell (IEC)-intrinsic core 1-derived O-glycans spontaneously develop colitis due to the impairment of the mucus barrier (Fu et al., 2011). These reports suggest that both N- and O-glycosylation affect the susceptibility to IBD, increasing the possibility that certain N- and O-glycosylation regulatory molecules contribute to the pathogenesis of IBD through multiple mechanisms.
Alpha-mannosidase II (α-MII), encoded by MAN2A1 (Man2a1 in mouse), is present in the medial Golgi apparatus and cleaves two terminal mannose residues in the process of N-glycosylation. Newly synthesized proteins are initially glycosylated with precursor oligosaccharides at asparagine residues in the Asn-X-Ser/Thr consensus sequence at the endoplasmic reticulum. The proteins are subsequently transferred to the Golgi apparatus to form complex-type N-glycans via high-mannose-type and then hybrid-type N-glycans. α-MII catalyzes the conversion from hybrid- to complex-type N-glycans (Moremen, 2002; Rose, 2012). Alpha-mannosidase IIx (α-MIIx), encoded by MAN2A2 (Man2a2 in mouse), is an isozyme of α-MII that can compensate for α-MII deficiency (Akama et al., 2006) because, similar to α-MII, it also catalyzes the formation of complex-type N-glycans. As a result, in most cell types, except erythroid and kidney cells, complex-type N-glycans are formed normally despite the absence of α-MII (Chui et al., 1997, 2001). However, a massive reduction of complex-type N-glycans in erythroid and kidney cells predisposes the α-MII-deficient mice to dyserythropoiesis (Chui et al., 1997) and glomerulonephritis (Chui et al., 2001; Green et al., 2007). Importantly, complex-type N-glycans, but not high-mannose- and hybrid-type N-glycans, increased in the serum of UC patients. In particular, the elevation of highly sialylated multi-branched N-glycans significantly correlated with disease activity (Miyahara et al., 2013). However, its pathological relevance is yet to be determined.
In this study, we analyzed single nucleotide polymorphisms (SNPs) of glycosylation-related genes in IBD patients and identified MAN2A1 as a candidate UC-associated gene. Gene expression analysis of Man2a1 and Man2a2 led us to focus on IEC-intrinsic α-MII. We therefore generated IEC-specific α-MII-deficient (α-MIIΔIEC) mice and found that these mice were less susceptible to dextran sulfate sodium (DSS)-induced colitis (Okayasu et al., 1990; Perse and Cerar, 2012) compared with control mice. This result demonstrated that IEC-specific N-glycosylation mediated by α-MII accelerates intestinal inflammation. Thus, the SNPs in MAN2A1 could be new genetic factors contributing to the development of UC.
Materials and Methods
GWAS subjects and analysis
The GWAS data were obtained from previous reports; 371 cases with UC, 372 cases with CD, and 3,321 controls in Japan were enrolled (Asano et al., 2009; Fuyuno et al., 2016; Yamazaki et al., 2013). Regional plots were generated by LocusZoom (Pruim et al., 2010) using the 1000 Genomes Project Asian data (Nov 2014) as reference data.
Animals
C57BL/6J mice were purchased from CLEA Japan, Inc (Tokyo, Japan). Mice carrying loxP-flanked Man2a1 alleles (α-MIIF/F) (Chui et al., 1997) were obtained from The Jackson Laboratory (Bar Harbor, ME, USA). To generate α-MIIΔIEC mice, we crossed α-MIIF/F mice with Villin-Cre transgenic mice obtained from The Jackson Laboratory. All studies were approved by the Animal Care Committee of Keio University.
DSS-induced colitis
Mice were orally administered with 2% DSS (molecular weight: 36,000–50,000, MP Biomedicals, LLC, Santa Ana, CA, USA) in drinking water for 7 days. Body weight, drinking water consumption, and clinical score were monitored daily. Clinical score was determined according to previously reported criteria (Wirtz et al., 2007) on the basis of stool consistency (0, normal; 1, soft but still formed; 2, very soft; 3, diarrhea) and hematochezia (0, negative occult blood; 1, positive occult blood; 2, blood traces in stool visible; 3, rectal bleeding). Fecal occult blood was examined using ColoScreen-ES (Helena Laboratories, Beaumont, TX, USA).
Histology
Colonic tissue samples were fixed in 10% formalin neutral buffer solution (Mildform 10N, Wako Pure Chemical Industries, Ltd., Tokyo, Japan) overnight. After fixation, the samples were embedded in paraffin and then cut into 3-μm sections. The sections were deparaffinized, rehydrated, and stained with hematoxylin (Agilent Technologies, Inc., Santa Clara, CA, USA) and eosin (Wako) or with alcian blue solution (Wako) and nuclear fast red (Vector Laboratories, Inc., Burlingame, CA, USA) and then mounted with Mount-Quick (Daido Sangyo Co., Ltd., Tokyo, Japan). The specimens were examined histologically for scoring the degree of colitis based on the following criteria in a blinded manner: crypt architecture, inflammatory cell infiltration, and goblet cell depletion.
Preparation of colonic lamina propria cells
Colonic lamina propria cells were prepared as described previously (Goodyear et al., 2014) with some modifications. The colons were isolated, opened longitudinally, washed with HBSS (Nacalai Tesque, Inc., Kyoto, Japan), cut into four segments, and shaken in HBSS containing 1 mM dithiothreitol, 20 mM EDTA, and 12.5 mM HEPES (Nacalai Tesque) at 37°C for 20 min. After vortexing, the colonic tissues were centrifuged at 70×g for 30 s, and the supernatant was discarded. The tissues were shaken in HBSS containing 20 mM EDTA and 12.5 mM HEPES at 37°C for 20 min. The tissues were then minced and dissociated with RPMI1640 containing 0.2 U/ml Liberase TM (Roche Diagnostics, Mannheim, Germany), 0.125 mg/ml DNase I (Merck, Darmstadt, Germany), 2% FCS (MP Biomedicals), 100 U/ml penicillin, 100 μg/ml streptomycin (Nacalai Tesque), and 25 mM HEPES at 37°C for 30 min to obtain single-cell suspensions. After filtering, the single-cell suspensions were washed with HBSS and subjected to flow cytometry analysis.
To prepare stromal cells, colonic tissues were treated with HBSS containing 1 mM dithiothreitol, 20 mM EDTA, and 12.5 mM HEPES at 37°C for 20 min on a stirrer. The tissues were then minced and dissociated with RPMI1640 containing 0.5 mg/ml collagenase (Wako), 0.125 mg/ml DNase I, 2% FCS, 100 U/ml penicillin, 100 μg/ml streptomycin, and 20 mM HEPES at 37°C for 30 min to obtain single-cell suspensions, which were subjected to cell sorting.
Flow cytometry and cell sorting
Colonic lamina propria cells were incubated with anti-mouse CD16/CD32 antibody (93; BioLegend, Inc., San Diego, CA, USA) to block Fc receptors and then stained using antibodies conjugated with fluorescein isothiocyanate (FITC), phycoerythrin (PE), PE-Cy7, allophycocyanin (APC), APC-Cy7, redFluor 710, eFluor 450, Brilliant Violet 510, or Brilliant Ultraviolet 737. Anti-CD31 (390), anti-Ly-6C (AL-21), anti-CD45R/B220 (RA3-6B2), and anti-RORγt (Q31-378) antibodies were obtained from BD Biosciences (San Jose, CA, USA); Anti-CX3CR1 (SA011F11), anti-CD326 (G8.8), anti-Podoplanin (8.1.1) and anti-CD45 (30-F11) antibodies from BioLegend; Anti-CD11b (M1/70), anti-CD45R/B220 (RA3-6B2), anti-MHC Class II (MS/114.15.2), anti-CD326 (G8.8), anti-CD4 (RM4-5) and anti-FoxP3 (FJK-16s) antibodies from Thermo Fisher Scientific (Waltham, MA, USA); and anti-CD11c (N418), anti-Ly-6G (1A8), and anti-CD3 (17A2) antibodies from Tonbo Biosciences (San Diego, CA, USA). 7-AAD (BioLegend) was added to the cell suspension to label dead cells. To analyze complex-type N-glycans, cells from bone marrow and colonic epithelium were stained with 2 μg/ml biotinylated E-phytohemagglutinin (E-PHA) (Vector Laboratories). Specific binding of E-PHA was detected using Streptavidin-FITC (Thermo Fisher Scientific). For intracellular staining of FoxP3 and RORγt, the cells were fixed, permeabilized and stained with anti-FoxP3 and anti-RORγt antibodies using the Foxp3/Transcription Factor Staining Buffer Set (Thermo Fisher Scientific) after staining for surface antigens. Dead cells were detected using Fixable Viability Stain 780 (BD Biosciences) for intracellular staining. The stained cells were analyzed by LSR II Flow Cytometer (BD Biosciences). The number of leukocytes was determined using Precision Count Beads (BioLegend) according to the manufacturer’s protocol. CD45+CD3+B220– cells, CD45+CD3–B220+ cells, CD45+CD3–B220– cells, and CD45–CD326–CD31–Podoplanin+ cells were sorted by FACS Aria III (BD Biosciences).
Isolation of IECs
IECs were isolated as described previously (Hase et al., 2005) with some modifications. Briefly, colonic tissues were treated with HBSS containing 1 mM dithiothreitol and 30 mM EDTA on ice for 20 min. Intestinal epithelial sheets were stripped using a 1-ml plastic syringe equipped with a 26-gauge fine needle. The stripped epithelial sheets were washed with ice-cold HBSS and lysed in either Buffer RLT (RNeasy Mini Kit, Qiagen, Hilden, Germany) containing 1% 2-mercaptoethanol (Nacalai Tesque) or TRIzol (Thermo Fisher Scientific) to purify total RNA before subjecting to qPCR analysis. For immunoblotting and lectin blotting, isolated IECs were lysed in NP-40 lysis buffer (50 mM Tris-HCl, pH 7.5, 150 mM NaCl, 2 mM EDTA, and 0.5% NP-40) containing cOmpleteTM protease inhibitor cocktail (Roche Diagnostics) and then centrifuged at 20,400×g for 10 min. The supernatants were aliquoted and stored at –80°C until further use. Enrichment of IECs was confirmed by qPCR (Data not shown).
To analyze IECs by flow cytometry, colonic tissues were gently shaken in RPMI1640 medium containing 1 mM dithiothreitol, 2% FCS, 100 U/ml penicillin, 100 μg/ml streptomycin, 25 mM HEPES, and 10 μM Y-27632 (Nacalai Tesque) at 37°C for 20 min. Then the colonic tissues were centrifuged at 70×g for 30 s, and the supernatant was collected. The tissues were shaken in HBSS containing 20 mM EDTA, 12.5 mM HEPES, and 10 μM Y-27632 at 37°C for 20 min 2 times. All supernatants were collected and subjected to flow cytometry analysis. IECs were defined as CD326+CD45– cells.
qPCR
Total RNA from colonic tissues, colonic epithelial cells, and sorted cells was prepared using RNeasy Mini Kit or TRIzol according to the manufacturers’ protocol. The samples were reverse-transcribed using iScript Advanced cDNA Synthesis Kit for RT-qPCR (Bio-Rad Laboratories, Inc., Hercules, CA, USA), and synthesized cDNA was used as a template in qPCR experiments with SsoAdvanced Universal SYBR Green Supermix and analyzed with CFX96 Real-time system and CFX Manager software (Bio-Rad Laboratories). The relative expression level was calculated by the ΔΔCt method using Tbp as a reference gene unless otherwise stated. All primers were purchased from Hokkaido System Science Co., Ltd. (Sapporo, Japan). The sequences of the primer sets are available upon request. Specificity was confirmed by agarose gel electrophoresis of reaction products and by the inclusion of reverse transcriptase- and template-free control.
Immunoblotting and lectin blotting
The protein concentration of samples was determined using Pierce BCA protein assay kit (Thermo Fisher Scientific). Samples were mixed with Laemmli sample buffer (Bio-Rad Laboratories) and denatured at 95°C for 5 min. Denatured samples were subjected to SDS-PAGE and transferred onto PVDF membrane (Immobilon-P, Merck). For immunoblotting, the membranes were blocked with 5% skim milk (Nacalai Tesque) at room temperature for 30 min and then incubated with a mouse anti-α-MII (1:100, Santa Cruz Biotechnology, Inc., Santa Cruz, CA, USA) or a mouse anti-glyceraldehyde 3-phosphate dehydrogenase (GAPDH) (1:500, Merck) antibody at 4°C overnight. After washing with Tris-buffered saline containing 0.1% Tween 20 (TBS-T), the membranes were incubated with anti-mouse IgG, HRP-linked antibody (1:2000, Cell Signaling Technology, Inc., Danvers, MA, USA).
For lectin blotting, the membranes were blocked with 3% bovine serum albumin (Nacalai Tesque) at 4°C overnight and then incubated with 2 μg/ml biotinylated E-PHA at room temperature for 1 h. After washing with TBS-T, the membranes were incubated with streptavidin-HRP (1:2000, Cell Signaling Technology) at room temperature for 1 h. Signals were detected with Chemi-Lumi One L (Nacalai Tesque) and visualized by ImageQuant LAS 4000 (GE Healthcare, Little Chalfont, UK). The intensity of the bands was quantified by ImageJ software (National Institutes of Health).
Metagenomic 16S rRNA sequencing
Approximately 50 mg of mouse fecal samples were collected into 2-ml plastic tubes with 0.1 mm zirconia/silica beads (BioSpec Products, Inc., Bartlesville, OK, USA) and 3.0 mm zirconia beads (Bio Medical Science Co., Ltd., Tokyo, Japan). The fecal samples were homogenized at 1,500 rpm for 10 min with Shake Master Neo (Bio Medical Science) after adding Inhibit EX buffer of QIAamp Fast DNA Stool Mini Kit (Qiagen). Subsequently, genomic DNA was extracted with the kit according to the manufacturer’s protocol and was resuspended at 5 ng/μl in 10 mM Tris-HCl buffer. Libraries for 16S rRNA genes were prepared following a protocol in an Illumina technical note (Illumina, 2013). Briefly, each DNA sample was amplified by PCR using primers specific for variable regions 3 and 4 of the 16S ribosomal RNA gene with KAPA HiFi HS ReadyMix (Kapa Biosystems, Inc., Wilmington, MA, USA). The PCR products were purified using Agencourt AMPure XP Beads (Beckman Coulter, Inc., Brea, CA, USA) and appended with Nextera XT index kit (Illumina, Inc., San Diego, CA, USA) by PCR. The libraries were further purified with Agencourt AMPure XP Beads and pooled after diluting to 4 nM with 10 mM Tris-HCl buffer. The pooled samples were sequenced by Miseq system (Illumina) with a 2×300-base pair protocol.
Bacterial composition analysis
Join_paired_ends.py script of QIIME (Caporaso et al., 2010) was used with fastq-join method to join paired-end reads, and cutadapt was used to trim sequencing adaptor sequences (Martin, 2011). FASTQ files were subsequently converted to FASTA files and chimera reads were removed using identify_chimeric_seqs.py script and filter_fasta.py script of QIIME with usearch61. The individual sample FASTA files were then concatenated into a single FASTA file and pick_open_reference_otus.py script of QIIME was used for operational taxonomic unit (OTU) picking. Taxonomy was assigned using assign_taxonomy.py script of QIIME with the RDP classifier and the Greengenes reference database clustered at 97% identity. An OTU table was generated with make_otu_table.py script of QIIME, and OTUs lower than 0.005% were removed using the filter_otus_from_otu_table.py script of QIIME. Samples were subsampled to a depth of 5,000 reads per sample, and diversity analysis was performed using core_diversity_analyses.py script of QIIME. All of the sequences analyzed in this study are deposited in the DNA Data Bank of Japan (DDBJ)/GenBank/European Molecular Biology Laboratory database under accession number DRA006311.
Chemotaxis assay
Chemotactic activity of neutrophils was assessed as described previously (Tokieda et al., 2015) with some modifications. Bone marrow cells were flushed out of the femur and the tibia with RPMI1640 and then passed through a 70-μm cell strainer. Red blood cells were removed using RBC Lysis Buffer (BioLegend). The cells were incubated with anti-mouse CD16/CD32 antibody and then stained with anti-CD11b and anti-Ly-6G antibodies. 1×10⁶ cells were seeded in the upper chamber of 3-μm pore size transwell (Corning, Inc., Corning, NY, USA). Recombinant mouse CXCL2 (BioLegend) were placed in the bottom chamber. After incubation for 1 h, the cells in bottom chamber were collected and analyzed by flow cytometry. The number of migrated neutrophils was determined using Precision Count Beads.
Statistical analysis
Values are expressed as the mean±standard deviation (SD) or mean±standard error of the mean (SEM). Differences between two or more groups were analyzed by the Student’s t-test or ANOVA followed by the Tukey’s test, respectively. When variances were not homogeneous, the data were analyzed by the Mann–Whitney U test or the Kruskal–Wallis test. To evaluate the correlation between two variables, we calculated Pearson correlation coefficient. GraphPad Prism version 7 was used for all statistical analyses. Differences were considered statistically significant at P values less than 0.05.
Results
MAN2A1 as an UC-associated candidate gene
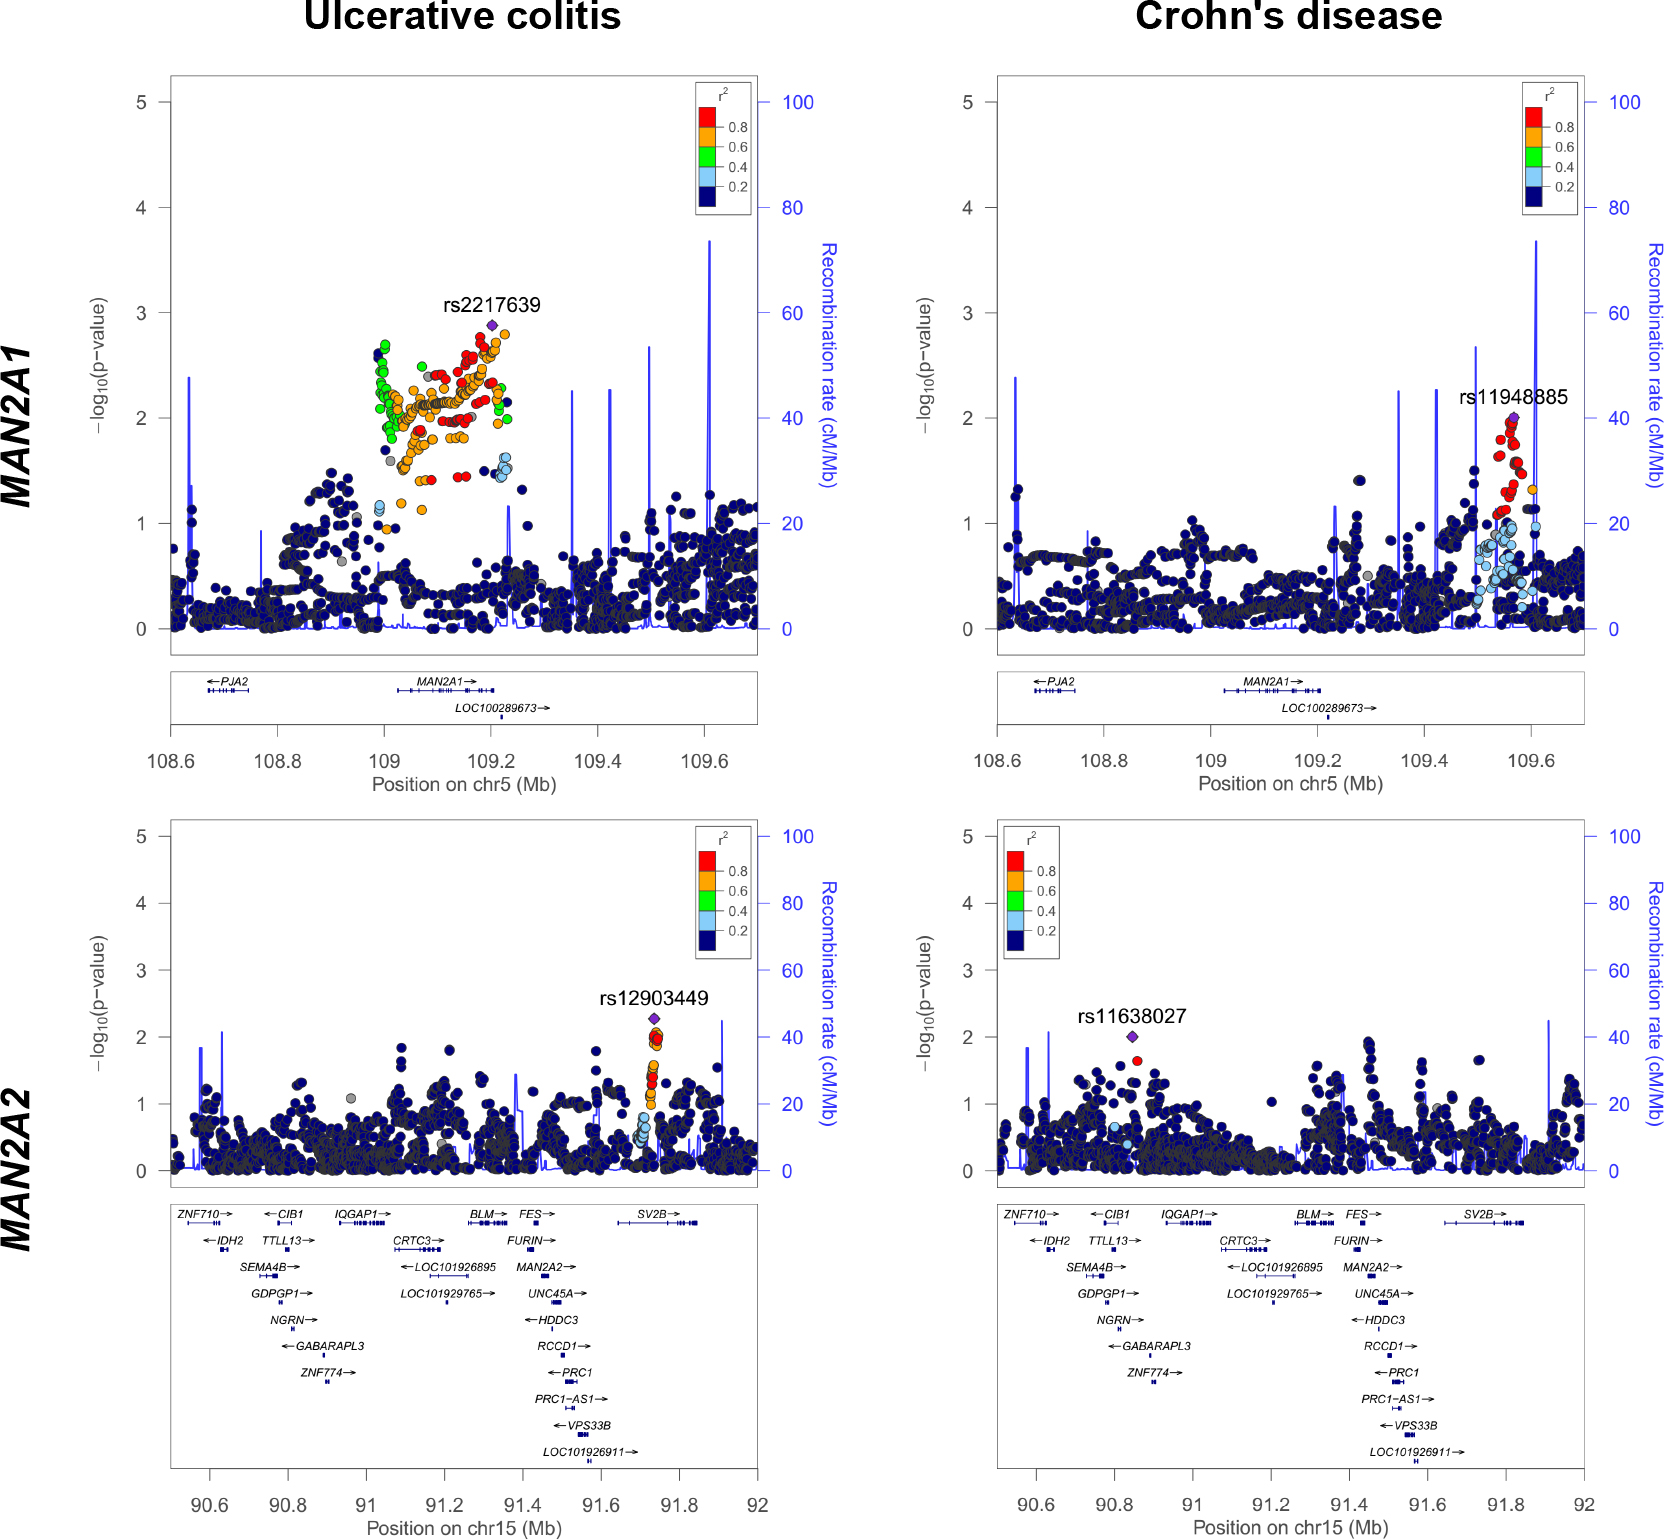
To examine the association between glycosylation-related genes and IBD, we extracted data of candidate genes with 1 Mb margin from imputed GWAS data that was previously reported (Fuyuno et al., 2016). As a result, association signals were distributed closely around the MAN2A1 locus in UC, but not in CD, patients (Fig. 1). In contrast, there were no association signals around the MAN2A2 locus. These results suggest that the SNPs in MAN2A1 are candidate genetic factors contributing to the onset of disease in Japanese UC patients.
α-MII-deficient epithelium fails to form complex-type N-glycans
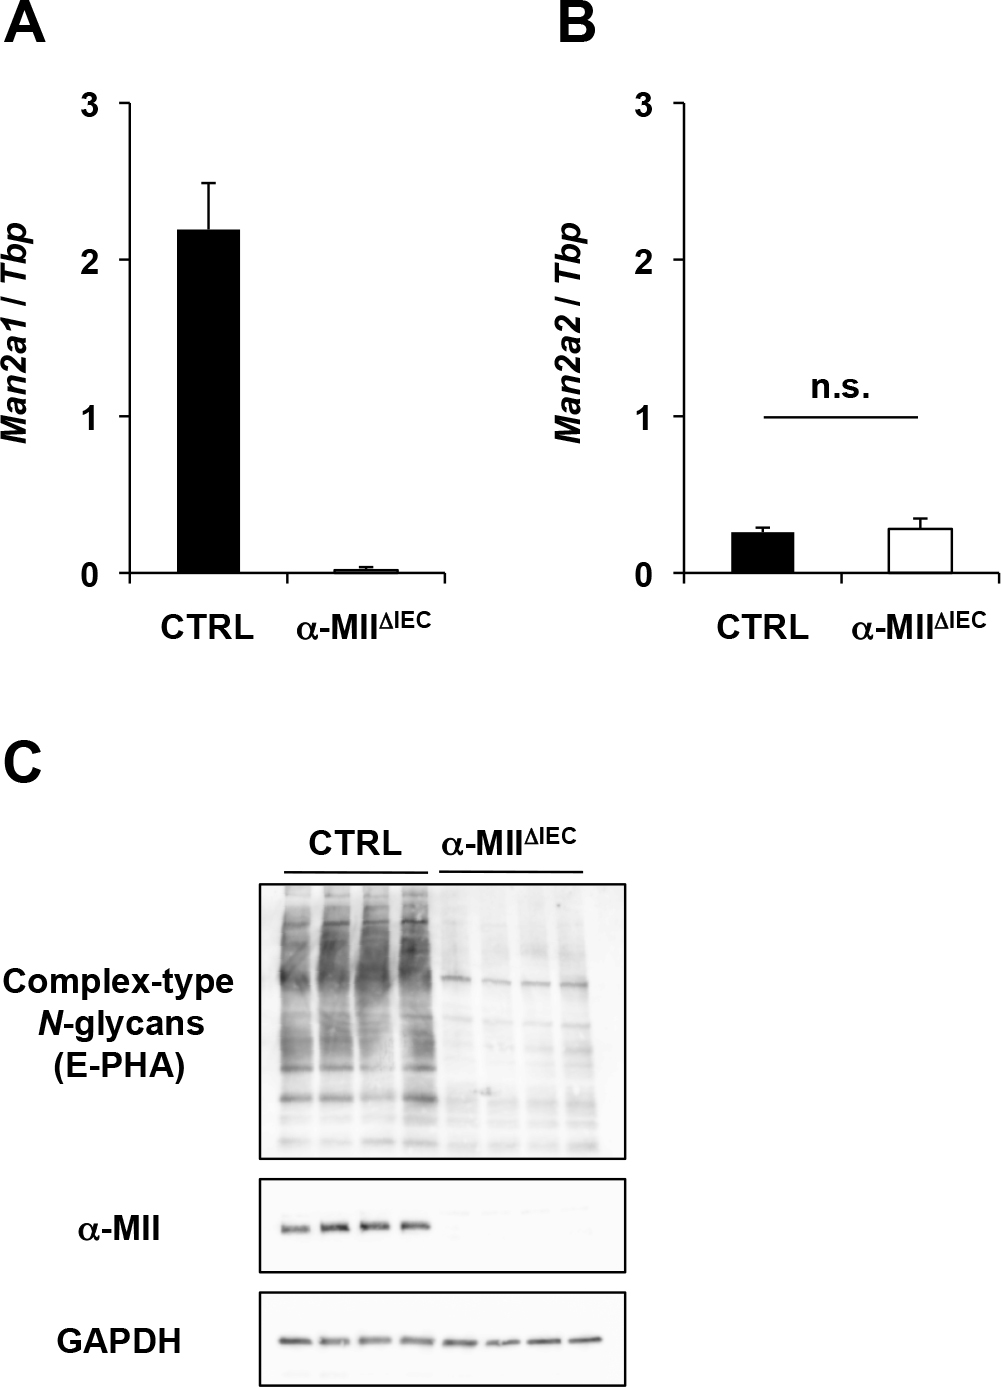
To investigate the role of α-MII in the development of UC, we initially analyzed the expression of Man2a1 in various cell types, namely, epithelial cells, stromal cells, T cells, B cells, and other leucocytes, from the colon of mice. We also analyzed Man2a2 expression because α-MIIx, a gene product of Man2a2, catalyzes the same reaction as α-MII and can compensate for the α-MII deficiency (Fig. 2A). Man2a1 was ubiquitously expressed in all the cell types tested, whereas Man2a2 was expressed variably with a marginal expression detected in epithelial cells (Fig. 2B). Thus, epithelial cells showed the highest ratio of Man2a1 to Man2a2 expression (Fig. 2C). These observations suggest that the SNPs in MAN2A1 have little effect on N-glycans in cell types other than epithelial cells. In fact, the deficiency of α-MII was reported to show little, if any, effect on N-glycan maturation in most cell types, including T cells and B cells (Chui et al., 1997, 2001), due to the functional compensation by α-MIIx (Akama et al., 2006). Given the selective expression of α-MII in epithelial cells, we hypothesized that epithelial α-MII controls the formation of complex-type N-glycans in a nonredundant manner and potentially contributes to the development of UC. To examine this possibility, we generated α-MIIΔIEC mice.

α-MIIΔIEC mice grew normally and were fertile. They showed no apparent disease symptoms at least up to the age of 8 months. Man2a1 expression levels were decreased to 0.008-fold in the IECs obtained from these mice compared to those of control (Villin-CreTg/Man2a1F/+) littermates (Fig. 3A), whereas Man2a2 expression levels remained constant (Fig. 3B), suggesting that genetic compensation does not occur in IECs in the absence of Man2a1. Immunoblotting further revealed a loss of α-MII protein in IECs of these mice (Fig. 3C, middle panel). Correspondingly, lectin blotting using the complex-type N-glycan-specific E-PHA demonstrated that α-MII-deficient colonic epithelial cells failed to form complex-type N-glycans in a vast majority of proteins (Fig. 3C, top panel).
IEC-specific deletion of α-MII ameliorates DSS-induced colitis
To investigate the role of IEC-intrinsic α-MII in intestinal inflammation, we examined the susceptibility of α-MIIΔIEC mice to DSS-induced colitis, an experimental animal model of UC. Administration of 2% DSS caused body weight loss, diarrhea, and bloody stool. However, the body weight loss was less severe in α-MIIΔIEC mice than in control littermates (Fig. 4A). The clinical score on the basis of diarrhea and bloody stool was also significantly lower in α-MIIΔIEC mice compared with control mice (Fig. 4B). Colon shortening is considered a marker for colonic inflammation in this disease model. In accordance with the clinical score, the colon length was significantly longer in α-MIIΔIEC mice compared with control mice (Fig. 4C and D). Furthermore, histological analysis demonstrated crypt loss, inflammatory cell infiltration, and goblet cell depletion in control mice; however, these pathological changes were less severe in α-MIIΔIEC mice (Fig. 4E and F).

Pro-inflammatory cytokines such as IL-1β, IL-6, and TNF-α mediate development of IBD (Neurath, 2014) as well as DSS-induced colitis (Perse and Cerar, 2012). Downregulation of Il1b and Il6 was evident in the colonic tissue of α-MIIΔIEC mice (Fig. 5). Expression of Tnf was also slightly suppressed in α-MIIΔIEC mice, although the difference was not statistically significant (Fig. 5). Collectively, these results indicate that protein N-glycosylation by α-MII in IECs contributes to development of DSS-induced colitis.
To examine whether inflammatory stimuli influence the expression of α-MII in IECs, we analyzed Man2a1 mRNA and α-MII protein in wild-type mice administered with DSS. DSS treatment slightly downregulated Man2a1 mRNA level (Supplementary Fig. 1A), whereas the amount of α-MII protein remained consistent (Supplementary Fig. 1B, C). Therefore, inflammatory stimuli are unlikely to affect expression of α-MII.
Epithelial α-MII has no impact on bacterial composition
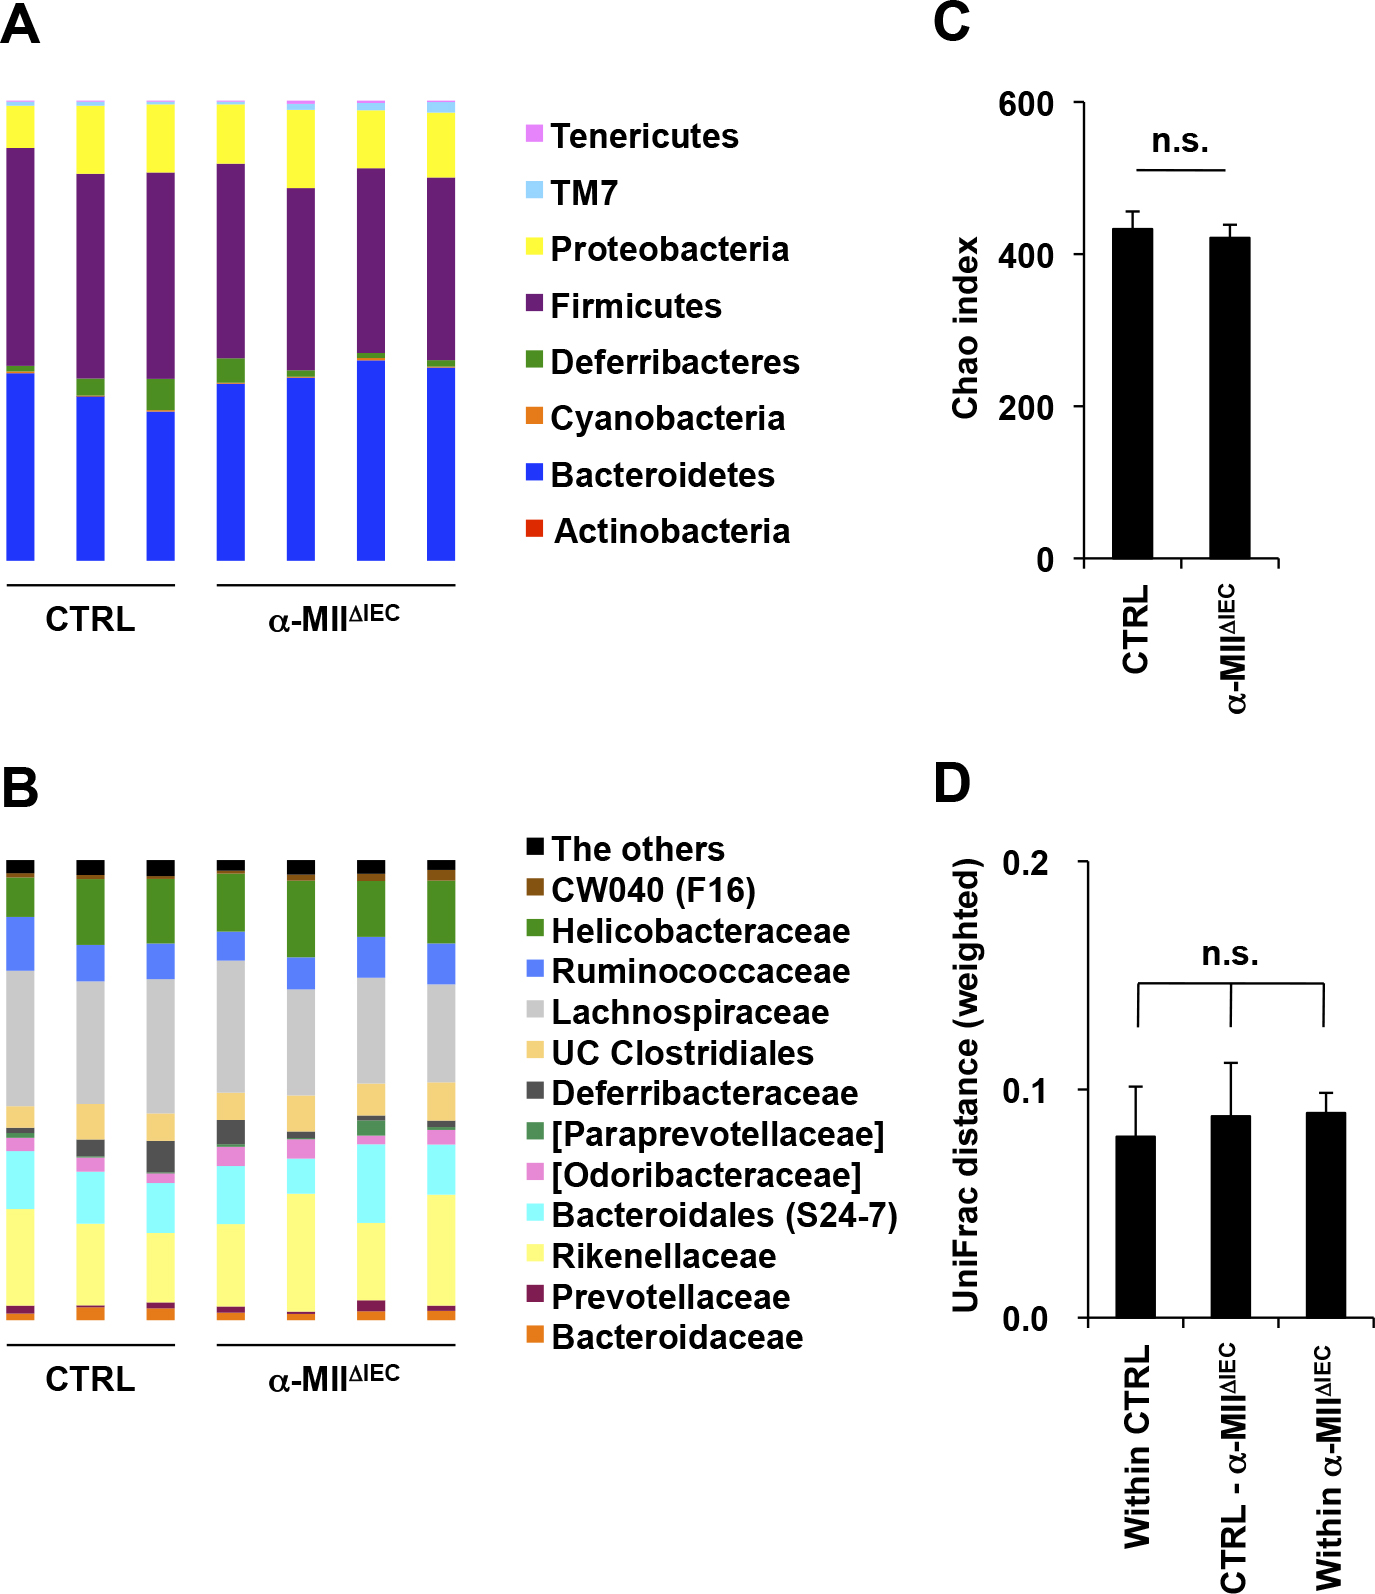
Bacterial composition of intestinal microbiota is one of the critical environmental factors that determines susceptibility to DSS-induced colitis (Moon et al., 2015). Previous studies have also suggested that the structure of glycans affects bacterial composition (Kashyap et al., 2013). We therefore investigated whether α-MII deficiency in IECs alters the bacterial composition. Metagenomic 16S rRNA sequencing demonstrated that there were very little, if any, differences in bacterial composition and α-diversity between α-MIIΔIEC and control mice (Fig. 6A–D). Thus, α-MII expression in IECs is not necessary for the establishment of a bacterial community in the intestine.
IEC-specific deletion of α-MII suppresses neutrophil infiltration into the colon
To explore resistance mechanism(s) of α-MIIΔIEC mice to DSS-induced colitis, we analyzed the composition of immune cells in colonic lamina propria by flow cytometry. Lamina propria-infiltrating immune cells were classified into various subsets according to the gating strategies shown in Fig. 7A. There was no significant difference in the number of total leukocytes, T cells, B cells, dendritic cells, macrophages, monocytes, and eosinophils between α-MIIΔIEC and control mice (Fig. 7B). CX3CR1hi macrophages, which possess anti-inflammatory property (Bain et al., 2013), was also comparable between the two groups (Supplementary Fig. 2A). In contrast, the number of neutrophils was significantly lower in α-MIIΔIEC mice (Fig. 7B). Although neutrophils are essential for the elimination of microbial pathogens, excessive recruitment of neutrophils causes tissue damage (Fournier and Parkos, 2012). In agreement with this, the colon length was inversely correlated with the number of infiltrating neutrophils in colitic mice (Fig. 8A), implying that neutrophil infiltration may induce colonic shortening. Collectively, these results suggest that epithelial α-MII plays a role in the recruitment of neutrophils to the colon over the course of the inflammatory process.
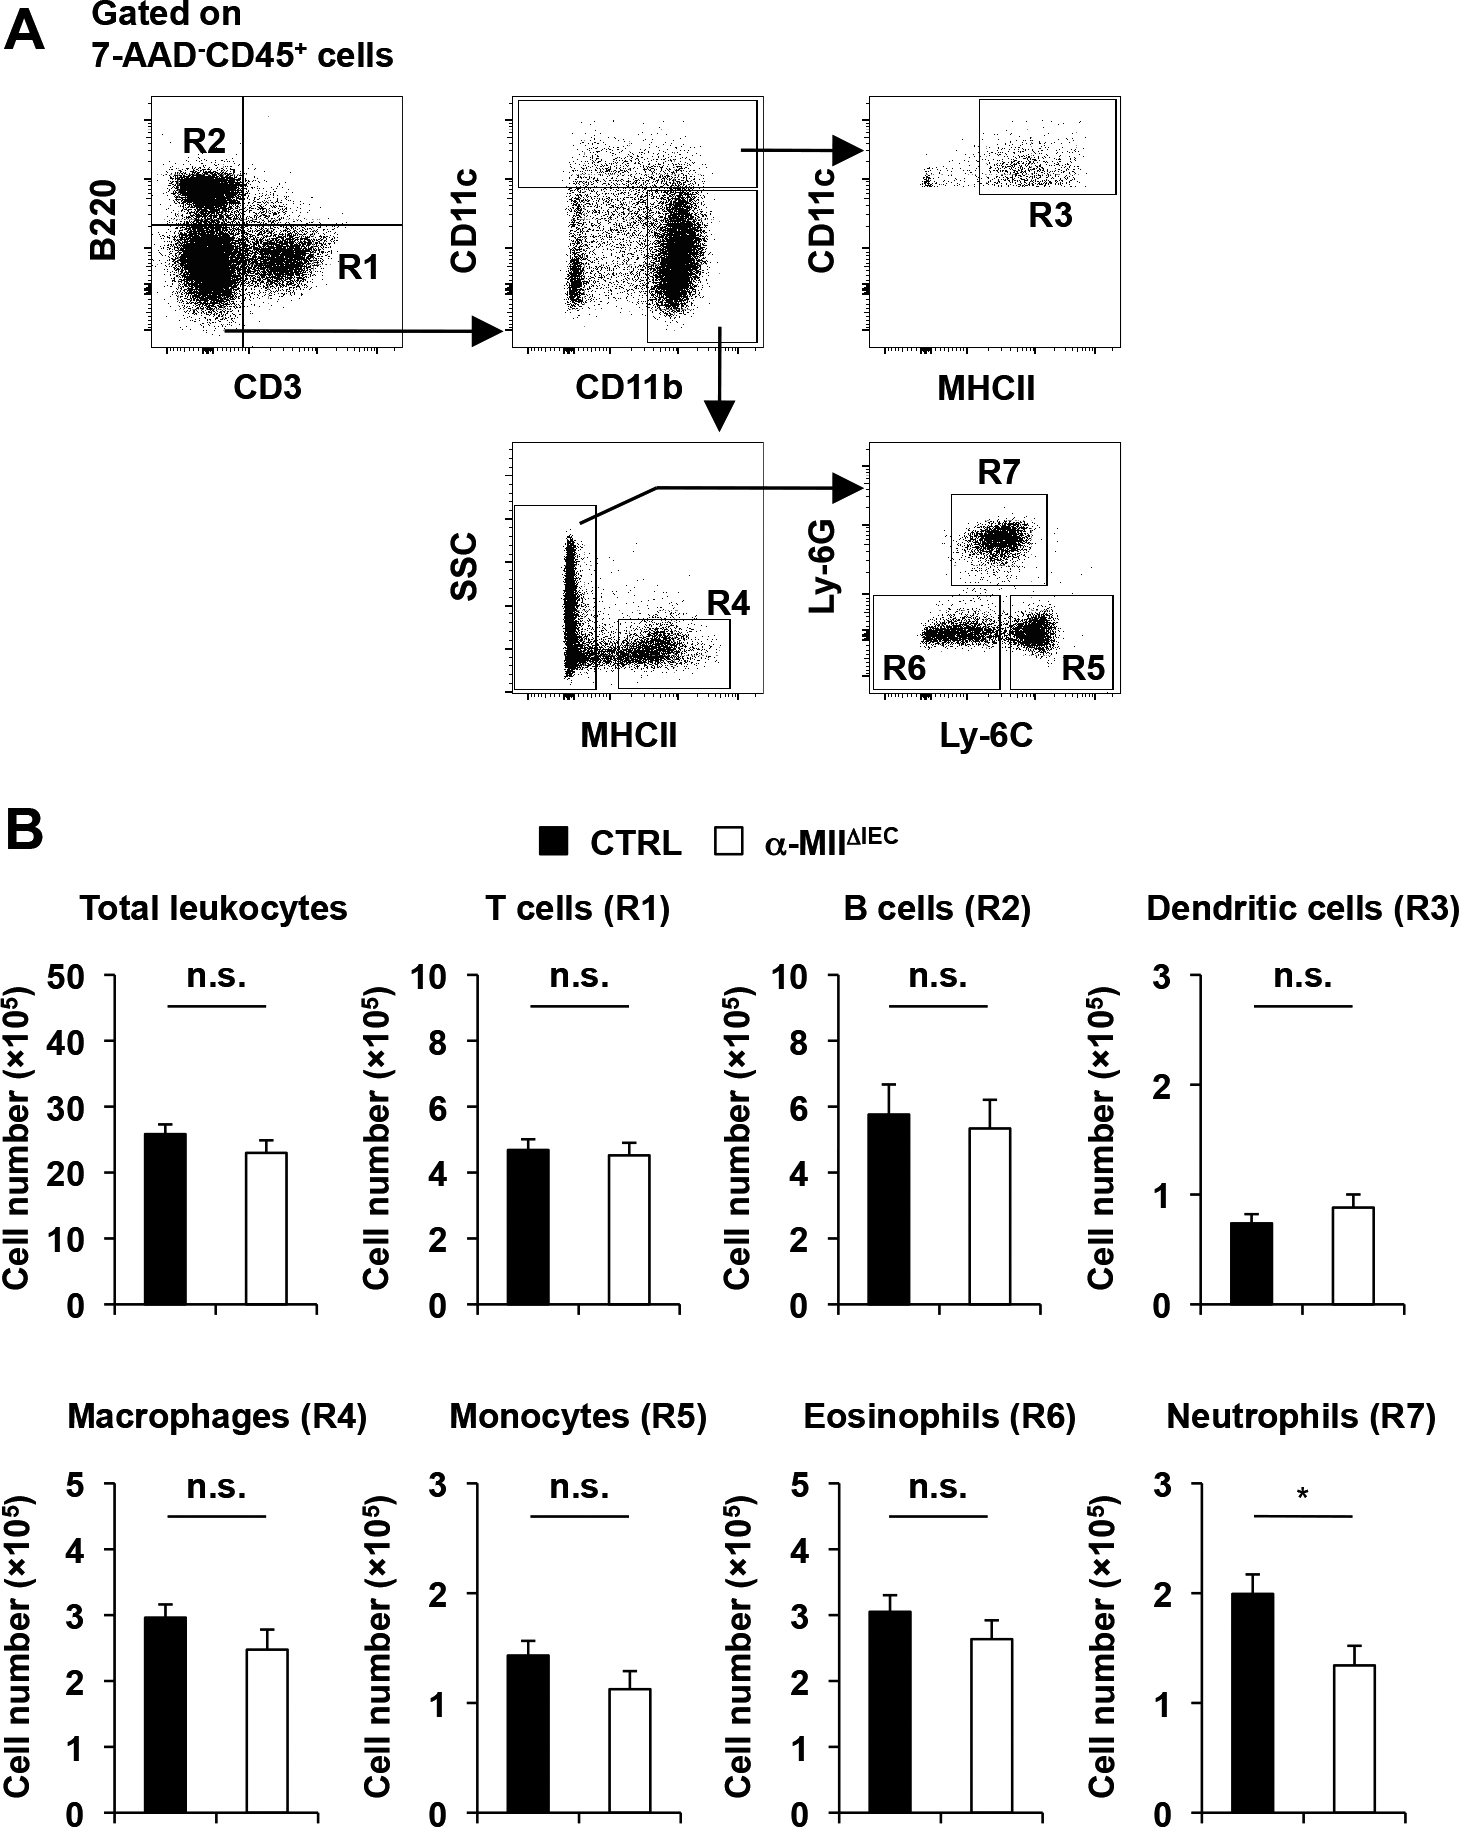
We further analyzed the subpopulations of T cells. Similar numbers of CD4+ T cells and Th17 cells were observed in the two groups (Supplementary Fig. 2B and C), whereas the number of regulatory T cells was significantly higher in control mice than in α-MIIΔIEC mice (Supplementary Fig. 2D). The expansion of regulatory T cells in control mice may reflect counter response to the development of severe inflammation.
IEC-specific deletion of α-MII downregulates production of neutrophil-attracting chemokines
The interaction between C-X-C chemokine receptor type 2 (CXCR2) and its ligands, ELR (Glu-Leu-Arg) motif-containing CXC chemokines (i.e., CXCL1, 2, 5), plays an essential role in neutrophil recruitment (Sadik et al., 2011). Based on the observation that neutrophil infiltration was suppressed in α-MIIΔIEC mice and the fact that both epithelial and non-epithelial cells such as macrophages produce the ELR motif-containing CXC chemokines, we analyzed the gene expression levels of these chemokines in colonic epithelial cells and whole tissue (containing both epithelial and non-epithelial cells) derived from control and α-MIIΔIEC mice. Although Cxcl1, Cxcl2, and Cxcl5 were only marginally expressed under physiological conditions (Fig. 8B), DSS treatment strongly upregulated expression of these neutrophil-attracting chemokines in the colonic tissue of control mice (Fig. 8C). Because the expression levels of these chemokines in epithelial cells were much lower compared to those of the colonic tissue (Fig. 8D), non-epithelial cell lineages are responsible for the production of neutrophil-attracting chemokines. Importantly, the chemokine expressions were markedly suppressed in the colonic tissue of α-MIIΔIEC mice (Fig. 8C). These observations indicate that IEC-derived N-glycosylated proteins are required for the induction of ELR motif-containing CXC chemokines in non-epithelial cell lineages under inflammatory conditions. N-glycans and chemotactic activity of neutrophils remained intact in α-MIIΔIEC mice (Supplementary Fig. 3A and B). It is therefore conceivable that the decrease in neutrophil recruitment to the colon in α-MIIΔIEC mice is attributed to the downregulation of chemokine production rather than the change of neutrophil phenotypes.
Discussion
In the present study, we identified the SNPs in MAN2A1 as potential genetic risk factors contributing to the onset of UC. Similar to erythroid and kidney cells (Chui et al., 1997, 2001), α-MII-deficient colonic epithelial cells failed to form complex-type N-glycans without functional compensation by α-MIIx. This result indicates that colonic epithelial cell is the third cell type in which the formation of complex-type N-glycans largely depends on α-MII.
We found that α-MIIΔIEC mice are resistant to DSS-induced colitis, as evidenced by amelioration of clinical symptoms, colon shortening, and histological changes in colonic tissue. The gene expression levels of inflammatory cytokines were also suppressed in α-MIIΔIEC mice. Thus, IEC-intrinsic α-MII is most likely to play a pathological role in the development of colonic inflammation. In UC patients, a massive infiltration of inflammatory cells into the intestinal mucosa and submucosa is commonly observed (Bouma and Strober, 2003; Fiocchi, 1998; Uguccioni et al., 1999), and these infiltrating leukocytes produce inflammatory cytokines (e.g., TNF-α, IL-1β, and IL-6) and reactive oxygen species (ROS) to promote tissue damage and epithelial barrier dysfunction (Naito et al., 2007; Xiao et al., 2016). The DSS-induced colitis model partially mimics the inflammatory process of UC wherein the infiltrating monocytes and neutrophils abundantly produce inflammatory cytokines and ROS, contributing to the development of colitis (Qualls et al., 2006; Zigmond et al., 2012). Monocyte and neutrophil recruitment to colonic tissue is regulated by distinct mechanisms; monocytes use the C-C chemokine receptor type 2 (CCR2) to sense ligand chemokines CCL2, 7, and 8 (Zigmond et al., 2012), whereas neutrophils express the CXCR2 receptor that recognizes the ELR-motif-containing CXC chemokines upregulated in the inflammatory colon. Genetic ablation and blockade of CXCR2 exerts a therapeutic effect on DSS-induced colitis (Farooq et al., 2009). Notably, the infiltration of neutrophils was selectively diminished in α-MIIΔIEC mice. We therefore suggest that diminished neutrophil recruitment plays a role in the development of resistance to DSS-induced colitis in α-MIIΔIEC mice. The inverse correlation between neutrophil number and colon length (an improvement marker of colitis) also supports this conclusion.
The chemokines CXCL1, 2, 3, 5, 6, 7, and 8 in humans and CXCL1, 2/3, 5, and 7 in mice, all of which contain an ELR motif, have been identified as ligands for CXCR2 to date. Among these ligands, CXCL1 (keratinocyte-derived chemokine, KC), CXCL2 (macrophage inflammatory protein-2, MIP-2), and CXCL5 (lipopolysaccharide-induced CXC chemokine, LIX) have been shown to be associated with the pathogenesis of DSS-induced colitis in mice (Kwon et al., 2005; Murphy et al., 2010; Ohtsuka and Sanderson, 2003; Yan et al., 2009). When we administered DSS to mice, Cxcl1, Cxcl2, and Cxcl5 were significantly upregulated both in colonic epithelial cells and tissue. However, these chemokines were expressed at much higher levels in colonic tissue than in colonic epithelial cells, suggesting that non-epithelial cells, such as, macrophages, monocytes, dendritic cells, and stromal cells (Berndt et al., 2007; MacDermott, 1999; Soehnlein and Lindbom, 2010; Yamamoto et al., 2008), could be the main chemokine producers. In sharp contrast, the expression levels of these chemokines were remarkably downregulated in colonic tissue of α-MIIΔIEC mice. The downregulation of Cxcl1, Cxcl2, and Cxcl5 leads to a decrease in neutrophil recruitment to the colon. However, the molecular mechanism(s) involved in the downregulation of these chemokines in the absence of epithelial α-MII remains unknown.
N-Glycosylation facilitates cell–cell communication in the immune system by modulating functionality of immune effector molecules. Otto et al. reported that N-glycan structures of soluble intercellular adhesion molecule-1 (sICAM-1) are critical for its ability to induce CXCL2/MIP-2 production from astrocytes (Otto et al., 2004). The activity of sICAM-1 with only high-mannose-type N-glycans declines by more than 12-fold compared with that of intact sICAM-1. Several lines of studies have demonstrated that expression of ICAM-1 and release of sICAM-1 are augmented in various epithelial cell types such as keratinocytes (Budnik et al., 1992) and retinal pigment epithelial cells (Nagineni et al., 1996) by inflammatory stimuli. Similarly, Dippold et al. showed that HT-29 and Caco-2 human colonic cell lines also upregulate ICAM-1 and release sICAM-1 upon stimulation with TNF-α, IFN-γ, and IL-1β (Dippold et al., 1993). Elevation of serum sICAM-1 was observed in patients with active IBD (Dippold et al., 1993). We also confirmed upregulation of Icam1 in colonic epithelial cells in DSS-treated mice (data not shown). Taking these observations and our results into account, we speculate that the deficiency of epithelial α-MII inhibits the formation of complex-type N-glycan structures of sICAM-1, thereby attenuating its ability to induce the production of the ELR motif-containing CXC chemokines from non-epithelial cells in the colon. Although further investigations are needed to prove this speculation, the link between complex-type N-glycans and the ELR motif-containing CXC chemokines sheds light on the pathogenesis of UC.
In conclusion, we have identified SNPs in MAN2A1 as a novel genetic factor associated with the pathogenesis of UC and demonstrated that epithelial α-MII plays a nonredundant role in the development of intestinal inflammation, at least in part, by regulating neutrophil recruitment. We propose α-MII as a potential therapeutic target for IBD.