Abstract
The discovery of fluorescent proteins (FPs) has revolutionized cell biology. The fusion of targeting sequences to FPs enables the investigation of cellular organelles and their dynamics; however, occasionally, such fluorescent fusion proteins (FFPs) exhibit behavior different from that of the native proteins. Here, we constructed a color pallet comprising different organelle markers and found that FFPs targeted to the mitochondria were mislocalized when fused to certain types of FPs. Such FPs included several variants of Aequorea victoria green FP (avGFP) and a monomeric variant of the red FP. Because the FFPs that are mislocalized include FPs with faster maturing or folding mutations, the increase in the maturation rate is likely to prevent their expected localization. Indeed, when we reintroduced amino acid substitutions so that the FP sequences were equivalent to that of wild-type avGFP, FFP localization to the mitochondria was significantly enhanced. Moreover, similar amino acid substitutions improved the localization of mitochondria-targeted pHluorin, which is a pH-sensitive variant of GFP, and its capability to monitor pH changes in the mitochondrial matrix. Our findings demonstrate the importance of selecting FPs that maximize FFP function.
Key words: fluorescent protein, organelle, fusion protein, mitochondria
Introduction
Eukaryotic cells contain highly developed membrane-bound organelles with unique morphologies and functions. Each organelle dynamically alters its size, abundance, and intracellular localization in response to a variety of extracellular and intracellular signals. Such organelle dynamics play an important role in cell physiology and pathophysiology. For example, mitochondria are highly mobile structures and continuously change their number, mass, and shape through fusion and fission to maintain functional mitochondria (Archer, 2013; Youle and van der Bliek, 2012). By using quantitative live-cell imaging, it was demonstrated that mitochondria transiently form an enormous, hyperfused network in G1-S phase to enhance their ATP production capacity, thereby playing a regulatory role in G1-S transition (Mitra et al., 2009). Thus, the observation of organelle dynamics is mandatory for a better understanding of biological phenomena at the cellular level.
Fluorescent proteins (FPs) are powerful tools for live-cell imaging and visualizing organelle dynamics. The introduction of a gene encoding a FP is a simple way to introduce an intrinsic fluorescent dye into living cells because it requires no additional enzymes or cofactors for fluorophore formation (Reid and Flynn, 1997). Because of this advantageous feature, FPs have shed light on molecular dynamics in living cells and even cellular dynamics in living organisms through the development of biosensors to monitor molecular or cellular behaviors (Day and Davidson, 2009; Timpson et al., 2011). Since the first discovery of green fluorescent protein (GFP) in the jellyfish Aequorea victoria (Shimomura et al., 1962), the properties of FPs themselves have also evolved through genetic engineering. Such improvements include an extended color pallet (Heim et al., 1994; Ormö et al., 1996), increased fluorescence quantum yield (Bajar et al., 2016; Heim et al., 1995), enhanced folding efficiency at 37°C (Nagai et al., 2002; Pédelacq et al., 2006), and improved photostability (Griesbeck et al., 2001; Lam et al., 2012; Mena et al., 2006). Despite this series of radical improvements, no versatile FPs have become available thus far. Thus, it is necessary to carefully consider the properties of each FP and the possible unfavorable effects of FP expression in cells.
A good example of this is FP-based organelle markers. Fluorescent fusion proteins (FFPs), which combine FPs and proteins (either full length or portions that include organelle-targeting sequences), are widely used as genetically encoded organelle markers. Such FFPs enable us to visualize time-dependent changes in morphology, subcellular localization, and function in organelles of interest (Chudakov et al., 2010; Rizzuto et al., 1995; Takeuchi and Ozawa, 2007). For instance, the real-time tracking of early, late, and recycling endosomes with FFPs revealed that early endosomes are comprised of two dynamically distinct populations, and such differences are crucial for determining the fate of endocytic cargos in terms of undergoing degradation or recycling (Lakadamyali et al., 2006). However, FFPs do not always exhibit the expected localization. Such mislocalization of FFPs, which might be accounted for by an attribute of either or both the organelle-targeting protein or the FP, is a possible cause of data misinterpretation. For example, the mislocalization in the cytosol of a mitochondria-targeted fluorescent cAMP sensor resulted in “false-positive” findings for changes in mitochondrial cAMP concentration, as it appeared that the cAMP concentration was affected by changes in the cytosol even though it was expected to be unchanged (DiPilato et al., 2004). In fact, an improvement in mitochondrial targeting by fusing repetitive mitochondrial-targeting sequences produced no significant change in the mitochondrial cAMP concentration under the same conditions (Di Benedetto et al., 2013). In addition, the expression of FFPs occasionally affects organelle morphology. In the case of endoplasmic reticulum (ER) markers, the oligomerization of FFPs with dimerizing or tetramerizing FPs resulted in the transformation of an organized smooth ER into a tightly stacked ER (Snapp et al., 2003). Therefore, it is critical to carefully examine whether the developed FFPs indeed localize to the intended organelle and whether they have any adverse effects on organelle morphology or function.
Here, we synthetically constructed a series of FFPs that consist of different organelle-targeting proteins/peptides and a variety of spectral variants of FPs. Among them, we found that mitochondrial matrix markers in combination with FPs with fast maturation rates were mislocalized, as a substantial fraction of such FFPs was observed not in the mitochondria but in the cytoplasm. The cytosolic fraction was significantly reduced by the reintroduction of a mutation that restored the maturation rate to normal. Given that the acceleration of the maturation process is generally thought to be conducive to the performance of FPs, our results suggest that the selection of FPs during the development of FFPs, particularly mitochondrial matrix markers, should be made more carefully.
Materials and Methods
Reagents and antibodies
MitoTrackerTM Red CMXRos, MitoTrackerTM Green FM, and Hoechst 33342 were obtained from Thermo Fisher Scientific (Carlsbad, CA, USA). FCCP and TMRM were purchased from Cayman Chemical (Ann Arbor, MI, USA) and Thermo Fisher Scientific, respectively. An anti-GFP polyclonal antibody (598) and horseradish peroxidase-conjugated anti-rabbit IgG were obtained from Medical and Biological Laboratories (MBL, Nagoya, Japan) and Jackson ImmunoResearch (West Grove, PA, USA), respectively.
Cell culture
HEK293T (CRL011268), HeLa (CCL-2), Cos-1 (CRL-1650), A431 (CRL-1555), A549 (CCL-185), and MDCK (CCL-34) cells were obtained from the American Type Culture Collection (Manassas, VA, USA). These cells were cultured under a 5% CO2 humidified atmosphere at 37°C in Dulbecco’s modified Eagle medium (DMEM, Sigma-Aldrich, St. Louis, MO, USA) supplemented with 10% fetal bovine serum (Thermo Fisher Scientific). The expression vectors were transfected into these cells with “Max” polyethylenimine (Polysciences, Warrington, PA, USA) according to the manufacturer’s recommendations.
Plasmids
mPlum-Lifeact-7 (Addgene plasmid # 54679) and mCherry-Sec61 β (Addgene plasmid # 49155) were obtained from Drs. Michael Davidson and Gia Voeltz, respectively, via Addgene (Watertown, MA, USA). The expression vectors for Rab5 and Rab7 were described previously (Fujioka et al., 2011). cDNA for each organelle localization sequence was generated by PCR with the following primers: mito_F and mito_R, Tom20_F and Tom 20_R, EEA1_F and EEA1_R, Rab5_F and Rab5_R, Rab7_F and Rab7_R, Rab11_F and Rab11_R, Sec61_F and Sec61_R, Lifeact_F and Lifeact_R, Golgi_F and Golgi_R, Tubulin_F and Tubulin_R, and H2B_F and H2B_R. These sequences were then subcloned into the XhoI/NotI sites of the pFX-SECFP vectors, which contains human cytomegalovirus (CMV) promoter (Fujioka et al., 2018). SECFP (cDNA was obtained from Dr. A. Miyawaki at RIKEN) is a derivative of ECFP and contains mutations: K26R, D129G, N164H, and S175G. As a mitochondrial marker, the mitochondria-targeting sequence of the cytochrome c oxidase subunit VIII (mito) was fused to the amino terminus of each fluorescent protein (De Michele et al., 2014). The linker sequences used for mitochondrial matrix markers are shown in Fig. S7.
The coding sequences of each fluorescent protein were amplified by PCR with the following primers: EGFP_F and CFP_R, mCherry_F and mCherry_R, iRFP_F and iRFP_R, MiCy_F and MiCy_R, mKate2_F and mKate2_R, TFP650_F and TFP650_R, pHluorin_F and pHluorin_R, and sfGFP_F and sfGFP_R. These sequences were then subcloned into the EcoRI/BglII, EcoRI/XhoI, or NotI/BglII sites of the pFX vectors.
The coding sequence of AcGFP1 was amplified by PCR with the AcGFP_F and AcGFP_R primers and subcloned into the AgeI/NotI sites of pDsRed2-Mito (Clontech). To generate the sequence encoding the A163V and/or G175S mutants of pHluorin, PCR-based mutagenesis with a QuickChange Site-Directed Mutagenesis Kit (Agilent Technologies, Santa Clara, CA, USA) was performed with the primers A163V_F and/or G175S_F. The primers used in this study are listed in Table S1.
The coding sequences of EGFP, pHluorin, and mutant forms of pHluorin in pFX-derived vectors were cleaved by XhoI/BglII and blunted with the use of DNA Polymerase I, Large (Klenow) fragment (New England Biolabs, Ipswich, MA, USA). The resulting DNA fragments were then subcloned into the Klenow-blunted SalI/NotI sites of the prokaryotic expression vector pGEX-4T3 (GE Healthcare UK Ltd., Little Chalfont, UK).
Fluorescence Microscopy
Cells were imaged on either an IX-83 or IX-81 inverted microscope (Olympus, Tokyo, Japan), both of which were equipped with a BioPoint MAC 6000 filter and shutter control unit (Ludl Electronic Products, Hawthorne, NY, USA), an automated XY-stage (Chuo Precision Industrial, Tokyo, Japan), and a SOLA Light Engine (Lumencor, Beaventon, OR, USA) as an illumination source. UPlanSApo 60×/1.35 oil objective lenses and UPlanSApo 10×/0.40 objective lenses were used. The following excitation and emission filters were used in this study: FF01-387/11-25 and FF02-447/60-25 (Semrock, Rochester, NY, USA) for Sirius and Hoechst 33342; FF02-438/24 and FF01-483/32 (Semrock) for CFP and its derivatives; BP470-490 and BP510-550 (Olympus) for the MiCy, GFP, and GFP derivatives as well as MitoTrackerTM Green FM; FF01-500/24-25 and FF01-542/27 (Semrock) for YFP and its derivatives; BP520-550 and BA580IF (Olympus) for DsRed, mCherry, mKate2, eqFP650, MitoTrackerTM Red CMXRos, and TMRM; and FF02-628/40 and FF01-692/40 (Semrock) for iRFP. Confocal images were acquired with an sDISK spinning disk unit (Andor Technology, Belfast, UK) and a Rolera EM-C2 electron multiplying cooled charge-coupled device camera (QImaging, Surrey, BC, Canada), whereas the epifluorescence images were acquired with a Cool SNAP MYO cooled charge-coupled device camera (Photometrics, Tucson, AZ, USA). MetaMorph software (Molecular Devices, CA, USA) was used for the control of the microscope and the peripheral equipment. For live-cell imaging, the atmosphere was maintained at 37°C with a Chamlide incubator system (Live cells instrument, Seoul, Korea) for both microscopes.
For live cell imaging, cells plated on collagen-coated 35-mm-diameter glass-bottom dishes (AGC techno glass, Shizuoka, Japan) were transfected with expression vectors for FFPs as indicated in the figure legends. Unless otherwise noted, the cells were transferred into phenol red-free DMEM/F12 (Thermo Fisher Scientific) 24 h after transfection and were imaged with the microscopes. For some experiments, the cells were labeled with MitoTrackerTM Red CMXRos (12.5 nM) or MitoTrackerTM Green FM (12.5 nM) for 10 min at 37°C (for the determination of mitochondrial morphology and fluorescent intensity) or TMRM (50 nM) and Hoechst 33342 (1 μg/ml) for 30 min at 37°C (for the measurement of mitochondrial pH) before imaging.
Alternatively, cells plated on collagen-coated 96-well glass-bottom plates (AGC techno glass) were transfected with expression vectors. After 24 h, the cells were fixed in 3% paraformaldehyde for 15 min at room temperature, transferred into phosphate-buffered saline (PBS), and then imaged.
Quantification of FFP Localization
Mitochondrial masked images were generated based on images obtained through the MitoTracker channel as described previously with slight modifications (Iannetti et al., 2016). In brief, the background-corrected MitoTracker image was subjected to the ‘rolling ball’ collection algorithm. The resulting image was processed with a Mexican Hat filter to extract the particle objects, followed by noise reduction with a Median filter. A mitochondrial binary image was obtained by the ImageJ plugins “Auto Threshold” and ‘Remove Outliers.’ Fluorescence intensity in the mitochondrial area in the masked image was recorded for the determination of the mitochondrial intensity. The fluorescence intensity of the whole cell was measured within the area that used for the determination according to the DIC images. The ratio of the mitochondrial intensity to the whole cell intensity was calculated to evaluate the extent of the mitochondrial localization of the FFPs.
Expression and purification of mito-tagged FPs
Recombinant fluorescent proteins fused to glutathione S-transferase (GST) were expressed in the Escherichia coli strain JM109 from pGEX-derived vectors and purified as described previously (Smith and Johnson, 1988). Briefly, cells expressing fluorescent proteins were harvested by centrifugation at 2,500×g for 20 min at 4°C, re-suspended in PBS with 2 mM ethylenediaminetetraacetic acid (EDTA) and 1 mM dithiothreitol (DTT). The cells were disrupted by sonication and solubilized in 2% Triton X-100 for 10 min at room temperature. The cell extract was clarified by centrifugation (22,540×g for 20 min at 4°C) and the resulting supernatant was incubated with glutathione Sepharose 4B (GE Healthcare UK Ltd.) at 4°C for 1 h. The protein bound to the beads were washed twice with PBS, packed in the Poly-Prep® Chromatography Columns (Bio-Rad Laboratories, Inc., Hercules, CA, USA), and, after washing twice with 50 mM Tris-HCl (pH 8.8), eluted with 50 mM Tris-HCl (pH 8.8) containing 20 mM reduced glutathione.
Refolding kinetics of FPs
The protein solutions obtained were mixed with an equal amount of a denaturation buffer [100 mM Tris-HCl (pH 8.0), 150 mM NaCl, 10% glycerol, 16 M urea, 2 mM DTT] and incubated at 95°C for 5 min to induce protein unfolding. The denatured samples prepared in triplicate were then diluted by 100-fold in a Tris-NaCl-glycerol (TNG) buffer [100 mM Tris-HCl, 150 mM NaCl, 10% glycerol, 1 mM DTT, pH 8.0] on a Nunc black polystyrene 96-well MicrowellTM plate (Thermo Fisher Scientific) to induce refolding. The fluorescence emission at 510 nm±15 nm was measured using a SpectraMax i3x multimode microplate reader (Molecular Devices) at an excitation wavelength of 480 nm±9 nm. After background subtraction, the fluorescence intensities were normalized to those of non-denatured samples measured in parallel. The rate constant of folding rate (kfold) was calculated by fitting the normalized data to a single-exponential equation (Reid and Flynn, 1997):
|
F=
F
∞
(1−
e
−
k
fold
·t
),
|
where t, time (sec); F, fluorescence intensity; F∞, the fluorescence intensity when t=∞.
In Vitro pH Titration
Cells were lysed in a lysis buffer [10 mM Tris-HCl (pH 7.4), 150 mM NaCl, 5 mM EDTA, 0.5% Nonidet P-40, 10% glycerol, 1 mM NaF, 1 mM Na3VO4, 1 mM phenylmethylsulphonyl fluoride], chilled for 30 min on ice, and clarified by centrifugation at 20,000×g for 10 min at 4°C. The resulting supernatants were mixed with 20 mM citrate phosphate buffer (containing 150 mM NaCl) to obtain a pH value ranging from 4.5 to 8.5. The mixtures (100 μL each) were transferred into a well of a Nunc black polystyrene 96-well MicrowellTM plate (Thermo Fisher Scientific). The fluorescence emission at 530 nm±15 nm was measured using a SpectraMax i3x multimode microplate reader (Molecular Devices) at an excitation wavelength of 470 nm±9 nm. After the subtraction of background fluorescence (from the lysis buffer), the fluorescence intensities were plotted against the pH and fitted to the four-parameter logistic curve (which is mathematically analogous to the Hill equation; DeLean et al., 1978):
by using the least-squares method. In this equation: y, fluorescence intensity; x, proton concentration; a, the fluorescence intensity when x=0; d, the fluorescence intensity when x=∞; c, the proton concentration when y=(a+d)/2; b, the steepness of the curve. pKa was calculated with the equation pKa=–log c. The data shown in Fig. 5A are the mean±standard error of the mean (s.e.m.) for the values obtained when the maximum (d) and minimum values (a) were normalized to 1 and 0, respectively.
Measurement of Mitochondrial pH
Cos-1 cells expressing mito-pHluorin or mito-at pHluorin were pretreated with TMRM and Hoechst 33342 and subjected to time-lapse fluorescence microscopy. At time 0, the cells were exposed to 10 μM FCCP, which is an uncoupler that lowers both the cytosolic and mitochondrial pH (Berezhnov et al., 2016). After background subtraction, the fluorescence intensity within the cells was quantified by using the Multi Wavelength Cell Scoring module in MetaMorph. The weighted average of the fluorescence intensity at each time point normalized to that at time 0 was calculated and plotted.
Statistical Analyses
The quantitative data are presented as the mean±s.e.m. of at least three independent experiments (unless indicated otherwise) and were compared by one-way analysis of variance (ANOVA) followed by Dunnett’s post hoc analysis (multiple conditions against a control condition) or one-way analysis of variance (ANOVA) followed by a post hoc Tukey honestly significant difference (HSD) test (among multiple conditions). The time series data sets were compared by multivariate analysis of variance (MANOVA) with Bonferroni correction. No statistical methods were used to predetermine the sample size. The studies were performed unblinded.
Results
Development of a Color Pallet of Organelle-targeted FFPs
To perform the simultaneous observation of dynamics in multiple organelles in single living cells, we constructed a set of FFPs that were targeted to organelles and fused with a variety of FPs. The organelles and cell architectural features tested include the mitochondria (matrix and outer membrane), endosomes (early, late, and recycling), ER, Golgi apparatus, actin, microtubules, plasma membrane, and nucleus, which were targeted by the mitochondria-targeting sequence of the cytochrome c oxidase subunit VIII (simply called mito hereafter), translocase of outer membrane 20 (TOM20), early endosomal antigen 1 (EEA1), several small GTPases (Rab5, Rab7, and Rab11), Sec61 β, β1,4-galactose transferase (GalT), Lifeact (a Saccharomyces cerevisiae-derived peptide), tubulin β-4B chain, the C-terminal hypervariable region of K-Ras 4B (KRasCT), and histone 2B (H2B), respectively (Fujioka et al., 2018; Lakadamyali et al., 2006; Riedl et al., 2008; Shaner et al., 2008; Wu et al., 2016; Zurek et al., 2011). The FPs utilized included Sirius, SECFP, EGFP, Venus, mCherry, and iRFP713 (hereafter iRFP) (Filonov et al., 2011; Nagai et al., 2002; Shaner et al., 2008; Tomosugi et al., 2009). Cos-1 cells (Fig. 1 and Fig. S1) and HeLa cells (Fig. S2) were transfected with expression vectors for these FFPs and observed with confocal microscopy. Most of the FFPs displayed the expected localization in the targeted organelles or structures without any visible abnormality in terms of cell morphology. For example, FP-tagged Lifeact, an F-actin marker, clearly depicted a fibrous structure, while the Golgi apparatus-localizing enzyme GalT was localized only to the perinuclear region (Fig. 1, Fig. S1 and Fig. S2). However, some FFPs were found to be distributed to a compartment different from that of the expected organelle: TOM20-iRFP occasionally induced mitochondrial aggregation (Fig. S3A) while iRFP-Sec61 β led to the formation of stacked ER which resembled to the structure caused by weak protein-protein interaction (Snapp et al., 2003) (Fig. 1, Fig. S1 and Fig. S2). Some other FFPs were found to be mislocalized in a manner that was dependent on the utilized FP. For example, whereas mito-EGFP, a common mitochondria marker (De Michele et al., 2014), clearly localized only to the mitochondria, other FFPs exhibited “cytosolic and nuclear leaks” in addition to their expected localization (mitochondria) (Fig. 1, left column). Besides the mitochondrial matrix markers, endosome-targeted FFPs showed a similar tendency (Fig. S3B).

We therefore prepared mitochondria matrix markers that consisted of mito and other color variants of FPs to evaluate the effects of different types of FPs on FFP localization. The transfection of pDsRed2-mito (hereafter mito-DsRed), a commercially available expression vector for mito fused to the amino terminus of RFP from Discosoma sp., into Cos-1 cells resulted in distribution exclusively in the mitochondria (Fig. 2). We also prepared expression vectors for mito-MiCy, -mKate2, and -eqFP650 (Karasawa et al., 2004; Shcherbo et al., 2009, 2010), none of which originate from Aequorea victoria, and found that these FFPs also localized preferentially to mitochondria (Fig. 2). In contrast, mito-Sirius, -SECFP, -Venus, and -mCherry failed to do so (Fig. 2). Such mislocalization of mitochondria-targeted FFPs was also observed in other cell lines besides Cos-1 cells (Fig. S4A, B), indicating that this was caused by the properties of the FFPs but not by the cell context. It was previously reported that similar mislocalization of a mito-tagged biosensor based on the principle of Förster resonance energy transfer (FRET) was observed 24 h after transfection, whereas it was no longer present at 48 h after transfection (Di Benedetto et al., 2013). Therefore, we obtained a series of cell images at 24, 48, and 72 h after transfection, which did not show any significant differences in localization (Fig. S4C, D).

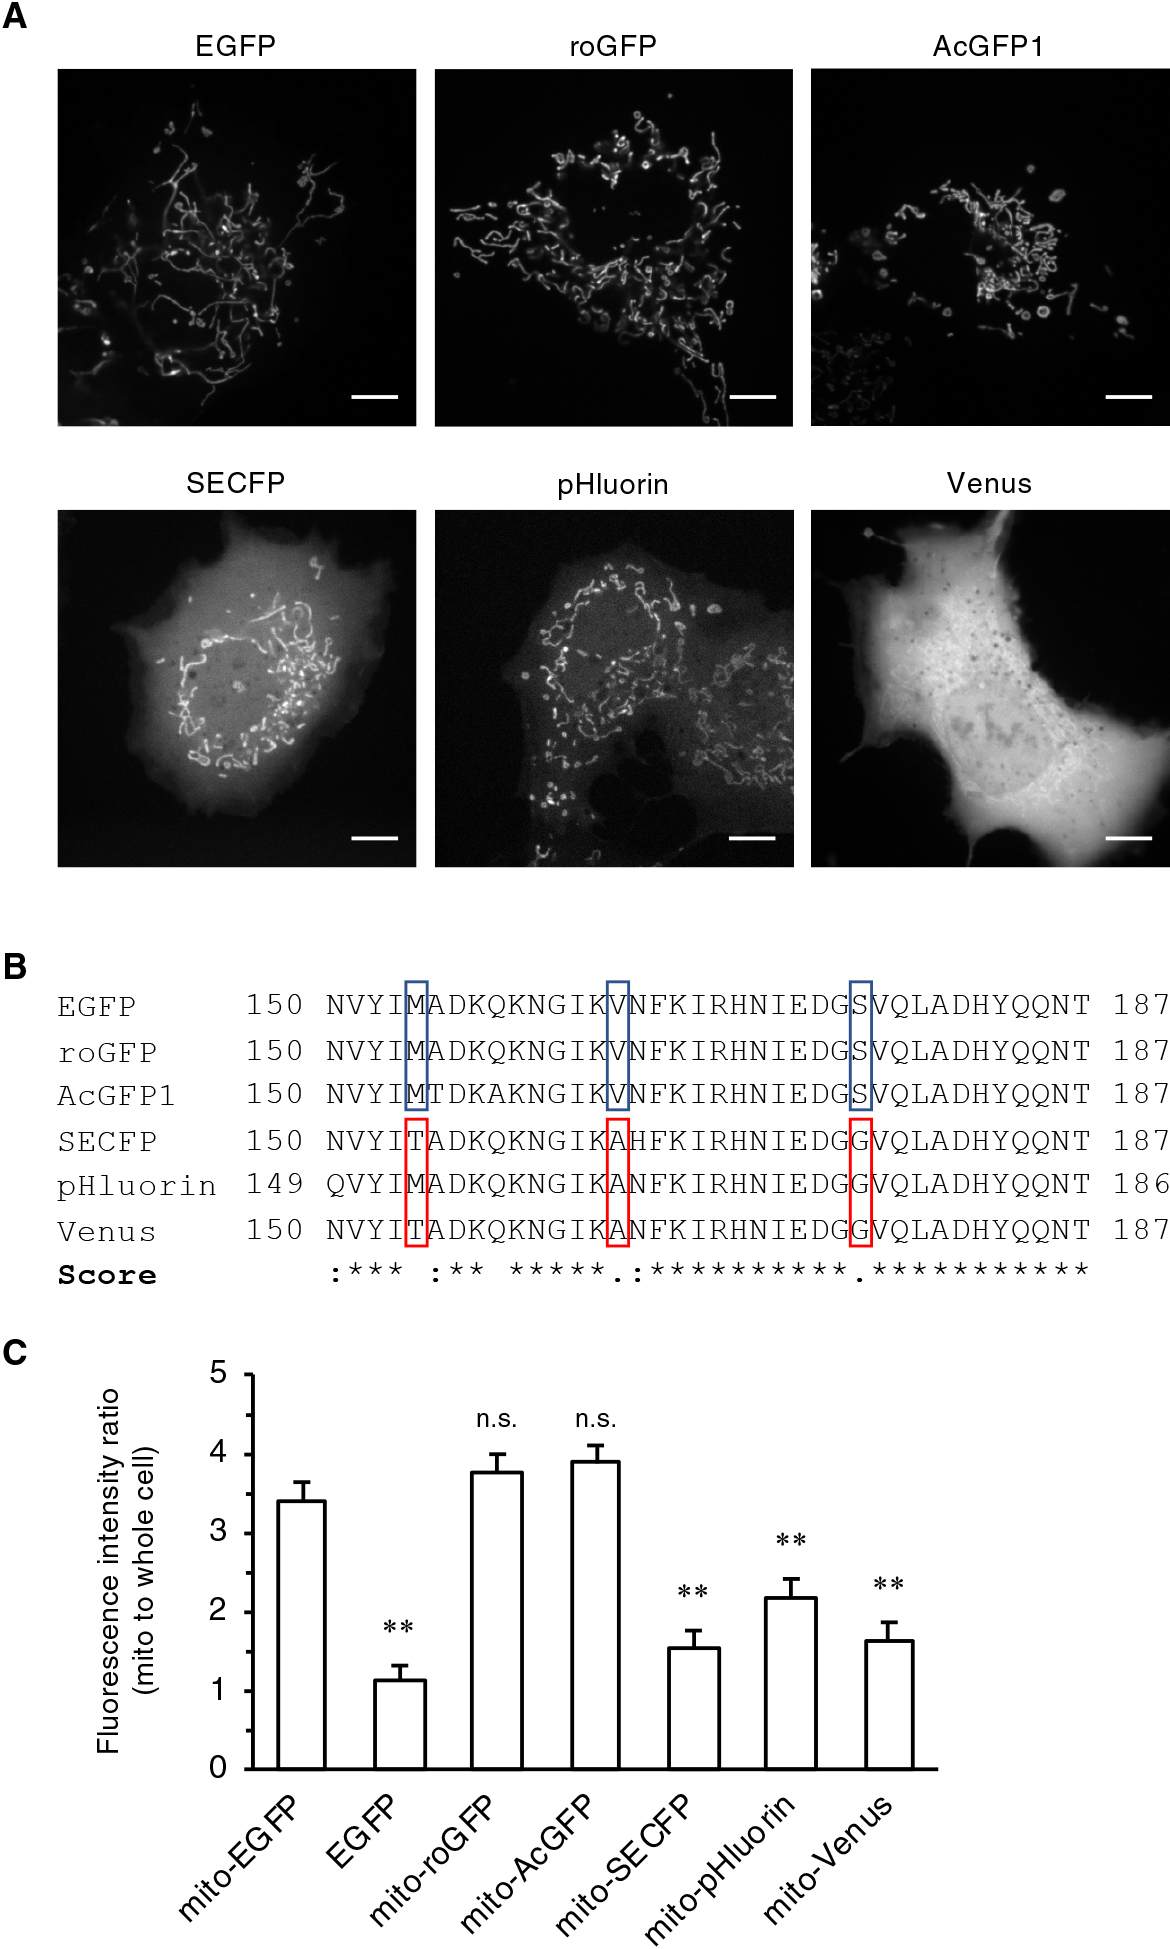
We next generated mitochondria-targeted FFPs with two Aequorea victoria-derived FPs, roGFP2 (Hanson et al., 2004; hereafter roGFP) and superecliptic pHluorin (Sankaranarayanan et al., 2000; hereafter pHluorin), as well as Aequorea coerulescens-derived GFP, AcGFP1 (Gurskaya et al., 2003; hereafter AcGFP). roGFP and pHluorin are widely used as subcellular redox and pH sensors, respectively. It is worth noting that commercially available mito-AcGFP is shown to be localized only to the mitochondria. It was revealed that mito-roGFP and -AcGFP were exclusively localized to the mitochondria (Fig. 3A), whereas mito-pHluorin exhibited cytosolic and nuclear leakage, as did mito-SECFP or mito-Venus. We collectively compared the amino acid sequences of the utilized FPs and found that amino acid substitutions (M153T/V163A/S175G) that promote their protein folding (so-called “folding mutations”; Nagai et al., 2002) had been introduced into the FPs of the mislocalized FFPs (Fig. 3B and Fig. 4C).
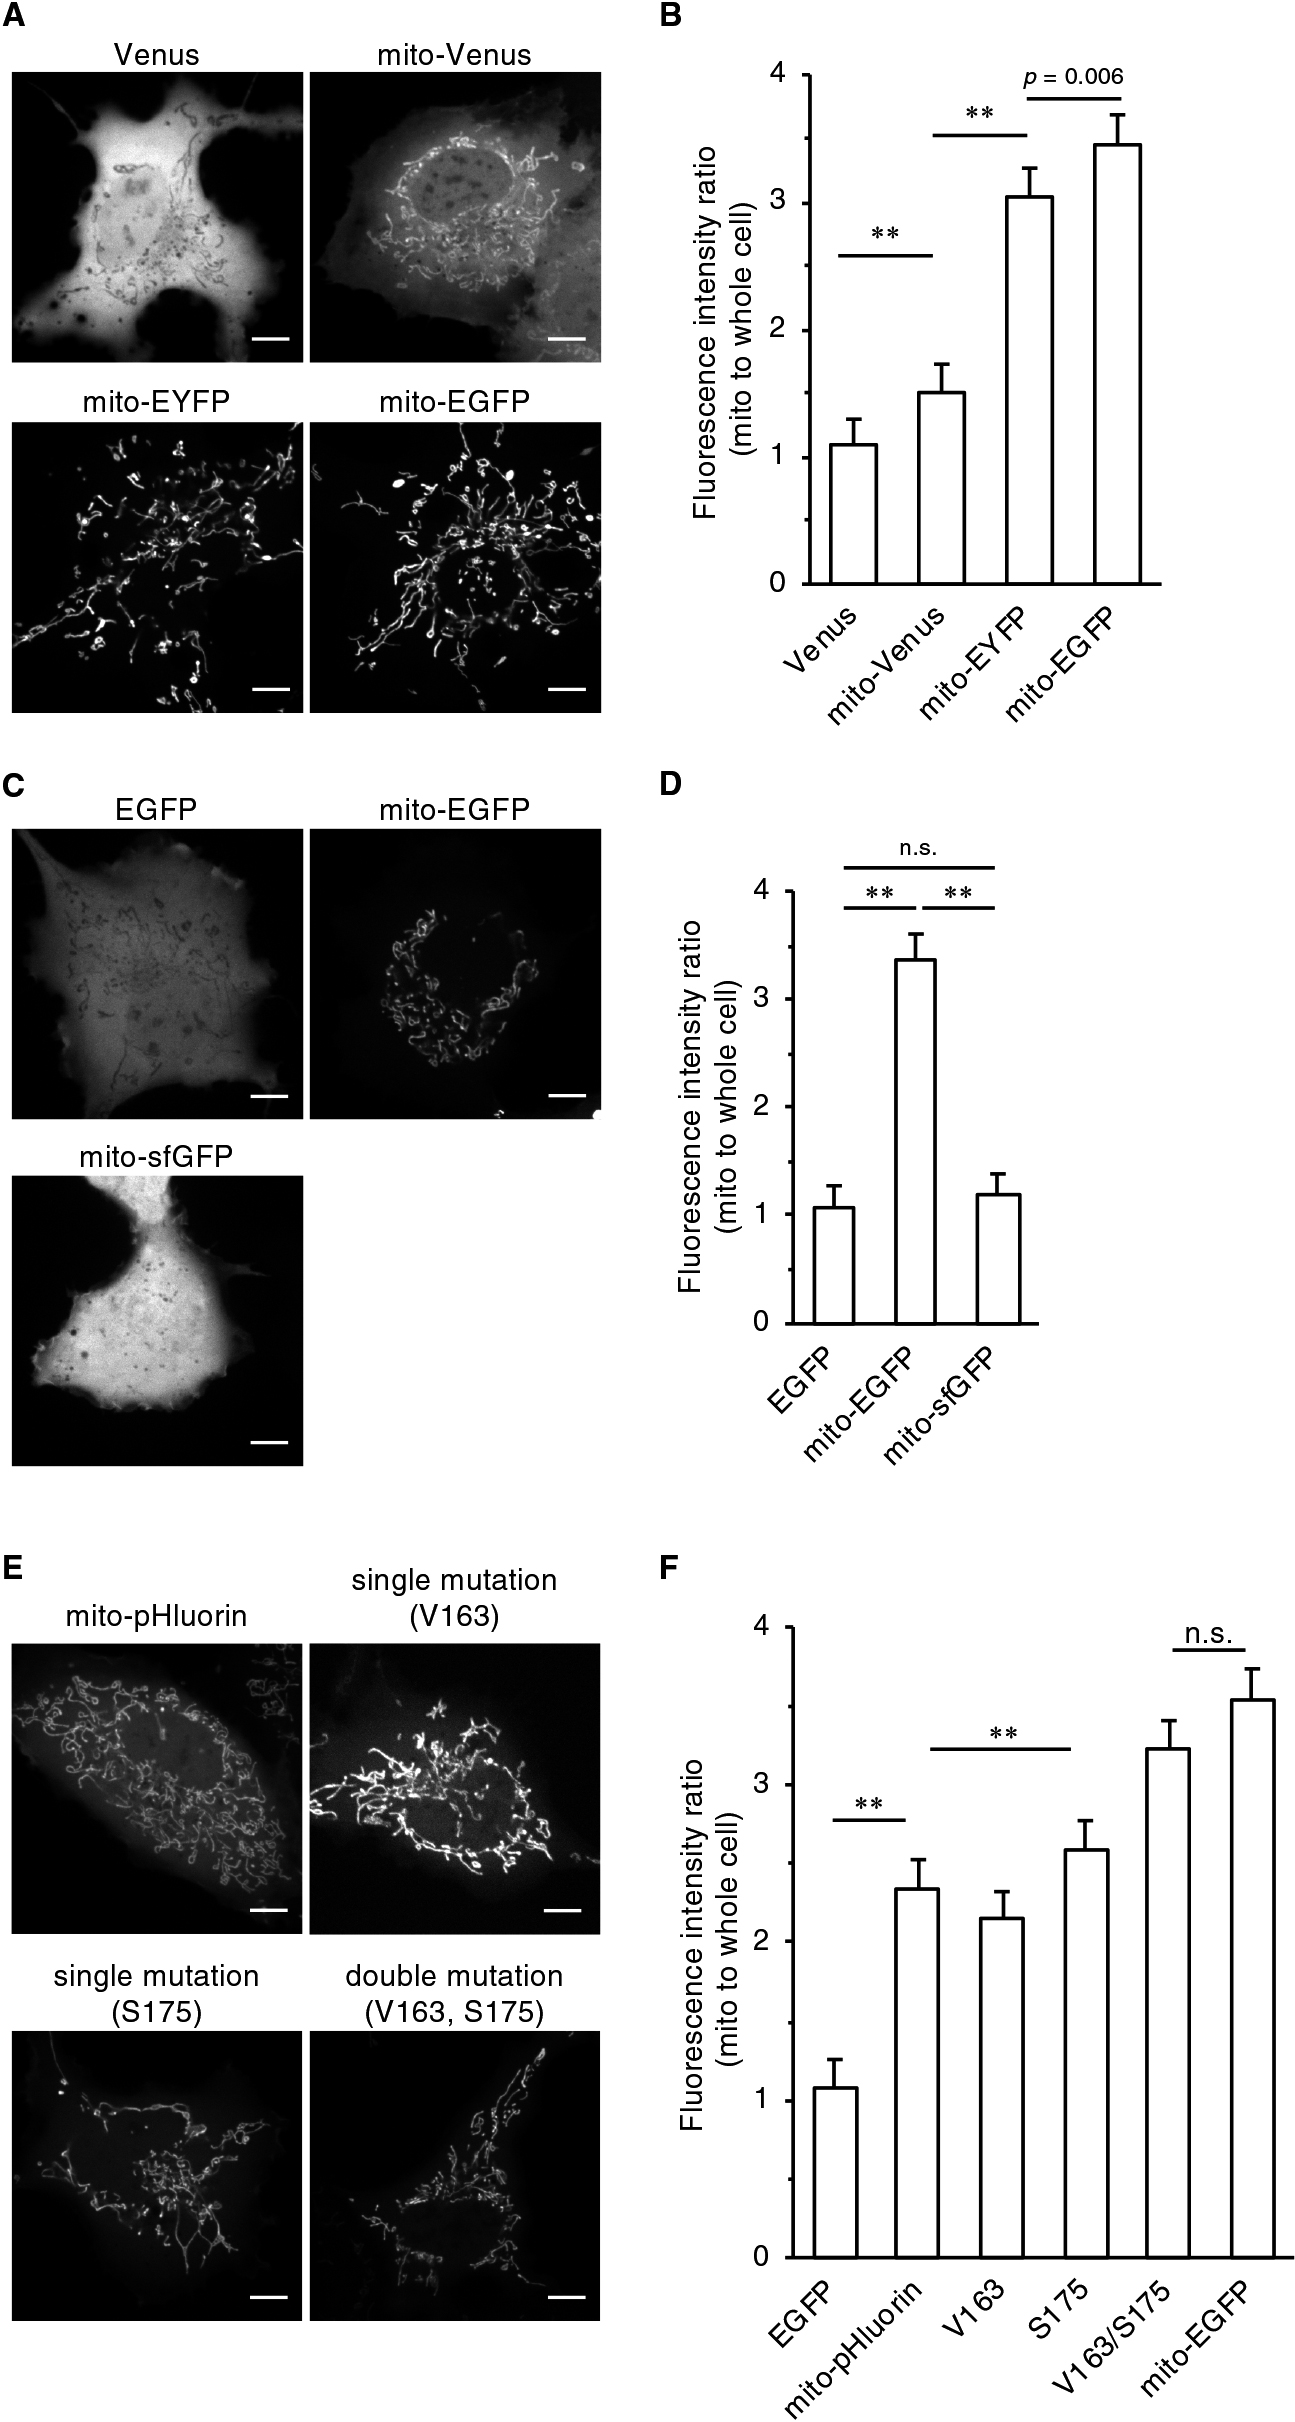
The above results raised the possibility that folding mutations in FPs inhibited the accurate mitochondrial localization of FFPs. To test this hypothesis, we prepared mito-EYFP and mito-Venus and compared their localization. These two FPs have essentially same excitation/emission spectra, but only the latter has folding mutations. As expected, whereas the fluorescence signal of mito-Venus was mainly observed in the cytosol and nucleus, mito-EYFP was preferentially localized to the mitochondria (Fig. 4A, B). We further evaluated the localization of mito tagged with superfolder GFP (sfGFP corresponds to avGFP M153T/V163A), which is a fast-folding EGFP variant generated by DNA shuffling (Pédelacq et al., 2006). In contrast to mito-EGFP, mito-sfGFP showed mislocalization in the cytosol and nucleus (Fig. 4C, D). To provide more evidence for this notion, we constructed a pHluorin revertant in which the folding mutations of pHluorin (V163A/S175G) were restored to those of the original avGFP (V163/S175). The revertant mito-pHluorin was indeed clearly localized to the mitochondria, and the degree of this localization compared to that of the original mito-pHluorin was dependent on the number of restored amino acids (Fig. 4E, F, and Fig. S5). More importantly, the extent of mitochondrial localization clearly correlated with the folding rate of purified FPs (Fig. 4E, F, and Fig. S5). The double mutant was therefore named at pHluorin after the musical term “a tempo,” which means “at original speed” or “cancelation of the last speed change.”
Precise Measurement of Mitochondrial pH by at pHluorin
We finally compared the properties of mitochondria-targeted FFPs with pHluorin and at pHluorin in terms of specific measurement of the mitochondrial pH. An in vitro titration assay revealed that the amino acid substitution resulted in no difference in pH sensitivity (Fig. 5A). Under these conditions, changes in pH in the mitochondrial matrix induced by carbonyl cyanide p-trifluoromethoxyphenylhydrazone (FCCP) were evaluated. FCCP is a chemical uncoupler that promotes mitochondrial membrane permeability to proton ions and acidifies the mitochondrial matrix (Aw and Jones, 1989). Intriguingly, while the fluorescence intensities of both mito-pHluorin and mito-at pHluorin were decreased by FCCP treatment, the extent of the decrease in the intensity of mito-at pHluorin was smaller than that of mito-pHluorin (Fig. 5B). However, when the changes in mitochondrial pH were separately quantified via mitochondrial masked images, which were generated based on the images of the chemical mitochondrial marker MitoTrackerTM Red CMXRos as a guide, it was revealed that mito-at pHluorin indeed reported essentially the same dynamics in terms of pH change in mitochondria as those reported by mito-pHluorin (Fig. S6A). FCCP is known to reduce the mitochondrial pH from 8 to 7.5–7.4 through mitochondrial depolarization (Cano Abad et al., 2004). At the same concentration, FCCP decreases the cytosolic pH from 7.2 to 6.5 (Berezhnov et al., 2016). Although the precise molecular mechanism remains unknown (Berezhnov et al., 2016), cytosolic pH becomes lower than the extracellular or mitochondrial pH even in the presence of this reagent. Hence, the presence of cytoplasmic mito-pHluorin might result in the overestimation of the mitochondrial pH. Indeed, the fluorescence intensity of cytosolic pHluorin was decreased by FCCP treatment (Fig. S6B). Overall, the preferential localization of mito-at pHluorin enables the specific measurement of pH changes in the mitochondrial matrix without the use of other complementary fluorescent dyes. This would be advantageous for multidimensional imaging with multiple FFPs and for flow cytometry analyses.

Discussion
In this study, we constructed more than 80 organelle-targeted FFPs and found that several sets of FFPs localized to organelles other than those expected. In the case of mitochondrial matrix markers, it was demonstrated that mutations that accelerate the folding process of FPs reduced the expected (mitochondrial) localization. Endosomal markers also exhibited a similar tendency. Following the discovery and cloning of GFP and its relatives, FPs have facilitated the routine monitoring of protein and organelle dynamics in living cells and cellular dynamics in whole animal bodies (Chudakov et al., 2010; Day and Davidson, 2009). When tagging a protein of interest with FPs, FPs are usually appended to the amino and/or carboxyl terminus or even added within the sequence of a protein. The choice of the portion to which FPs are attached can be determined according to the reported properties of the protein of interest; however, in most cases, there is no rational basis for the design of FFPs and a trial-and-error strategy must be used. Because of the size of a fluorescent protein, the resulting perturbations to the overall folding and function of the protein of interest can be significant. When designing an FFP, linkers can be used to join the two sequences. This strategy helps to overcome the aforementioned challenges of protein folding and function, but the sequence itself is also critical for the proper functioning of tagged proteins. In addition to the above issues (the site and method used to add FPs), we propose that the properties of the FP itself can determine FFP function, particularly in the case of mitochondrial and endosomal markers.
Major mitochondrial proteins are synthesized in the cytosol and transported to the mitochondria. To be localized within mitochondria, the precursors need to be imported across one or both of the mitochondrial membranes through a pore formed by the TOM complex (Chacinska et al., 2009). Given the diameters of pores, which range from 13 Å (Tim23) to 20 Å (Tom40), only unfolded proteins can pass through them (Pfanner and Truscott, 2002). It is generally assumed that mitochondrial preproteins are usually unfolded or loosely folded in the cytosol and guided by cytosolic targeting factors or chaperones to the mitochondria. Furthermore, it has also been reported that several preproteins contain stably folded domains in the cytosol (Bömer et al., 1997; Wienhues et al., 1991). For such proteins, the mitochondrial import machinery actively unfolds and imports the preprotein. Indeed, the importing efficiency of a protein is correlated with the ease of its unfolding and resistance to mechanical unfolding of the folded proteins (Eilers and Schatz, 1986; Sato et al., 2005; Wilcox et al., 2005). In the case of mitochondria-targeted FFPs with avGFP, we clearly demonstrated that the fast folding of FPs prevented their proper localization. It is noteworthy that only mCherry is found to be mislocalized among the RFPs tested. Consistent with this finding, previous report demonstrated that mito-mCherry is more likely to be mislocalized than mito-DsRed Express in a manner dependent on the number of mutations introduced into mCherry (Pastukh et al., 2008). Given that the mutations V7I and M182K in mCherry promote the protein folding (half time for maturation of DsRed and mCherry are ~10 h and 15 min, respectively) (Shaner et al., 2008), the relationship between folding latency and mitochondria targeting might serve as a common feature for different FPs. It might be possible that once fast-folding FPs are folded, they become stable in the folded state and are resistant to unfolding by the mitochondrial protein import machinery. Indeed, it has been reported that GFP39N (F99S/M153T/V163A) displays higher thermostability than wild-type avGFP (Aliye et al., 2015). Another possibility is that folded FPs prevent the binding of FFPs to mitochondrial-targeting factors or chaperones in the cytosol, which guide them to the mitochondrial surface. For FFPs to be incorporated into mitochondria, the FPs within FFPs must be in an unfolded state. Given that mito-DsRed, which is more stable than EGFP when folded (Verkhusha et al., 2003), and mito-EGFP were preferentially localized to the mitochondria, the latter possibility might be more plausible. A systematic examination of the mechanical unfolding kinetics of FPs by atomic-force microscopy will be of great help in clarifying this issue (Perez-Jimenez et al., 2006). Another possible way to improve the mitochondrial localization of FFPs might be to multiply the mitochondrial targeting sequence. Indeed, whereas we showed that mito-Sirius was mislocalized, an additional mito sequence might improve the localization of FFPs (Tomosugi et al., 2009). However, it was reported that multiplication of mito occasionally displays cell toxicity (Palmer et al., 2006). Thus, it needs to take care to use multiple mitos.
Our observations demonstrated that mutations that accelerate the folding process of FPs disturb the mitochondrial localization of FFPs. There are a great number of FP variants that have been developed with the aim of improving brightness (via increased quantum yield and folding efficacy at 37°C), changing the excitation and emission spectra, and decreasing the chemical and photochemical sensitivity (Day and Davidson, 2009; Tsien, 1998). Among them, those with mutations that improve the folding efficiency of FP at 37°C (often called “folding” mutations; (Fukuda et al., 2000) exhibit enhanced brightness due to an increased proportion of mature, light-emitting FP molecules. Therefore, these mutations are generally considered to be favorable, which has encouraged the construction of new FFPs and the substitution of classical FPs with improved FPs. These results may lead to the questioning of this trend because fast-folding FP variants hamper the correct localization of FFPs to the mitochondrial matrix, and a reverse mutation causes them to localize specifically to the mitochondria. A similar tendency was also observed for the endosomal markers.
In conclusion, we hereby suggest that slow-folding FPs might occasionally be suitable for FFPs targeting certain organelles, including the mitochondria and endosome. An increase in the extent of specific localization to the targeted organelle will improve the signal to noise ratio, which will improve the detection of not only organelle morphology but also organelle-specific changes in ion concentration, signaling, and protein-protein interactions with FFPs. This will definitely improve the elucidation of cell physiological functions in detail.
Acknowledgments.
We thank A. Miyawaki for providing the cDNA of Venus and SECFP, and A. Kikuchi for technical assistance. This work was supported in part by Grants-in-Aid from the Ministry of Education, Culture, Sports, Science and Technology of Japan (#18H04850, #19H05411, and #19H04823) and the Japan Society for the Promotion of Science (#17H04016, 19K22506, #16H06227, 17J07984, and 18KK0196) as well as by grants from the Canon Foundation, the. Akiyama Life Science Foundation, and the Konica Minolta Science and Technology Foundation.
Conflict of interest
The authors declare that there are no conflicts of interest.
References
- Aliye, N., Fabbretti, A., Lupidi, G., Tsekoa, T., and Spurio, R. 2015. Engineering color variants of green fluorescent protein (GFP) for thermostability, pH-sensitivity, and improved folding kinetics. Appl. Microbiol. Biotechnol., 99: 1205–1216.
- Archer, S.L. 2013. Mitochondrial dynamics—mitochondrial fission and fusion in human diseases. N. Engl. J. Med., 369: 2236–2251.
- Aw, T.Y. and Jones, D.P. 1989. Heterogeneity of pH in the aqueous cytoplasm of renal proximal tubule cells. FASEB J., 3: 52–58.
- Bajar, B.T., Wang, E.S., Lam, A.J., Kim, B.B., Jacobs, C.L., Howe, E.S., Davidson, M.W., Lin, M.Z., and Chu, J. 2016. Improving brightness and photostability of green and red fluorescent proteins for live cell imaging and FRET reporting. Sci. Rep., 6: 20889.
- Berezhnov, A.V., Soutar, M.P.M., Fedotova, E.I., Frolova, M.S., Plun-Favreau, H., Zinchenko, V.P., and Abramov, A.Y. 2016. Intracellular pH modulates autophagy and mitophagy. J. Biol. Chem., 291: 8701–8708.
- Bömer, U., Meijer, M., Guiard, B., Dietmeier, K., Pfanner, N., and Rassow, J. 1997. The sorting route of cytochrome b2 branches from the general mitochondrial import pathway at the preprotein translocase of the inner membrane. J. Biol. Chem., 272: 30439–30446.
- Cano Abad, M.F., Di Benedetto, G., Magalhães, P.J., Filippin, L., and Pozzan, T. 2004. Mitochondrial pH Monitored by a New Engineered Green Fluorescent Protein Mutant. J. Biol. Chem., 279: 11521–11529.
- Chacinska, A., Koehler, C.M., Milenkovic, D., Lithgow, T., and Pfanner, N. 2009. Importing mitochondrial proteins: machineries and mechanisms. Cell, 138: 628–644.
- Chudakov, D.M., Matz, M.V., Lukyanov, S., and Lukyanov, K.A. 2010. Fluorescent proteins and their applications in imaging living cells and tissues. Physiol. Rev., 90: 1103–1163.
- Day, R.N. and Davidson, M.W. 2009. The fluorescent protein palette: tools for cellular imaging. Chem. Soc. Rev., 38: 2887–2921.
- De Michele, R., Carimi, F., and Frommer, W.B. 2014. Mitochondrial biosensors. Int. J. Biochem. Cell Biol., 48: 39–44.
- DeLean, A., Munson, P.J., and Rodbard, D. 1978. Simultaneous analysis of families of sigmoidal curves: application to bioassay, radioligand assay, and physiological dose-response curves. Am. J. Physiol., 235: E97–102.
- Di Benedetto, G., Scalzotto, E., Mongillo, M., and Pozzan, T. 2013. Mitochondrial Ca2+ uptake induces cyclic AMP generation in the matrix and modulates organelle ATP levels. Cell Metab., 17: 965–975.
- DiPilato, L.M., Cheng, X., and Zhang, J. 2004. Fluorescent indicators of cAMP and Epac activation reveal differential dynamics of cAMP signaling within discrete subcellular compartments. Proc. Natl. Acad. Sci. USA, 101: 16513–16518.
- Eilers, M. and Schatz, G. 1986. Binding of a specific ligand inhibits import of a purified precursor protein into mitochondria. Nature, 322: 228–232.
- Filonov, G.S., Piatkevich, K.D., Ting, L.-M., Zhang, J., Kim, K., and Verkhusha, V.V. 2011. Bright and stable near-infrared fluorescent protein for in vivo imaging. Nat. Biotechnol., 29: 757–761.
- Fujioka, Y., Tsuda, M., Hattori, T., Sasaki, J., Sasaki, T., Miyazaki, T., and Ohba, Y. 2011. The Ras-PI3K signaling pathway is involved in clathrin-independent endocytosis and the internalization of influenza viruses. PLoS ONE, 6: e16324.
- Fujioka, Y., Nishide, S., Ose, T., Suzuki, T., Kato, I., Fukuhara, H., Fujioka, M., Horiuchi, K., Satoh, A.O., Nepal, P., et al. 2018. A sialylated voltage-dependent Ca2+ channel binds hemagglutinin and mediates Influenza A virus entry into mammalian cells. Cell Host Microbe, 23: 809–818.e5.
- Fukuda, H., Arai, M., and Kuwajima, K. 2000. Folding of green fluorescent protein and the Cycle3 mutant. Biochemistry, 39: 12025–12032.
- Griesbeck, O., Baird, G.S., Campbell, R.E., Zacharias, D.A., and Tsien, R.Y. 2001. Reducing the environmental sensitivity of yellow fluorescent protein. Mechanism and applications. J. Biol. Chem., 276: 29188–29194.
- Gurskaya, N.G., Fradkov, A.F., Pounkova, N.I., Staroverov, D.B., Bulina, M.E., Yanushevich, Y.G., Labas, Y.A., Lukyanov, S., and Lukyanov, K.A. 2003. A colourless green fluorescent protein homologue from the non-fluorescent hydromedusa Aequorea coerulescens and its fluorescent mutants. Biochem. J., 373: 403–408.
- Hanson, G.T., Aggeler, R., Oglesbee, D., Cannon, M., Capaldi, R.A., Tsien, R.Y., and Remington, S.J. 2004. Investigating mitochondrial redox potential with redox-sensitive green fluorescent protein indicators. J. Biol. Chem., 279: 13044–13053.
- Heim, R., Prasher, D.C., and Tsien, R.Y. 1994. Wavelength mutations and posttranslational autoxidation of green fluorescent protein. Proc. Natl. Acad. Sci. USA, 91: 12501–12504.
- Heim, R., Cubitt, A.B., and Tsien, R.Y. 1995. Improved green fluorescence. Nature, 373: 663–664.
- Iannetti, E.F., Smeitink, J.A.M., Beyrath, J., Willems, P.H.G.M., and Koopman, W.J.H. 2016. Multiplexed high-content analysis of mitochondrial morphofunction using live-cell microscopy. Nat. Protoc., 11: 1693–1710.
- Karasawa, S., Araki, T., Nagai, T., Mizuno, H., and Miyawaki, A. 2004. Cyan-emitting and orange-emitting fluorescent proteins as a donor/acceptor pair for fluorescence resonance energy transfer. Biochem. J., 381: 307–312.
- Lakadamyali, M., Rust, M.J., and Zhuang, X. 2006. Ligands for clathrin-mediated endocytosis are differentially sorted into distinct populations of early endosomes. Cell, 124: 997–1009.
- Lam, A.J., St-Pierre, F., Gong, Y., Marshall, J.D., Cranfill, P.J., Baird, M.A., McKeown, M.R., Wiedenmann, J., Davidson, M.W., Schnitzer, M.J., et al. 2012. Improving FRET dynamic range with bright green and red fluorescent proteins. Nat. Methods, 9: 1005–1012.
- Mena, M.A., Treynor, T.P., Mayo, S.L., and Daugherty, P.S. 2006. Blue fluorescent proteins with enhanced brightness and photostability from a structurally targeted library. Nat. Biotechnol., 24: 1569–1571.
- Mitra, K., Wunder, C., Roysam, B., Lin, G., and Lippincott-Schwartz, J. 2009. A hyperfused mitochondrial state achieved at G1-S regulates cyclin E buildup and entry into S phase. Proc. Natl. Acad. Sci. USA, 106: 11960–11965.
- Nagai, T., Ibata, K., Park, E.S., Kubota, M., Mikoshiba, K., and Miyawaki, A. 2002. A variant of yellow fluorescent protein with fast and efficient maturation for cell-biological applications. Nat. Biotechnol., 20: 87–90.
- Ormö, M., Cubitt, A.B., Kallio, K., Gross, L.A., Tsien, R.Y., and Remington, S.J. 1996. Crystal structure of the Aequorea victoria green fluorescent protein. Science, 273: 1392–1395.
- Palmer, A.E., Giacomello, M., Kortemme, T., Hires, S.A., Lev-Ram, V., Baker, D., and Tsien, R.Y. 2006. Ca2+ Indicators Based on Computationally Redesigned Calmodulin-Peptide Pairs. Chem. Biol., 13: 521–530.
- Pastukh, V., Shokolenko, I.N., Wilson, G.L., and Alexeyev, M.F. 2008. Mutations in the passenger polypeptide can affect its partitioning between mitochondria and cytoplasm: Mutations can impair the mitochondrial import of DsRed. Mol. Biol. Rep., 35: 215–223.
- Perez-Jimenez, R., Garcia-Manyes, S., Ainavarapu, S.R.K., and Fernandez, J.M. 2006. Mechanical unfolding pathways of the enhanced yellow fluorescent protein revealed by single molecule force spectroscopy. J. Biol. Chem., 281: 40010–40014.
- Pédelacq, J.-D., Cabantous, S., Tran, T., Terwilliger, T.C., and Waldo, G.S. 2006. Engineering and characterization of a superfolder green fluorescent protein. Nat. Biotechnol., 24: 79–88.
- Pfanner, N. and Truscott, K.N. 2002. Powering mitochondrial protein import. Nat. Struct. Biol., 9: 234–236.
- Reid, B.G. and Flynn, G.C. 1997. Chromophore formation in green fluorescent protein. Biochemistry, 36: 6786–6791.
- Riedl, J., Crevenna, A.H., Kessenbrock, K., Yu, J.H., Neukirchen, D., Bista, M., Bradke, F., Jenne, D., Holak, T.A., Werb, Z., et al. 2008. Lifeact: a versatile marker to visualize F-actin. Nat. Methods, 5: 605–607.
- Rizzuto, R., Brini, M., Pizzo, P., Murgia, M., and Pozzan, T. 1995. Chimeric green fluorescent protein as a tool for visualizing subcellular organelles in living cells. Curr. Biol., 5: 635–642.
- Sankaranarayanan, S., De Angelis, D., Rothman, J.E., and Ryan, T.A. 2000. The use of pHluorins for optical measurements of presynaptic activity. Biophys. J., 79: 2199–2208.
- Sato, T., Esaki, M., Fernandez, J.M., and Endo, T. 2005. Comparison of the protein-unfolding pathways between mitochondrial protein import and atomic-force microscopy measurements. Proc. Natl. Acad. Sci. USA, 102: 17999–18004.
- Shaner, N.C., Lin, M.Z., McKeown, M.R., Steinbach, P.A., Hazelwood, K.L., Davidson, M.W., and Tsien, R.Y. 2008. Improving the photostability of bright monomeric orange and red fluorescent proteins. Nat. Methods, 5: 545–551.
- Shcherbo, D., Murphy, C.S., Ermakova, G.V., Solovieva, E.A., Chepurnykh, T.V., Shcheglov, A.S., Verkhusha, V.V., Pletnev, V.Z., Hazelwood, K.L., Roche, P.M., et al. 2009. Far-red fluorescent tags for protein imaging in living tissues. Biochem. J., 418: 567–574.
- Shcherbo, D., Shemiakina, I.I., Ryabova, A.V., Luker, K.E., Schmidt, B.T., Souslova, E.A., Gorodnicheva, T.V., Strukova, L., Shidlovskiy, K.M., Britanova, O.V., et al. 2010. Near-infrared fluorescent proteins. Nat. Methods, 7: 827–829.
- Shimomura, O., Johnson, F.H., and Saiga, Y. 1962. Extraction, purification and properties of aequorin, a bioluminescent protein from the luminous hydromedusan, Aequorea. J. Cell. Comp. Physiol., 59: 223–239.
- Smith, D.B. and Johnson, K.S. 1988. Single-step purification of polypeptides expressed in Escherichia coli as fusions with glutathione S-transferase. Gene, 67: 31–40.
- Snapp, E.L., Hegde, R.S., Francolini, M., Lombardo, F., Colombo, S., Pedrazzini, E., Borgese, N., and Lippincott-Schwartz, J. 2003. Formation of stacked ER cisternae by low affinity protein interactions. J. Cell Biol., 163: 257–269.
- Takeuchi, M. and Ozawa, T. 2007. Methods for imaging and analyses of intracellular organelles using fluorescent and luminescent proteins. Anal. Sci., 23: 25–29.
- Timpson, P., McGhee, E.J., and Anderson, K.I. 2011. Imaging molecular dynamics in vivo—from cell biology to animal models. J. Cell Sci., 124: 2877–2890.
- Tomosugi, W., Matsuda, T., Tani, T., Nemoto, T., Kotera, I., Saito, K., Horikawa, K., and Nagai, T. 2009. An ultramarine fluorescent protein with increased photostability and pH insensitivity. Nat. Methods, 6: 351–353.
- Tsien, R.Y. 1998. The green fluorescent protein. Annu. Rev. Biochem., 67: 509–544.
- Verkhusha, V.V., Kuznetsova, I.M., Stepanenko, O.V., Zaraisky, A.G., Shavlovsky, M.M., Turoverov, K.K., and Uversky, V.N. 2003. High stability of Discosoma DsRed as compared to Aequorea EGFP. Biochemistry, 42: 7879–7884.
- Wienhues, U., Becker, K., Schleyer, M., Guiard, B., Tropschug, M., Horwich, A.L., Pfanner, N., and Neupert, W. 1991. Protein folding causes an arrest of preprotein translocation into mitochondria in vivo. J. Cell Biol., 115: 1601–1609.
- Wilcox, A.J., Choy, J., Bustamante, C., and Matouschek, A. 2005. Effect of protein structure on mitochondrial import. Proc. Natl. Acad. Sci. USA, 102: 15435–15440.
- Wu, Y., Zhang, K., Seong, J., Fan, J., Chien, S., Wang, Y., and Lu, S. 2016. In-situ coupling between kinase activities and protein dynamics within single focal adhesions. Sci. Rep., 6: 29377.
- Youle, R.J. and van der Bliek, A.M. 2012. Mitochondrial fission, fusion, and stress. Science, 337: 1062–1065.
- Zurek, N., Sparks, L., and Voeltz, G. 2011. Reticulon short hairpin transmembrane domains are used to shape ER tubules. Traffic, 12: 28–41.
Abbreviations
avAequorea victoria
DsDiscosoma sea anemones
EEA1early endosomal antigen 1
ERendoplasmic reticulum
FCCPp-trifluoromethoxyphenylhydrazone
FFPfluorescent fusion protein
FPfluorescent protein
FRETFörster resonance energy transfer
GalTβ1,4-galactose transferase
GFPgreen fluorescent protein
H2Bhistone 2B
KRasCTC-terminal hypervariable region of K-Ras 4B
sfGFPsuperfolder GFP
TOMtranslocase of outer membrane
