Abstract
The claudin family of membrane proteins is responsible for the backbone structure and function of tight junctions (TJs), which regulate the paracellular permeability of epithelia. It is thought that each claudin subtype has its own unique function and the combination of expressed subtypes determines the permeability property of each epithelium. However, many issues remain unsolved in regard to claudin functions, including the detailed functional differences between claudin subtypes and the effect of the combinations of specific claudin subtypes on the structure and function of TJs. To address these issues, it would be useful to have a way of reconstituting TJs containing only the claudin subtype(s) of interest in epithelial cells. In this study, we attempted to reconstitute TJs of individual claudin subtypes in TJ-deficient MDCK cells, designated as claudin quinKO cells, which were previously established from MDCK II cells by deleting the genes of claudin-1, -2, -3, -4, and -7. Exogenous expression of each of claudin-1, -2, -3, -4, and -7 in claudin quinKO cells resulted in the reconstitution of functional TJs. These TJs did not contain claudin-12 and -16, which are endogenously expressed in claudin quinKO cells. Furthermore, overexpression of neither claudin-12 nor claudin-16 resulted in the reconstitution of TJs, demonstrating the existence of claudin subtypes lacking TJ-forming activity in epithelial cells. Exogenous expression of the channel-forming claudin-2, -10a, -10b, and -15 reconstituted TJs with reported paracellular channel properties, demonstrating that these claudin subtypes form paracellular channels by themselves without interaction with other subtypes. Thus, the reconstitution of TJs in claudin quinKO cells is advantageous for further investigation of claudin functions.
Key words: tight junction, claudin, paracellular permeability, epithelial barrier
Introduction
Tight junctions play a crucial role in epithelial barrier function and epithelial transport by regulating the free diffusion of solutes via the paracellular pathway, contributing to the homeostasis of fluid compartments in the body (Anderson and Van Itallie, 2009; Otani and Furuse, 2020; Zihni et al., 2016). The claudin family of membrane proteins is responsible for the backbone structure and function of TJs (Furuse et al., 1998b). Claudins have four transmembrane domains, two cytoplasmic domains, two extracellular loops and a cytoplasmic turn between the second and third transmembrane domains (Furuse et al., 1998a). Claudins assemble into cell–cell contacts at both of the adjacent cells and polymerize within the plasma membrane to form a fibril-like structure, designated as TJ strands (Furuse et al., 1998a, 1999). A network of TJ strands continuously circumscribes the cell and seals the intercellular space to form paracellular diffusion barriers (Staehelin, 1973). Claudins comprise a multigene family of 27 members, which have functional diversity (Mineta et al., 2011). They can be briefly categorized into two types: barrier-forming claudins, which act as barriers to small molecules such as electrolytes, and pore-forming claudins, which can allow electrolytes and water to permeate through as paracellular channels (Tsukita et al., 2019; Günzel and Yu, 2013; Van Itallie and Anderson, 2014). Pore-forming claudins are further divided into cation-selective claudins, including claudin-2, -10b, and -15, and anion-selective claudins, including claudin-10a, -17, and -21 (Günzel and Yu, 2013). Each epithelium expresses a certain combination and proportion of claudin subtypes to create functional diversity of the paracellular pathway depending on the physiological requirement of each epithelium (Furuse and Tsukita, 2006; Van Itallie and Anderson, 2014; Günzel and Yu, 2013; Tsukita et al., 2019).
Almost without exception, multiple subtypes of claudins are co-expressed in various types of epithelial cells. Even allowing for functional regulation of TJs by barrier-forming and pore-forming claudins, it seems that an excessive number of claudin subtypes are often co-expressed in certain epithelial types. For instance, epithelial cells of the thick ascending limb in the kidney express claudin-3, -10b, -14, -16, and -19 (Milatz et al., 2017), while those of the small intestine express claudin-2, -3, -4, -7, -8, -12, and -15 (Tamura et al., 2008). There are several possible explanations for the significance of the co-expression of many claudin subtypes. First, fine-tuning the permeability property of the paracellular pathway may need a complex combination of claudin subtypes, each of which may have a unique function. Second, excessive expression of multiple claudin subtypes may guarantee TJ formation by securing the necessary amount of the material for TJs. Third, the expression of a set of multiple claudin subtypes may be required for the generation of TJs with specific properties. In the thick ascending limb, claudin-16 and -19 interact with each other to make the paracellular pathway permeable to divalent cations (Hou et al., 2008). It was shown that the lack of either claudin-16 or -19 affects the localization of the other at TJs, suggesting that these two claudins work as a set (Hou et al., 2008). Such an interdependency was also reported between claudin-4 and claudin-8 to give TJs an anion channel property (Hou et al., 2010). However, it remains elusive why so many claudin subtypes are co-expressed in certain cell types.
Regarding pore-forming claudins, their channel properties were demonstrated by their overexpression in cultured epithelial cells, which also express endogenous claudins (Van Itallie et al., 2006; Krug et al., 2012b; Amasheh et al., 2002; Günzel et al., 2009; Tanaka et al., 2016; Colegio et al., 2002; Van Itallie et al., 2003). In these experiments, the detailed interaction of the introduced pore-forming claudins with endogenous claudins within TJ strands remains elusive. Claudin-2 and claudin-15 form TJ strands when overexpressed in claudin-negative fibroblasts (Furuse et al., 1998b) and insect Sf-9 cells (Suzuki et al., 2015), respectively, indicating that they assemble in a homophilic manner. Consistently, a homophilic assembly model for the cation pores of claudin-15 has been proposed because of the structural biology of the molecule (Suzuki et al., 2015). However, it has not been demonstrated yet whether these pore-forming claudins display their properties by homophilic assembly or by possible heterophilic assembly with other claudin subtypes. At least in in vitro experiments, claudin-2 can assemble in TJ strands in a heterophilic manner with claudin-1 or claudin-3 (Furuse et al., 1999).
In studies of the barrier/channel properties of individual claudin subtypes and their combinations using cultured epithelial cells, it would be ideal to use epithelial cell lines that lack TJs caused by the loss of claudin expression but are able to reconstitute TJs if claudin subtypes of interest are exogenously expressed. Using such cell lines, the function of TJs can be investigated with individual claudin subtypes or any combinations of multiple claudin subtypes without needing to consider the interventions of the other endogenously expressed claudins. Recently, we have succeeded in the establishment of a TJ-negative epithelial cell line from MDCK II cells by deleting the genes for claudin-1, -2, -3, -4, and -7, and they have been designated as claudin quintuple knockout (quinKO) cells (Otani et al., 2019). Claudin quinKO cells lack TJ strands as well as the barrier function to small molecules, although they retain an intercellular membrane attachment with barrier function to macromolecules, which is mediated by JAM-A, a TJ-associated membrane protein with two Ig-like domains (Otani et al., 2019). We have recently established mouse claudin-3-expressing claudin quinKO cells and confirmed that they reconstituted functional TJs (Fujiwara et al., 2022). Here, we further attempted to use claudin quinKO cells as ‘TJ-competent epithelial cells’ to reconstitute TJs through the introduction of individual claudins. As the first step to do this, we examined the expression of remaining endogenous claudin subtypes in claudin quinKO cells and investigated whether they possibly affect TJs reconstituted by exogenous claudins. We also addressed whether each of the five claudin subtypes deleted from MDCK II cells can reconstitute TJs in quinKO cells and whether channel-type claudins can reconstitute paracellular ion pores with ion selectivity by themselves.
Results
Endogenously expressed claudins in claudin quinKO cells
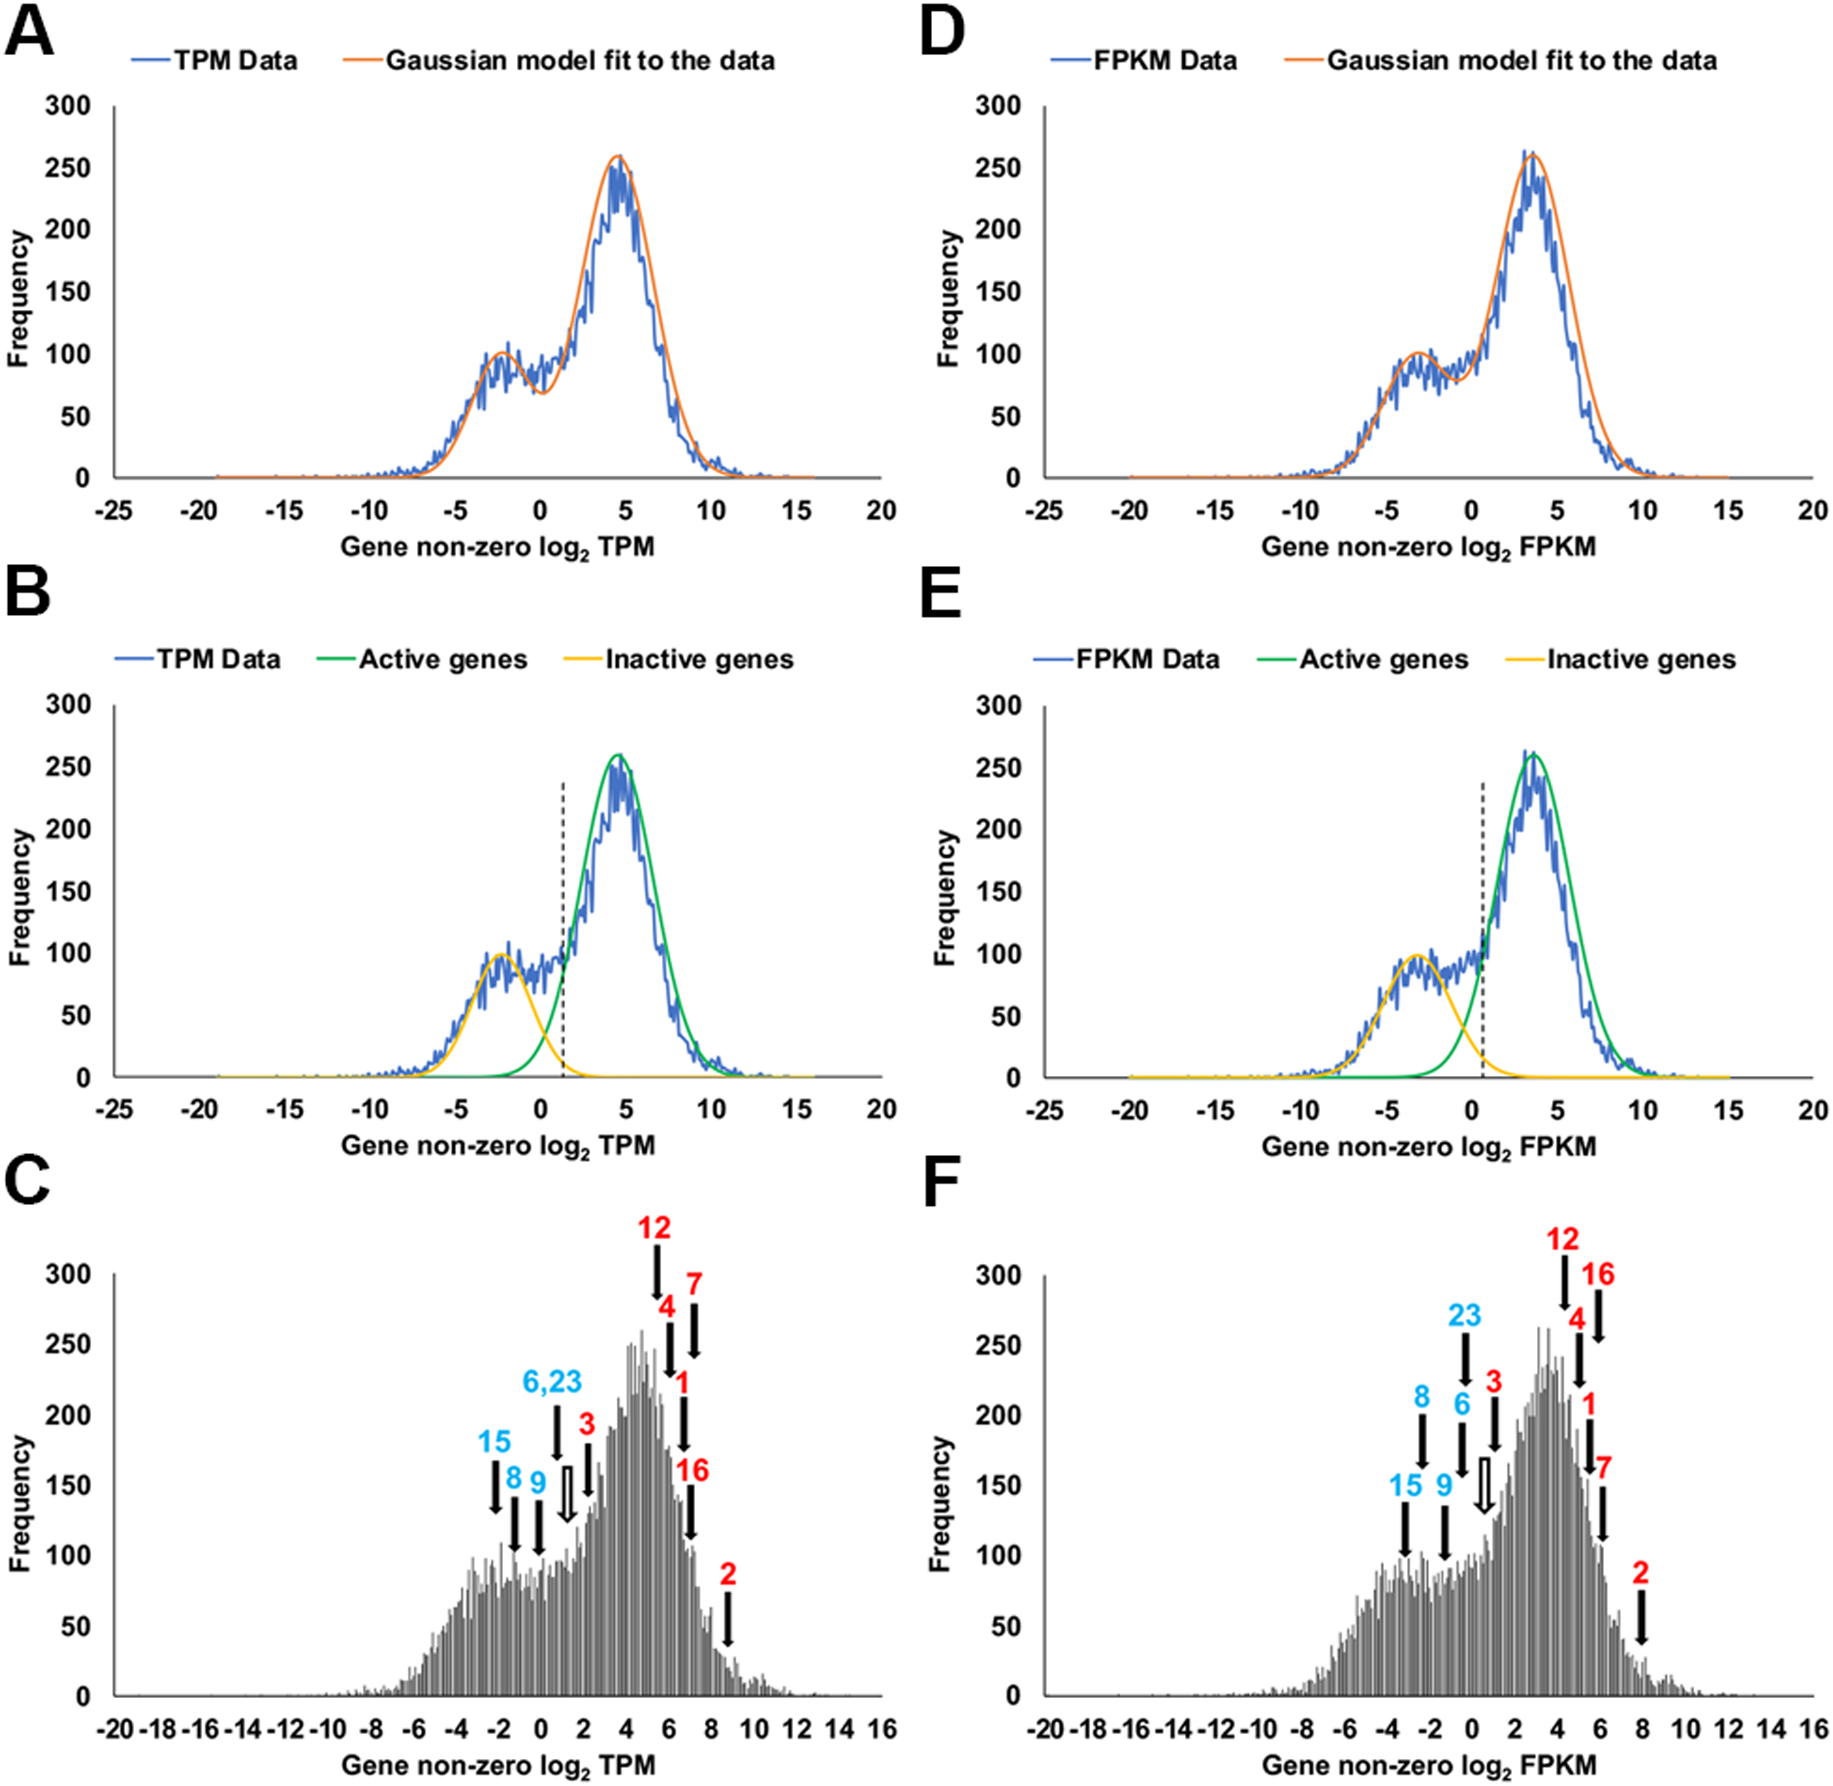
Claudin quinKO cells were generated from MDCK II cells by introducing mutations into the genes of five major claudin subtypes (Otani et al., 2019). However, transcripts of some other claudin subtypes were detected in an RNA sequencing (RNA-seq) analysis of MDCK II cells in a previous study (Shukla et al., 2015). To examine the expression of endogenous claudins in claudin quinKO cells, we performed RNA-seq analysis. Transcripts of claudin-1, -2, -3, -4, -6, -7, -8, -9, -12, -15, -16, and -23 were detected in claudin quinKO cells (Fig. 1). However, the RNA-seq method has the drawback of detecting transcripts of genes that are hardly expressed because of the high sensitivity of the method (McGowan et al., 2021). Therefore, we determined whether each claudin gene was transcriptionally active or inactive from the number of reads of gene-derived transcripts in the RNA-seq analysis. It was reported that the density plot of log2-transformed transcripts per million (TPM) and fragments per kilobase of transcript per million fragments mapped (FPKM) values derived from RNA-seq analysis approximate a mixed gaussian distribution consisting of two gaussian distributions of active and inactive genes (Hart et al., 2013; McGowan et al., 2021). Thus, we calculated the log2-transformed TPM and FPKM values of each gene, and density plots were created based on the values (Fig. 1A–F). By analyzing the density plots using the double gaussian model, claudin-1, -2, -3, -4, -7, -12, and -16 were judged as active genes, while claudin-6, -8, -9, -15, and -23 were judged as inactive genes (Fig. 1E, F). These results suggest that claudin-6, -8, -9, -15, and -23 genes are expressed at really low levels, while claudin-12 and -16 are significantly expressed in claudin quinKO cells.
To examine the role of endogenous claudin-12 and claudin-16 in TJ formation, we analyzed their expression and localization in MDCK II cells, claudin quinKO cells, and claudin quinKO cell clones stably expressing exogenous dog claudin-12 or claudin-16. Western blots showed strong signals for claudin-12 and claudin-16 in claudin quinKO cells expressing exogenous claudin-12 and claudin-16, respectively, while faint signals (possibly of the endogenous proteins) were detected in the same band locations (sizes) in MDCK II cells and claudin quinKO cells (Fig. 2A, B). In immunofluorescence staining, we could not detect claudin-12 or claudin-16 at cell–cell contacts in MDCK II cells and claudin quinKO cells except faint dot-like signals (Fig. 2C, D). In claudin quinKO cells expressing exogenous claudin-12, claudin-12 was distributed throughout the cell including the plasma membrane and intracellular vesicles, but not concentrated at the apical cell–cell contacts where occludin accumulates (Fig. 2C). In claudin quinKO cells expressing exogenous claudin-16, the distribution of claudin-16 on the plasma membrane appeared more evident than claudin-12, but the colocalization of claudin-16 with occludin was not clear (Fig. 2D). These results suggest that neither endogenous claudin-12 nor claudin-16 contributes to the structure of TJs in MDCK II cells. It is likely that the faint dot-like signals are due to the background staining.
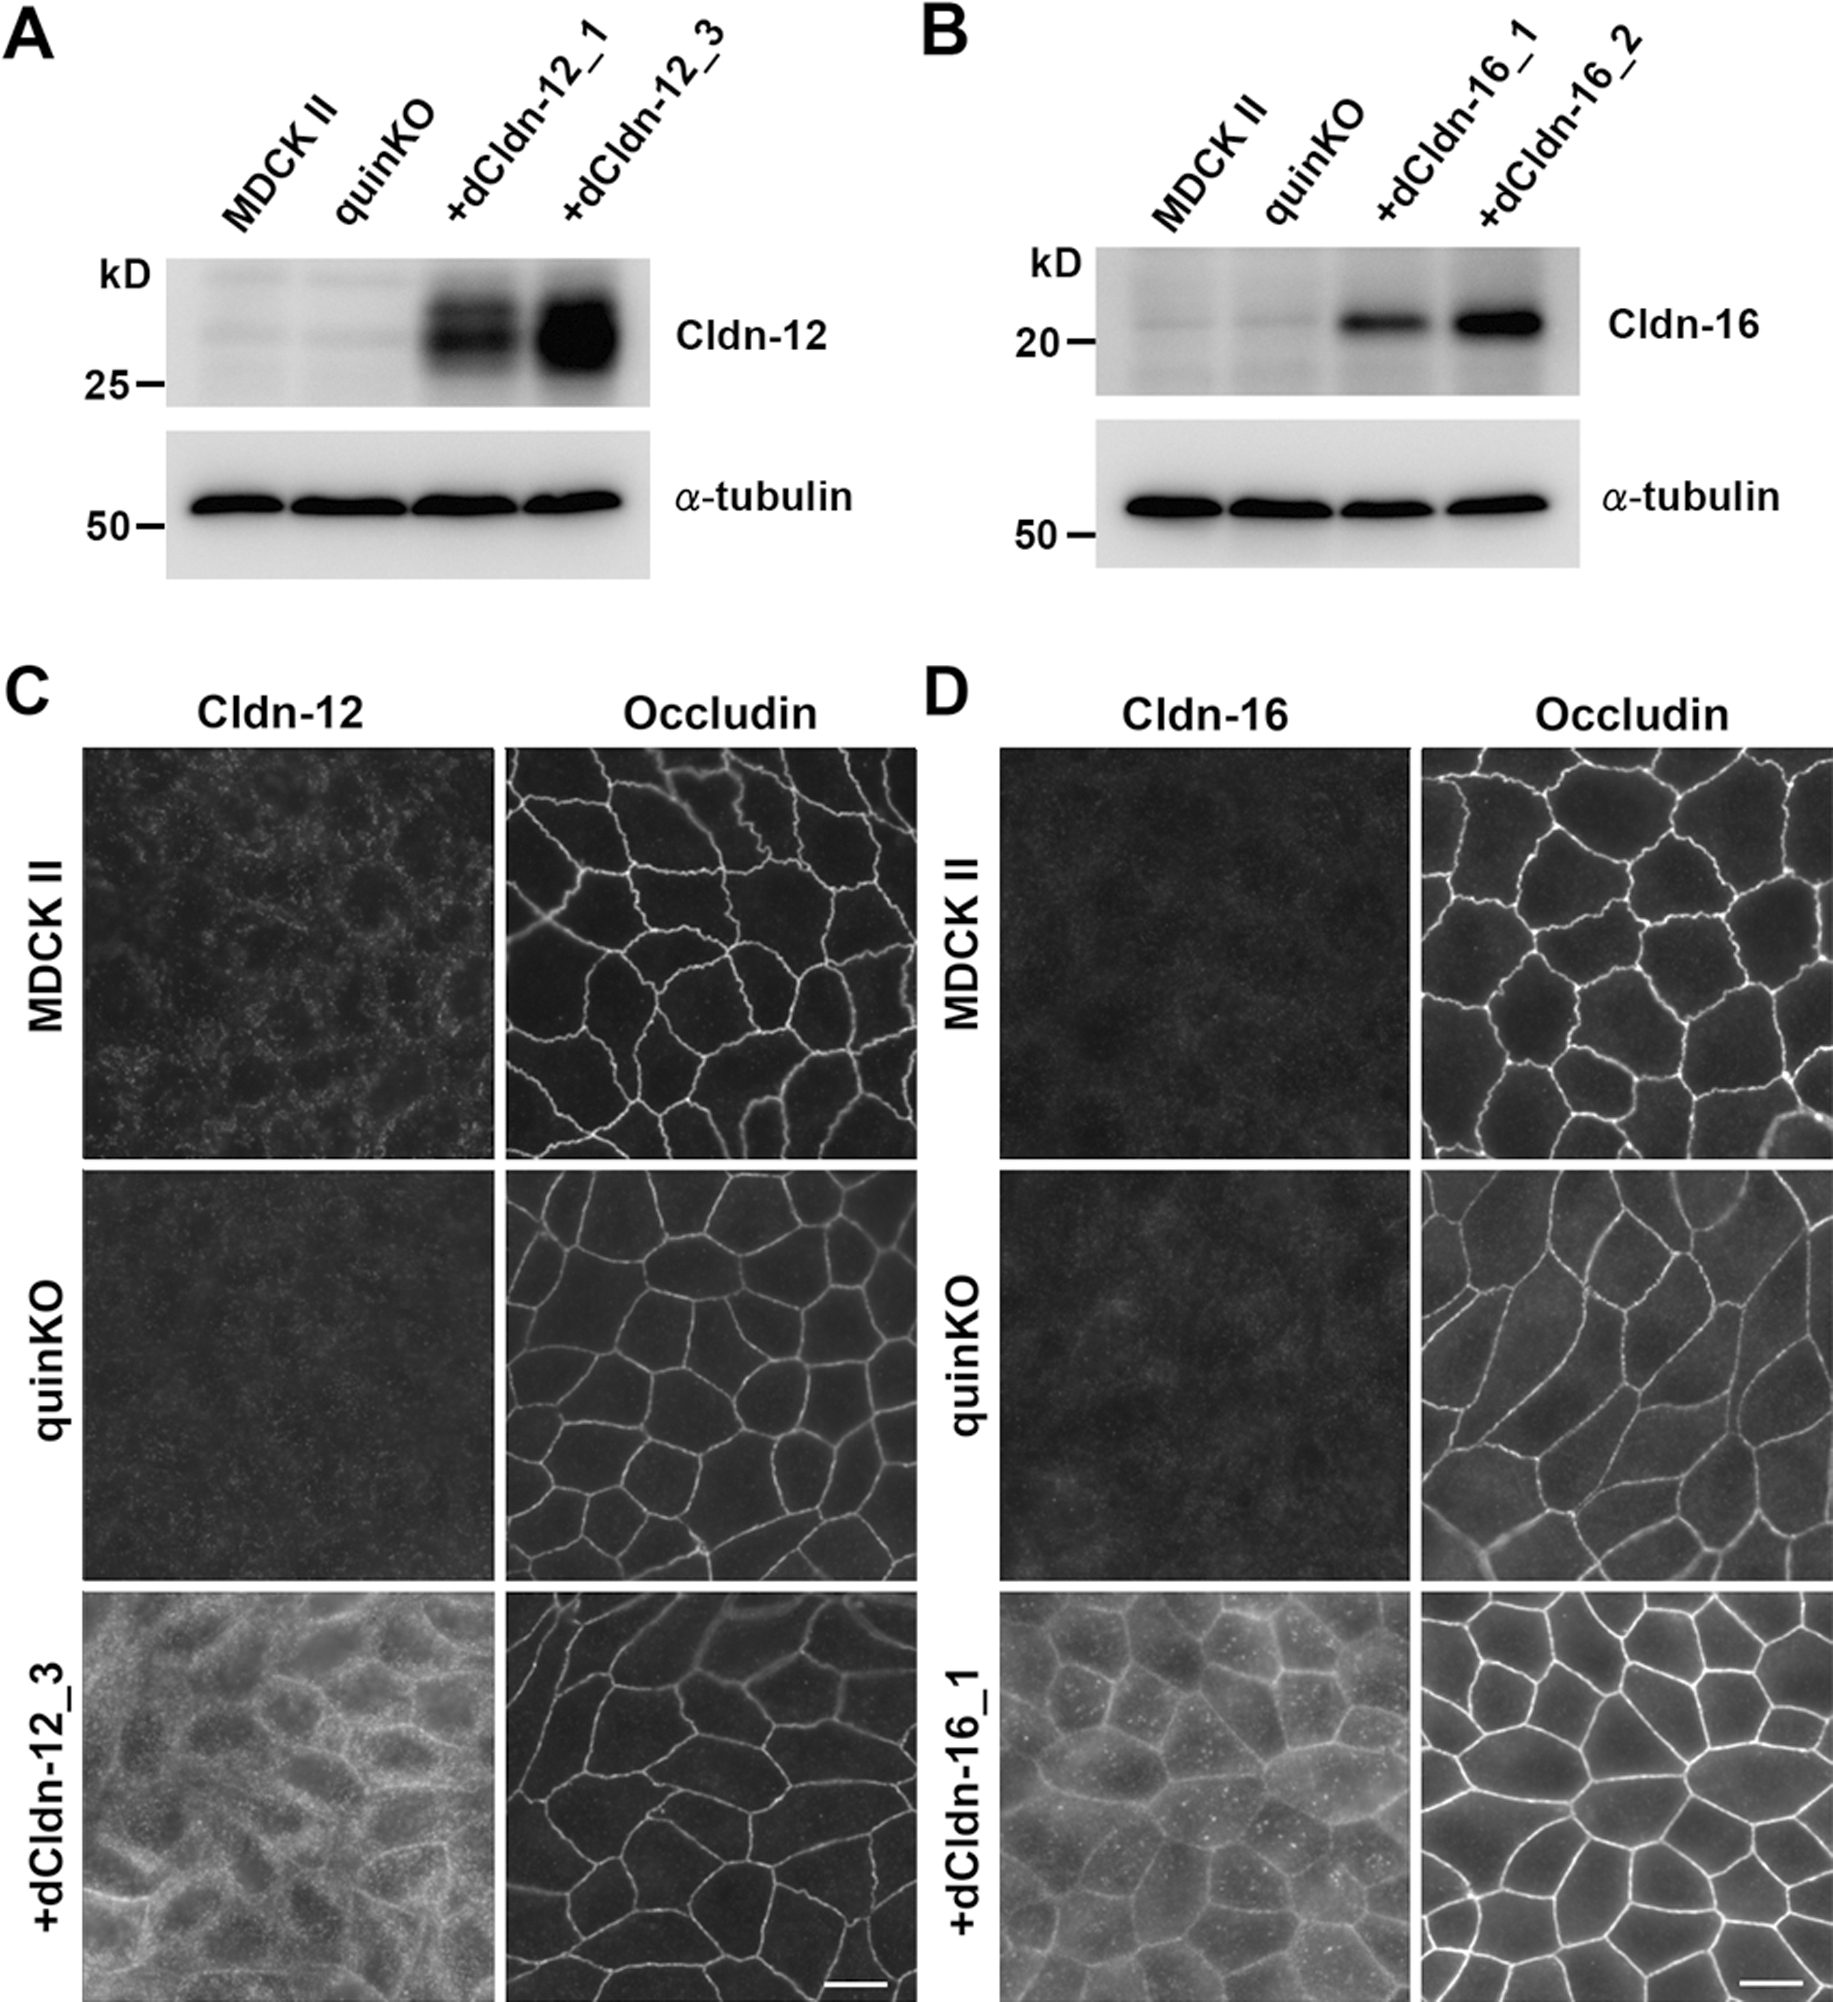
We reported previously that claudin quinKO cells showed a linear configuration of cell–cell junctions with reduced occludin staining compared to MDCK II cells (Otani et al., 2019). The claudin quinKO cells expressing exogenous claudin-12 retained these properties (Fig. 2C). In contrast, exogenous expression of claudin-16 remarkably increased occludin signals with a straight configuration at cell–cell contacts (Fig. 2D), although the mechanism is unclear.
Reconstitution of functional TJs in claudin quinKO cells by individual claudin subtypes expressed in MDCK II cells
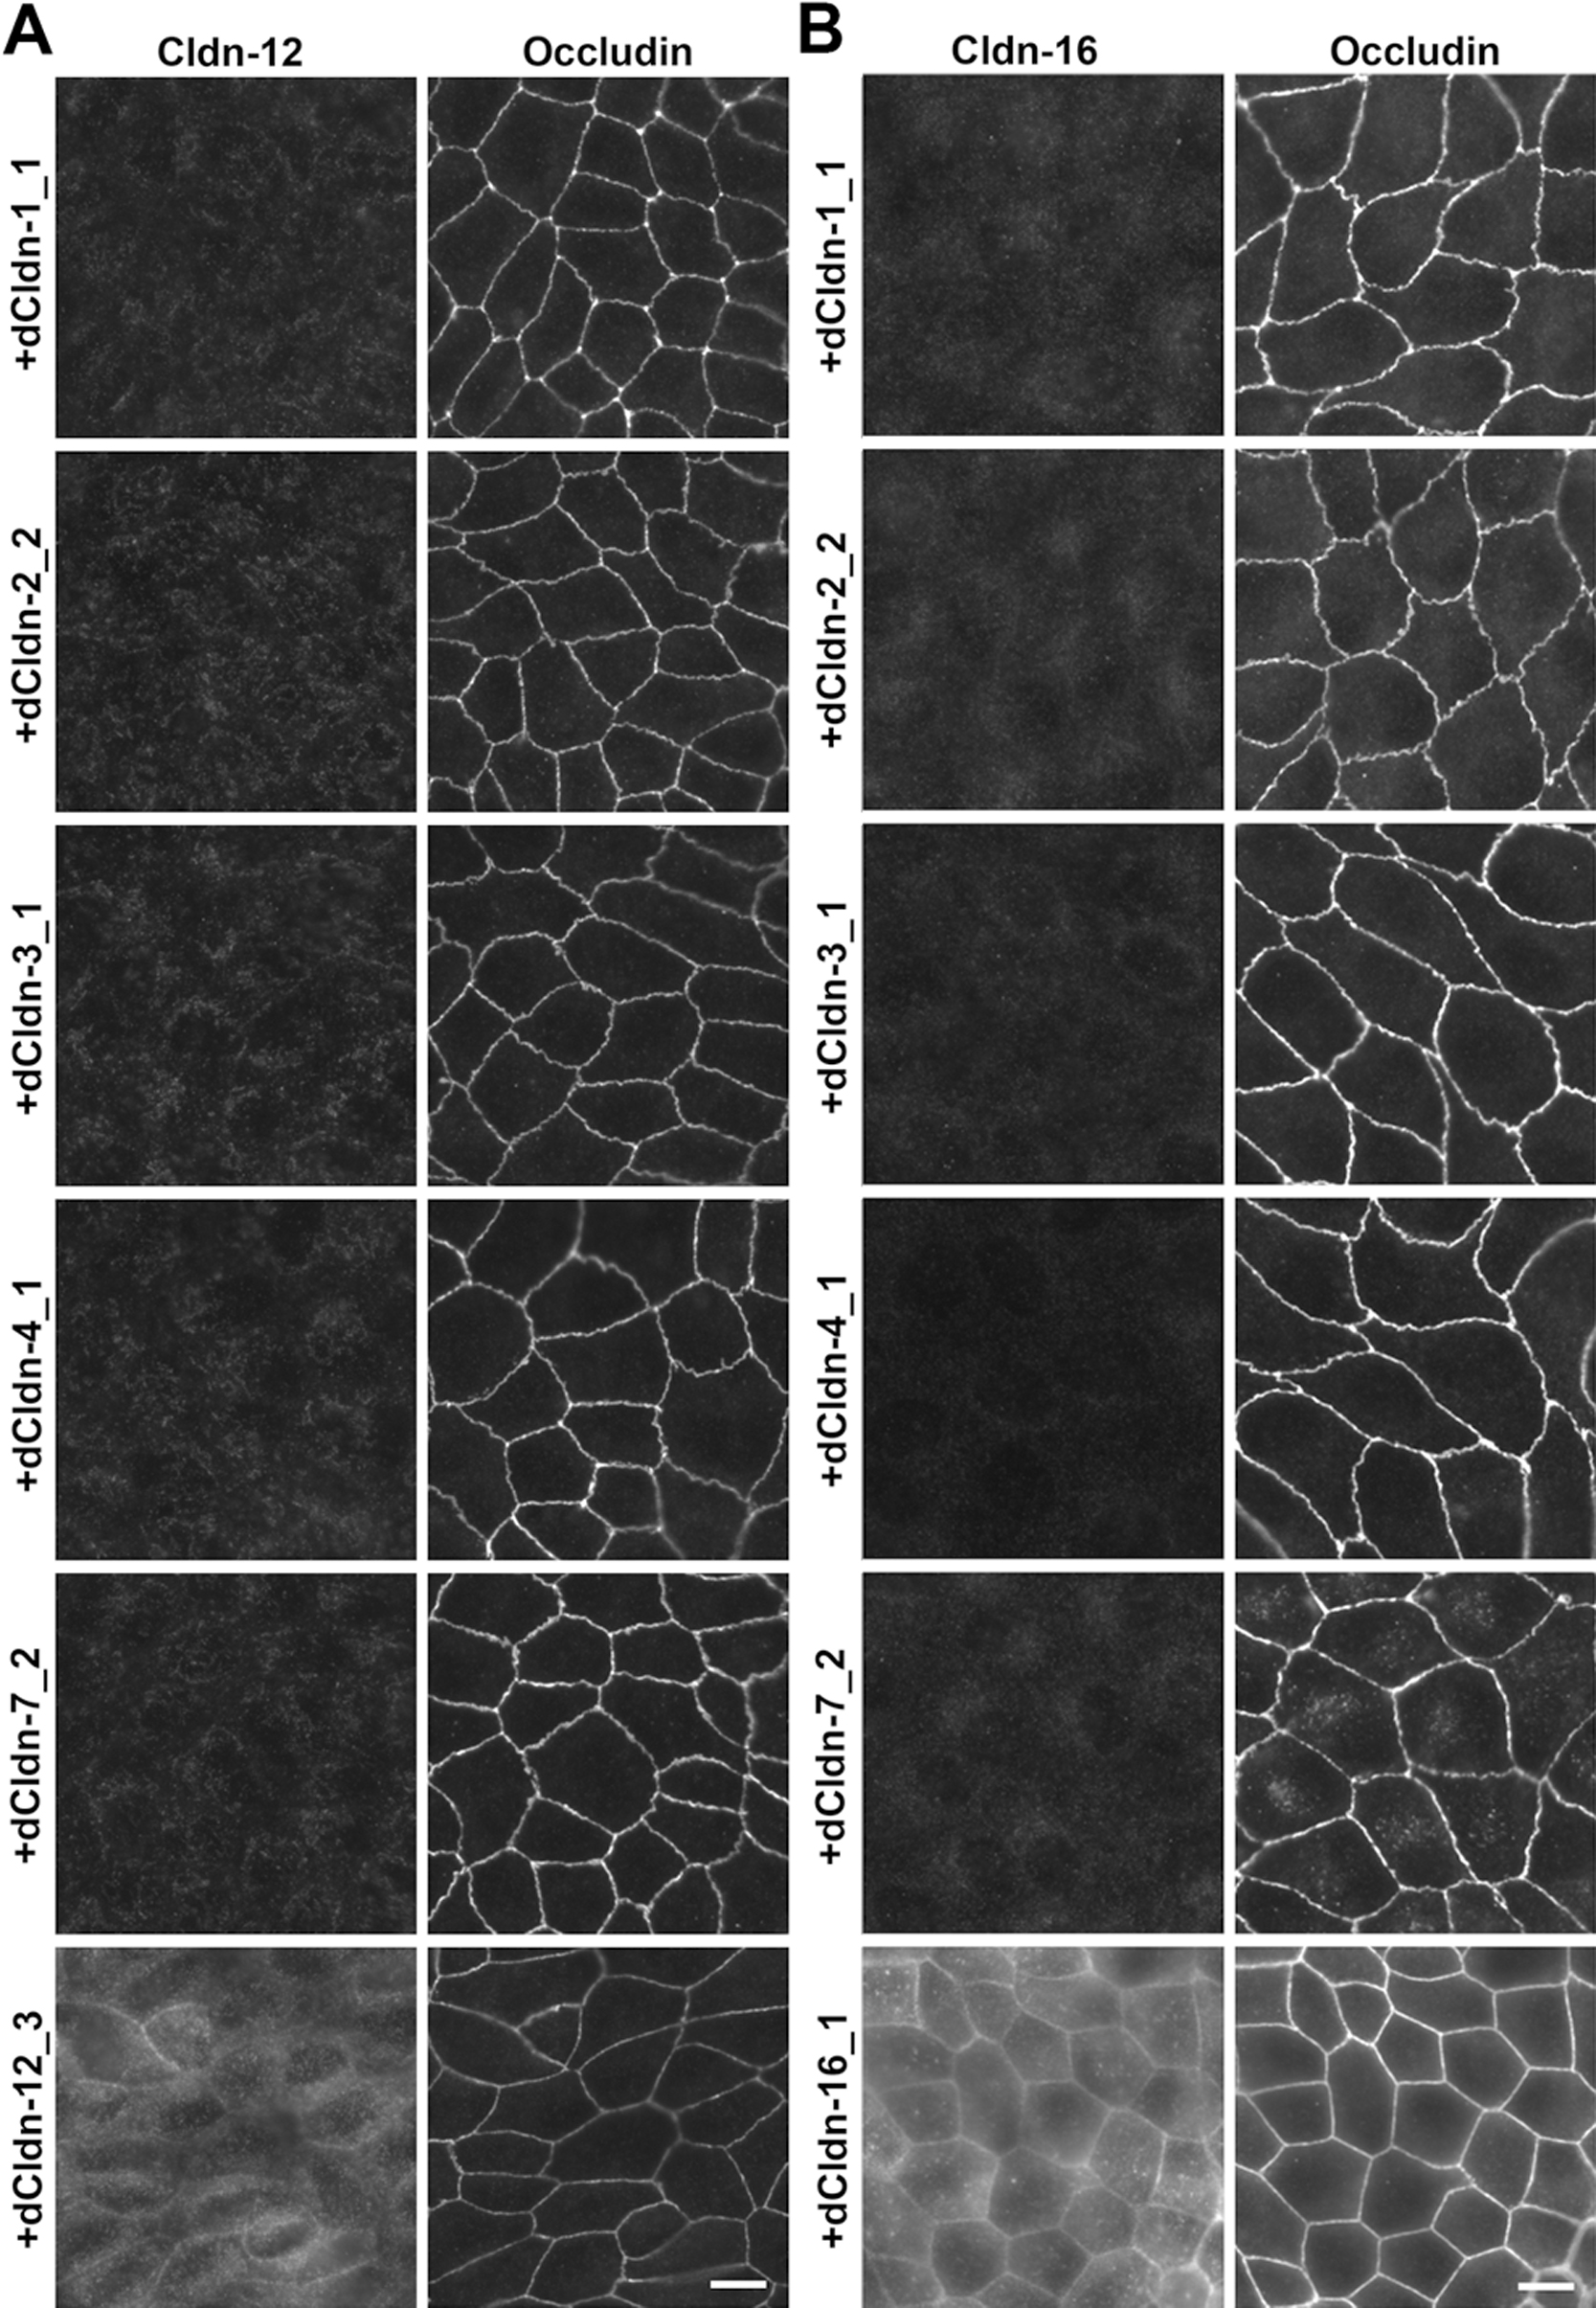
Next, we examined whether each of the five claudin subtypes deleted from MDCK II cells during the establishment of claudin quinKO cells can reconstitute TJs in claudin quinKO cells. We constructed expression vectors for each dog claudin-1, -2, -3, -4, and -7 under a strong CAG promoter (Niwa et al., 1991), and finally obtained claudin quinKO cell clones stably expressing each of these claudins. Two independent clones for claudin-1, -2, -3, and -4 were picked based on homogeneous expression of exogenous claudins in immunostaining and analyzed further, but only one cell clone that evenly expressed a sufficient amount of claudin-7 was obtained (Fig. 3A). Immunofluorescence staining showed that each claudin subtype was localized at cell–cell contacts circumscribing the cell and overlapped well with occludin, while additional signals were detected at intracellular vesicles (Fig. 3B). These observations suggest that each of the dog claudin-1, -2, -3, -4, and -7 reconstitutes TJs. In these transfectants, neither endogenous claudin-12 nor claudin-16 was detected at cell–cell contacts (Fig. 4A, B). Furthermore, freeze-fracture replica electron microscopy revealed that TJ strands are reconstituted at the most apical part in the lateral membrane in claudin quinKO cells expressing either claudin-1, -2, -3, -4, or -7 (Fig. 5A). To examine the epithelial barrier function of these cells, we measured transepithelial electrical resistance (TER) and paracellular flux, which reflect the resistance to electrolyte permeation and passage of a water-soluble tracer, respectively, across the cellular sheet. All the transfectants except one expressing pore-forming claudin-2 showed higher TER values compared to claudin quinKO cells although the TER varies depending on claudin subtypes and clones (Fig. 6A). The paracellular flux of fluorescein (332Da) in all the transfectants was much lower than in claudin quinKO cells (Fig. 6B). Taken together, we conclude that each of the claudin subtypes deleted from MDCK II cells during the generation of claudin quinKO cells can reconstitute functional TJs and that the contribution of endogenous claudin-12 or claudin-16 to these reconstituted TJs is negligible.

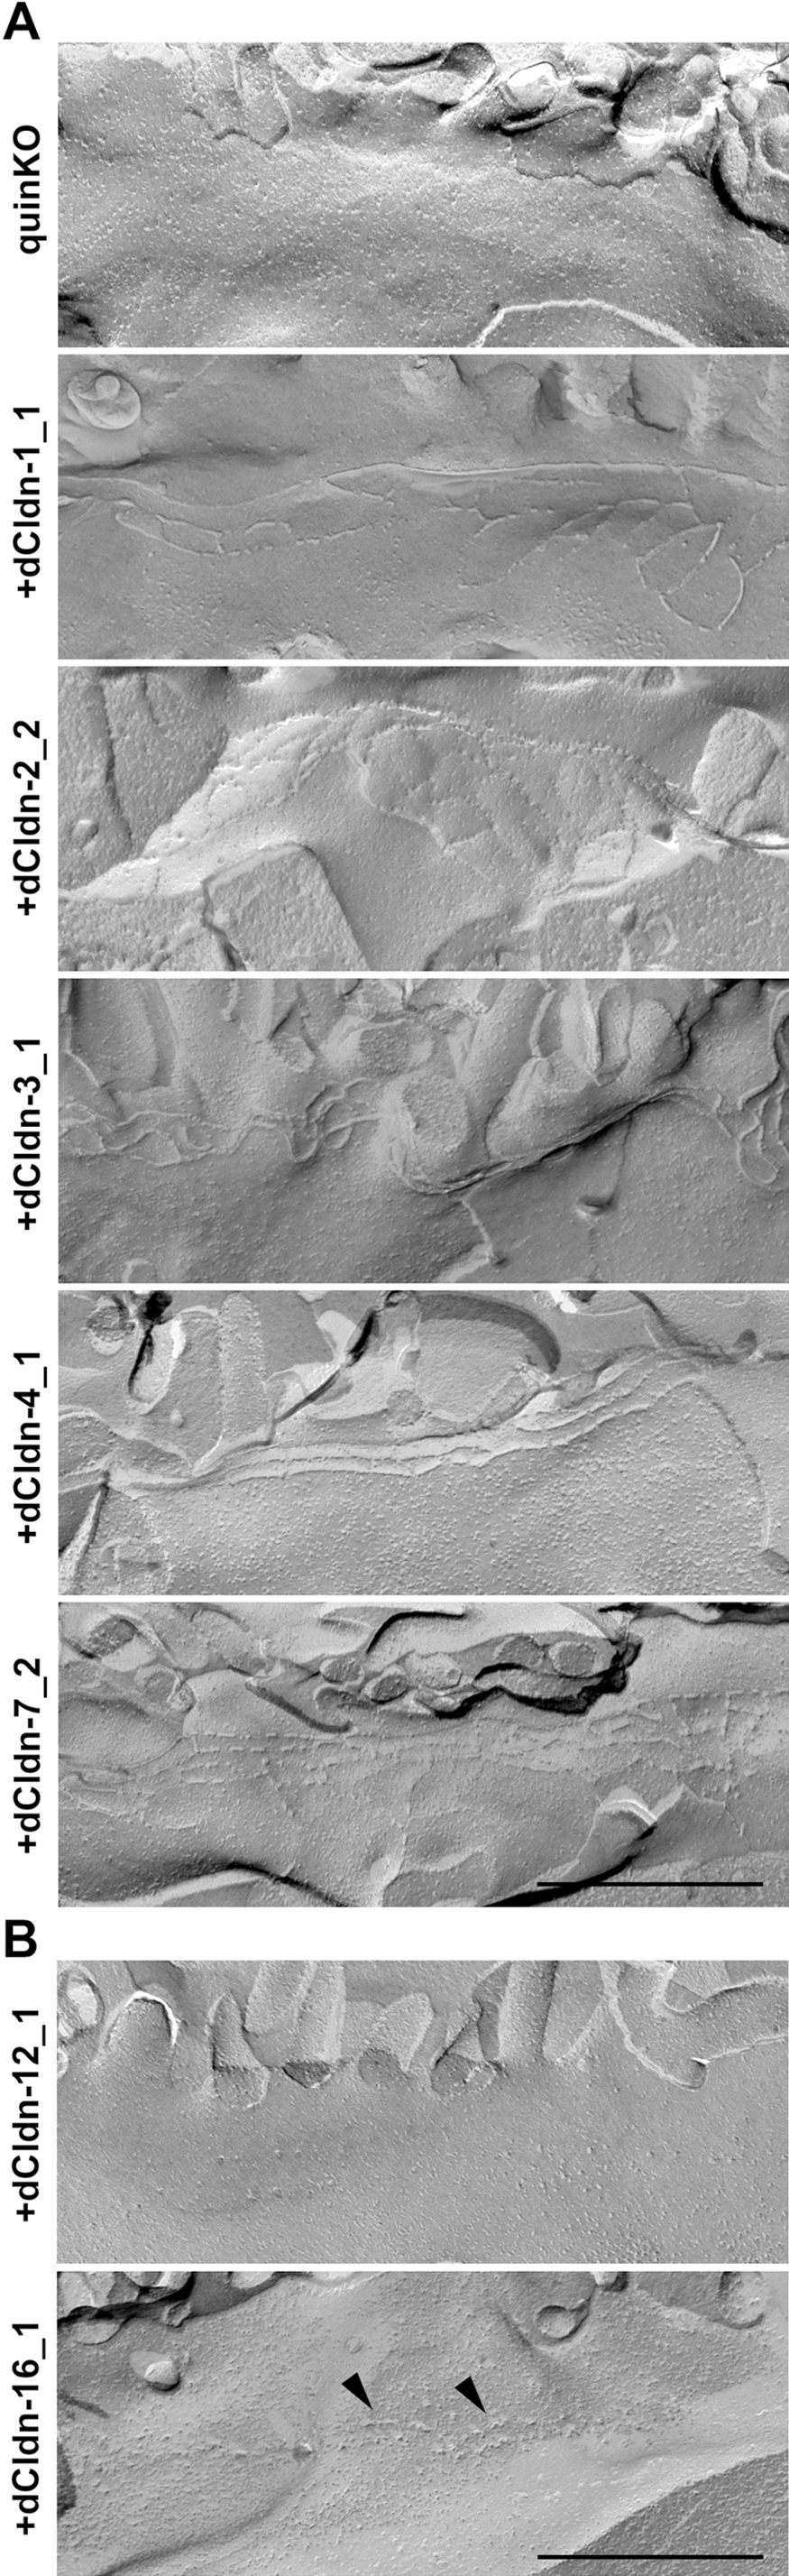
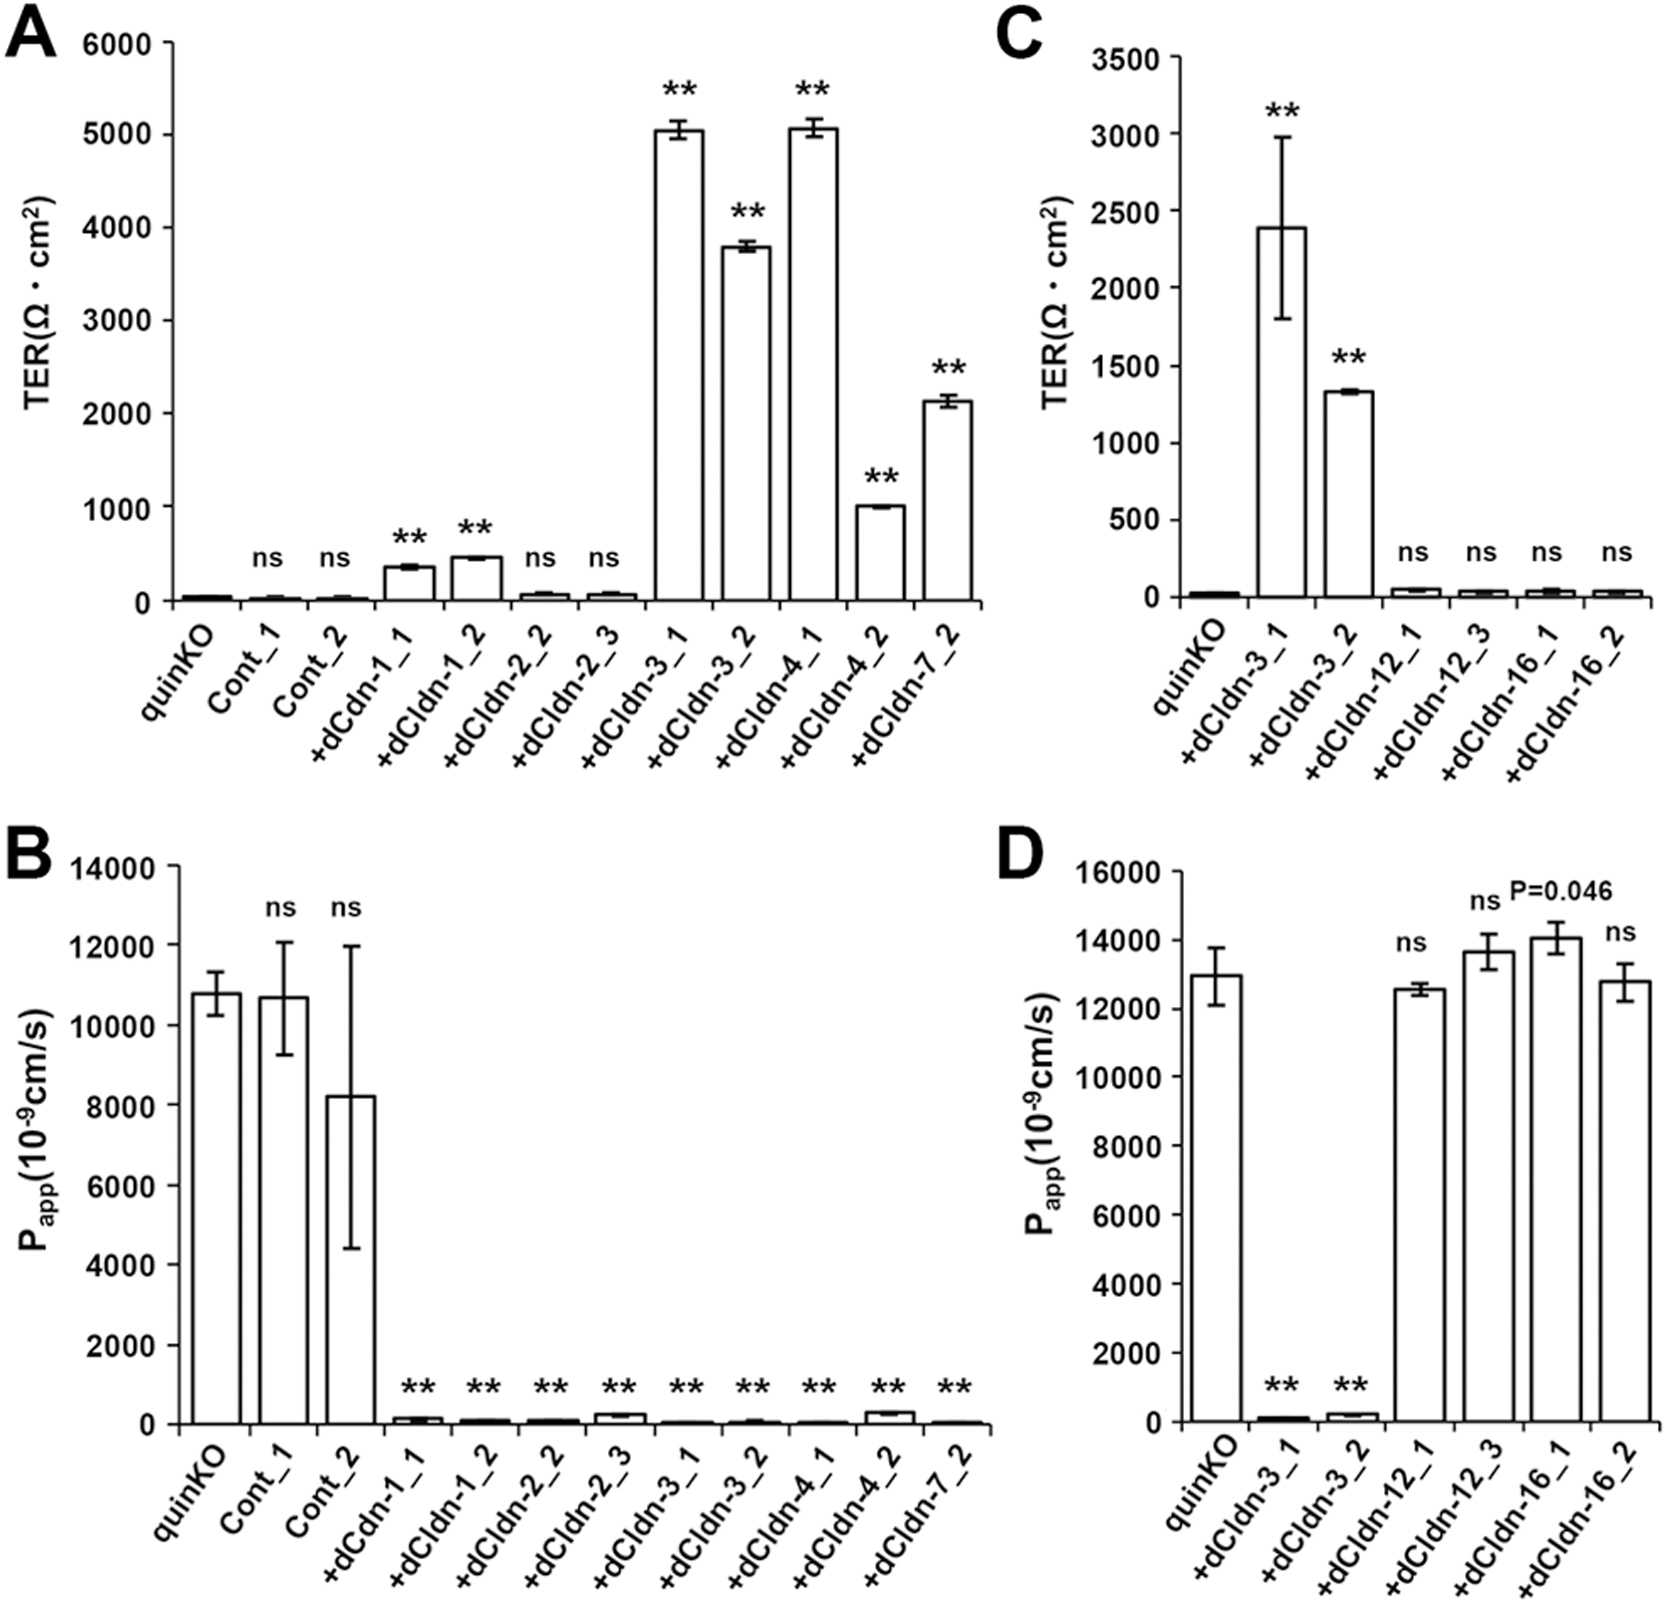
We also examined whether the claudin quinKO cells overexpressing dog claudin-12 or claudin-16 have TJs. In freeze-fracture replica electron microscopy, neither TJ strand-like fibrils on the P-face nor grooves on the E-face were found in these cells, while stepping stone-like structures were often observed along the most apical part of the lateral membrane in claudin-16-expressing cells (Fig. 5B). Consistently, neither claudin-12-expressing nor claudin-16-expressing claudin quinKO cells showed an increase in the epithelial barrier function evaluated by TER and paracellular fluorescein flux measurements (Fig. 6C, D). These results suggest that neither claudin-12 nor claudin-16 reconstitutes functional TJs in claudin quinKO cells even when overexpressed.
Reconstitution of paracellular channels in claudin quinKO cells by individual pore-forming claudin subtypes
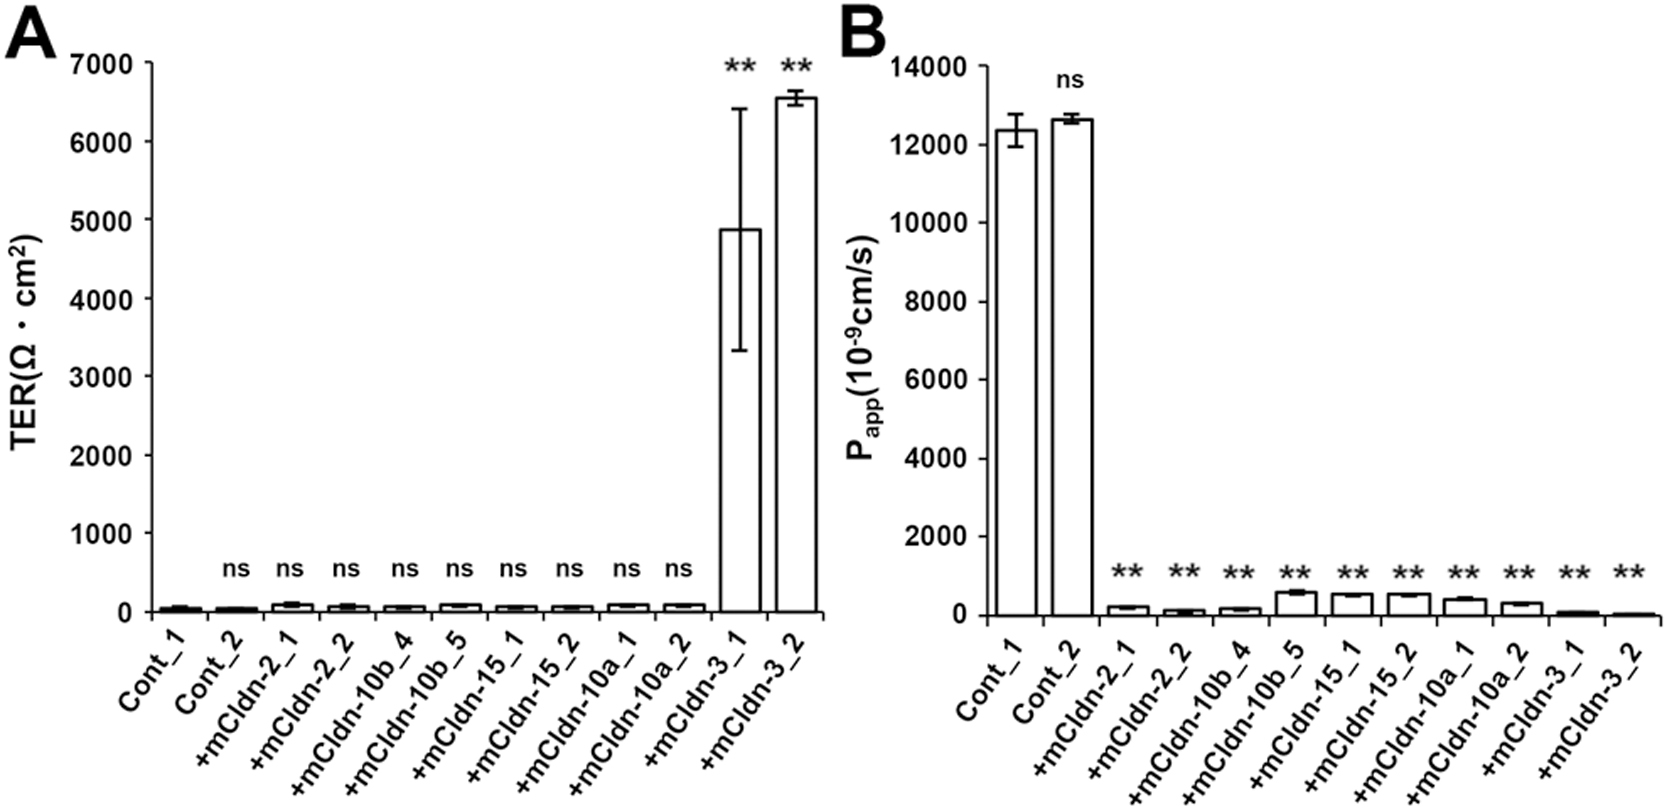
The low TER and low paracellular flux of claudin quinKO cells expressing exogenous dog claudin-2 are likely due to the cation channel property of claudin-2, suggesting that homophilic assembly of claudin-2 creates paracellular channels. To further address whether each of the pore-forming claudin subtype generates ion-selective channels by themselves, we established claudin quinKO cells stably expressing mouse claudin-2, -10b, -15 (cation selective) or -10a (anion selective) (Fig. 7A). Immunofluorescence staining revealed that all of these claudins were localized at cell–cell contacts and well overlapped with occludin in addition to localization at intracellular vesicles (Fig. 7B). TER measurements revealed that the claudin quinKO cells expressing each of claudin-2, -10b, -15 or -10a showed low TER similar to that of claudin quinKO cells (Fig. 8A). On the other hand, paracellular fluorescein flux of the claudin quinKO cells expressing each of these pore-forming claudin subtypes showed highly reduced paracellular flux compared with claudin quinKO cells (Fig. 8B). These results suggest that the claudin quinKO cells expressing each of mouse claudin-2, -10b, -15 or -10a reconstituted continuous TJs with paracellular channel properties.

To investigate their channel properties in more detail, we measured electrophysiological parameters, including transepithelial conductance and dilution potential, of the claudin quinKO cells expressing claudin-2, -10b, -15, or -10a in Ussing chambers (Fig. 9). Cells containing TJs with an ion channel property were expected to show not only moderately reduced transepithelial conductance compared to claudin quinKO cells, but also remarkably increased dilution potential. In our dilution potential experiment, the potential difference was measured upon diluting the apical side of the cell layer with a solution containing half the concentration of NaCl (75 mM) compared to the basolateral side (150 mM). Thus, TJs containing cation-selective channels or anion-selective channels should have shown a negative or positive dilution potential, respectively. As shown in Fig. 9A, transepithelial conductance decreased in all the claudin quinKO cells expressing claudin-2, -10b, -15, or -10a compared to claudin quinKO cells. Furthermore, a negative dilution potential was observed in the cells expressing claudin-2, -10b or -15, while a positive dilution potential was observed in the cells expressing claudin-10a (Fig. 9B). These results suggest that TJs formed with claudin-2, claudin-10b or claudin-15 have a paracellular cation channel property, while those formed with claudin-10a have a paracellular anion channel property. To analyze the channel properties in more detail, ion selectivity (PNa/PCl) was calculated from the dilution potential using the Goldman-Hodgkin-Katz equation. Comparing the diffusion coefficient (molar ionic conductivity) of Na+ and Cl– in solution, Na+ mobility is 50.11 Scm2eq–1and Cl– mobility is 75.23 Scm2eq–1 (Marlon and Lando, 1974). Thus, the ratio of PNa/PCl through a simple pore without charge selectivity is 0.66, and TJs containing cation-selective pores or anion-selective pores show PNa/PCl>0.66 or PNa/PCl<0.66, respectively. Based on this criterion, claudin-2, -10b and -15-expressing cells showed cation selectivity (PNa/PCl>0.66) (Fig. 9C), while claudin-10a-expressing cells showed anion selectivity (PNa/PCl<0.66) (Fig. 9C, D), consistent with previous reports (Tamura et al., 2011; Yu et al., 2009; Van Itallie et al., 2006). Claudin quinKO cells have a PNa/PCl of about 1 (Fig. 9C, D), meaning these cells basically show no permselectivity for cations or anions, which could be due to the large pore size of JAM-A-mediated cell–cell contacts lacking claudin-based TJs (Otani et al., 2019). Claudin-2-expressing cells showed larger PNa/PCl than claudin-15-expressing cells revealed by the significant difference in the dilution potential between them (Fig. 9C). These results demonstrate that the expression of only a single claudin subtype is sufficient to reconstitute a charge-selective paracellular ion channel at TJs.

Discussion
Characterization of claudin quinKO cells
In this study, we used claudin quinKO cells as TJ-competent epithelial cells to reconstitute TJs of individual claudin subtypes. We have reported recently that exogenous mouse claudin-3 reconstituted functional TJs with high TER and low paracellular fluorescein flux in claudin quinKO cells (Fujiwara et al., 2022). Here, we further showed that each claudin subtype deleted from MDCK II cells during the establishment of claudin quinKO cells, including dog claudin-1, -2, -3, -4, and -7, reconstitutes functional TJs when exogenously expressed under a strong promotor in claudin quinKO cells. However, RNA-seq analysis revealed that a significant amount of claudin-12 and claudin-16 were still expressed in claudin quinKO cells. After careful examination of claudin-12 and claudin-16 proteins, we showed the following. First, endogenous claudin-12 and claudin-16 could neither be detected at cell–cell contacts in MDCK II cells nor in claudin quinKO cells by immunofluorescence staining. Second, in the reconstitution of TJs in claudin quinKO cells due to the introduction of claudin-1, -2, -3, -4, or -7, neither endogenous claudin-12 nor claudin-16 could be detected at the TJ region by immunofluorescence staining. Third, exogenous overexpression of claudin-12 or claudin-16 did not result in the reconstitution of TJs in claudin quinKO cells with their concentrated localization at cell–cell contacts. These results suggest that we can neglect possible incorporation of endogenous claudin-12 and -16 into reconstituted TJs formed by exogenous claudins in claudin quinKO cells. Thus, we conclude that claudin quinKO cells are useful as TJ-competent epithelial cells. Furthermore, our observations suggest that there are claudin subtypes that cannot generate TJ strands in epithelial cells by themselves, such as claudin-12 and claudin-16. Consistently, neither claudin-12 nor claudin-16 was able to generate TJ strand-like structures when overexpressed in non-epithelial cells (Gonschior et al., 2022). Because it was reported that claudin-16 and claudin-19 cooperatively generate TJs through their interaction with each other (Hou et al., 2008), endogenous claudin-16 would be likely to be incorporated into TJs reconstituted by claudin-19 in claudin quinKO cells. It may also possible for claudin-12 to be recruited to TJs by a partner claudin subtype, the identity of which, however, is still unknown. In this sense, further deletion of claudin-12 and -16 genes in claudin quinKO cells would provide more appropriate TJ-competent epithelial cells.
Reconstitution of TJs with individual claudin subtypes in claudin quinKO cells
Among the claudin quinKO cells expressing dog claudin-1, -2, -3, -4, or -7, only claudin-2-expressing cells showed low TER. This is consistent with claudin-2 being a pore-forming claudin with cation selectivity (Amasheh et al., 2002). In contrast, the cells expressing claudin-1, -3, -4, or -7 showed high TER, demonstrating that they are barrier-forming claudins. These results are consistent with our previous study in which MDCK II cells with a deletion of the claudin-2 gene showed high TER with clearer localizations of claudin-1, -3, -4, and -7 at cell–cell contacts (Tokuda and Furuse, 2015). Among the cells expressing claudin-1, -3, -4 or -7 used in this study, the TER values of the claudin-1-expressing cells were relatively low compared to the others. To date, variations in the barrier properties between barrier-forming claudin subtypes have not been demonstrated. Further quantitative analyses of the complexity of TJ strands and epithelial barrier function between these cells would clarify functional differences between barrier-forming claudins. The TER values varied between two clones of the dog claudin-4-expressing cells although the expression levels of claudin-4 were comparable. This may be due to heterogenous expression of exogenous claudin-4 or the loss of the transgene in a small number of the cells during propagation, which should be considered as a technical limitation in these types of experiments.
Our study demonstrated that claudin-4 or claudin-7 alone creates TJs possessing a strong barrier function with high TER, i.e. low conductance, although the barrier/channel property of these claudins is still debatable. Claudin-4 was originally reported as a claudin subtype with a barrier-forming property when overexpressed in MDCK II cells (Van Itallie et al., 2001). However, RNAi-mediated knockdown of claudin-4 in a cortical collecting duct cell line M1 and an inner medullar collecting duct cell line mIMCD3 increased TER, i.e. decreased ion permeability, and these studies suggested an anion-preferring channel property of claudin-4 (Hou et al., 2010). Knockouts of claudin-4 in MDCK I cells (Shashikanth et al., 2022), MDCK II cells, and claudin-2-deleted MDCK II cells (Tokuda et al., 2017) did not influence the barrier properties. Similarly, it was reported that overexpression of claudin-7 in LLC-PK1 cells increased TER with a decrease in the paracellular conductance of Cl– and an increase in the paracellular conductance of Na+ (Alexandre et al., 2005), while knockdown studies of claudin-7 in MDCK II cells and LLC-PK1 cells indicated a role for claudin-7 as a barrier to Na+ and a channel to Cl–, respectively (Hou et al., 2006). These contradictory results appear to be attributed to the variations in different cell systems used, which express unique sets of endogenous claudins (Van Itallie et al., 2003; Krug et al., 2012a).
It was reported that the interaction of claudin-4 with claudin-8 is necessary for the localization of claudin-4 at TJs (Hou et al., 2010). Furthermore, two recent studies described that claudin-4 alone could not generate TJ strand-like structures when expressed in non-epithelial cells (Gonschior et al., 2022; Shashikanth et al., 2022). In contrast, claudin-4 reconstituted functional TJs in claudin quinKO cells in this study. However, whether the amount of claudin-4 or another unknown mechanism underlies the discrepancies between these studies, remains unknown. In regard to the specific function of claudin-4, it has been reported that claudin-4 negatively regulates claudin-2 function in MDCK I cells by destabilizing claudin-2-based TJs via a previously unrecognized mechanism, designated as “interclaudin interference” (Shashikanth et al., 2022). Reconstitution of TJs co-expressing claudin-2 and claudin-4 or their mutants in claudin quinKO cells may provide a useful experimental system to further examine the detailed mechanism of interclaudin interference.
We also demonstrated that individual pore-forming claudin subtypes, including mouse claudin-2, -10b, -15, and -10a create paracellular channels by themselves, i.e. via their homophilic assembly. The ion selectivity of the claudin quinKO cells expressing each of these claudins was consistent with previous reports on the characterization of their channel properties (Yu et al., 2009; Tamura et al., 2011; Van Itallie et al., 2006). In addition, we showed that these pore-forming claudins create barriers against fluorescein. These results are consistent with a recent study on claudin quinKO cells expressing human claudin-2, -15, and -10a conducted in parallel with this study (Gonschior et al., 2022). Furthermore, super-resolution microscopy demonstrated that claudin-2 and claudin-10a are segregated as patches but constitute continuous TJ strands overall in proximal tubules, suggesting that these pore-forming claudins assemble in a homophilic manner in vivo (Gonschior et al., 2022). Notably, the claudin-2-expressing cells showed larger PNa/PCl than the claudin-15-expressing cells. This difference may be caused by a different degree of the cation selectivity between claudin-2 and -15, but the detailed mechanism should be investigated in future studies.
Utilities of claudin quinKO cells in TJ research
By using claudin quinKO cells as TJ-competent epithelial cells, the barrier/channel properties of claudin-based TJs can be further investigated. Morphology of TJs as well as the barrier function of TJs evaluated by measurements of TER and paracellular flux may vary depending on individual claudins. A certain combination of multiple claudin subtypes may synergistically create a structure and barrier of the TJs that cannot be explained by a simple sum of the properties of the individual claudins. These possibilities should be examined in the future by reconstituting TJs containing certain combinations and proportions of claudin subtypes in claudin quinKO cells. Furthermore, the paracellular permeability of epithelia to which electrophysiological measurements cannot be applied due to their sizes or structures may be reconstituted in claudin quinKO cells and investigated by mimicking their expression pattern of claudin subtypes. These types of studies will contribute to the understanding of the mechanism of epithelial transport in various epithelia.
Claudin quinKO cells are also useful for functional analyses of claudin molecules. Claudins undergo various types of post-translational modifications, such as phosphorylation, palmitoylation, and ubiquitination (Shigetomi and Ikenouchi, 2018). Each modification is expected to modify the behavior of claudins and control their functions (Shigetomi and Ikenouchi, 2018). However, the physiological relevance of each modification has not been fully understood yet. To clarify the role of these post-translational modifications, it is common to examine the behaviors of mutant claudins in which the amino acids susceptible to each modification are replaced with other amino acids. When these mutant claudins are expressed in cultured epithelial cells with TJs, they may be incorporated into TJs due to their interaction with endogenous claudins regardless of the influence of the mutations, so that the function or role of the post-translational modifications may be masked. Introduction of these mutant claudins into claudin quinKO cells will enable us to examine the effects of these post-translational modifications of claudins in TJ formation and function directly.
Materials and Methods
Cell and antibodies
MDCK II cells were provided by Dr. Masayuki Murata (Tokyo Institute of Technology). Claudin quinKO cells and claudin quinKO cell clones expressing mouse claudin-3 were established and characterized previously (Fujiwara et al., 2022; Otani et al., 2019). Cells were cultured in Dulbecco’s modified Eagle’s medium (#05919; Nissui) supplemented with 10% fetal calf serum and 2 mM L-glutamine.
The following antibodies were purchased from Thermo Fisher Scientific: rabbit polyclonal anti-claudin-1 (#51-9000); mouse monoclonal anti-claudin-2 (clone 12H12, #32-5600); rabbit polyclonal anti-claudin-3 (#34-1700), mouse monoclonal anti–claudin-4 (clone 3E2C1, #32-9400); rabbit polyclonal anti-claudin-7 (#34-9100); mouse monoclonal anti-α-tubulin (clone DM1A, #62204). The following antibodies were raised and characterized as described previously: rabbit anti-claudin-2 (Morita et al., 1999); rabbit polyclonal anti-claudin-10 (Kiuchi-Saishin et al., 2002); rabbit polyclonal anti-claudin-15 (Kiuchi-Saishin et al., 2002); rabbit anti-claudin-16 (Kiuchi-Saishin et al., 2002); rat monoclonal anti-occludin (clone MOC37; (Saitou et al., 1997)); mouse monoclonal anti–ZO-1 (clone T8-754; (Itoh et al., 1991)). Rabbit anti-claudin-12 antibody (Fujita et al., 2006) was kindly provided by Hideki Chiba at Fukushima Medical University. The following secondary antibodies were used: donkey anti-mouse IgG Alexa Fluor 488-conjugated (#A21202; Molecular Probes); donkey anti-rat IgG Alexa Fluor 488-conjugated (#A21208; Molecular Probes); donkey anti-rabbit IgG Alexa Fluor 488-conjugated (#A21206; Molecular Probes); donkey anti-mouse IgG Cy3-conjugated (#715-165-151; Jackson ImmunoResearch Laboratories); donkey anti-rat IgG Cy3-conjugated (#712-165-153; Jackson ImmunoResearch Laboratories); donkey anti-rabbit IgG Cy3-conjugated (#711-165-152; Jackson ImmunoResearch Laboratories). HRP-linked anti-rabbit, anti-mouse, or anti-rat IgG used for immunoblotting was purchased from GE Healthcare.
Expression vectors and transfection
Expression vectors for dog claudin-2 and claudin-3, pCdCL2 and pCdCL3, respectively, were constructed as previously reported (Furuse et al., 2001). Dog claudin-1 and claudin-4 cDNAs were cloned as previously described (Furuse et al., 2001). Briefly, PCR primers of 30 bases were synthesized according to the nucleotide sequence of the open reading frame of mouse claudin-1 and claudin-4, and their cDNA fragments were amplified by PCR. Using each of the DNA fragments as a hybridization probe, a λgt11 dog liver cDNA library (Clontech Laboratories, Inc.) was screened, and the obtained cDNA fragments containing the ORF of claudin-1 or claudin-4 were cloned into pBluescript SK(–). The full-length ORFs were amplified by PCR using KOD-Plus-Ver.2 DNA polymerase (TOYOBO) and subcloned into a mammalian expression vector, pCAGGS containing a neomycin-resistant gene (Niwa et al., 1991). To clone the cDNAs of dog claudin-7, claudin-12, and claudin-16 cDNAs, a cDNA library was synthesized from the total RNA of MDCK cells isolated according to a previously described method (Chomczynski and Sacchi, 1987) by reverse transcription using Superscript IITM reverse transcriptase (GIBCO BRL). Using this cDNA library as a template, claudin-7, claudin-12, and claudin-16 cDNAs containing their full-length ORFs were amplified by PCR using KOD-Plus-Ver.2 DNA polymerase (TOYOBO) and subcloned into pCAGGS containing a neomycin-resistant gene. To construct expression vectors for mouse claudin-10a, claudin-10b, and claudin-15, their cDNAs obtained in our previous studies (Kiuchi-Saishin et al., 2002) were subcloned into pCAGGS.
DNA transfection was performed using the Lipofectamine LTX and Plus Reagent (Thermo Fisher Scientific) according to the manufacturer’s instructions. After transfection, cells were cultured in the medium containing 300 μg/ml G-418 (Nacalai Tesque) for 12 days. The G-418-resistant cell clones were isolated and screened by immunofluorescence staining to check the expression of each claudin.
Immunofluorescence staining
Cells cultured on coverslips to confluence were fixed with 1% paraformaldehyde in PBS containing 0.5 mM CaCl2 for 15 min at RT or with 10% TCA in PBS for 30 min on ice. Cells were rinsed with PBS, and permeabilized with 0.2% Triton X-100 in PBS for 15 min at RT. After being rinsed with PBS, cells were blocked with 1% BSA in PBS for 30 min at RT, and incubated with primary antibodies diluted with the blocking solution for 30 min at RT. After three washes with PBS, cells were incubated with secondary antibodies diluted with the blocking solution for 30 min at RT. After three washes with PBS, cells on coverslips were mounted on slide glasses using FluoroSave Reagent (#345789; Calbiochem). The samples were observed with an inverted fluorescence microscope (IX70; Olympus) equipped with an UPlanSApo 40×/0.95 NA objective and a digital CMOS camera (ORCA-Flash 4.0; Hamamatsu Photonics K.K.). Images were processed using Adobe Photoshop software (Adobe).
Western blotting
For Western blotting of cell lysates, cells were lysed with Laemmli SDS sample buffer supplemented with 100 mM DTT and incubated at 95°C for 5 min. The proteins were separated by SDS-PAGE using a 10%, 12.5%, or 15% polyacrylamide gel and transferred to polyvinylidene fluoride membrane with a 0.45-μm pore size (EMD Millipore). The membranes were blocked with 5% skim milk in Tris-buffered saline supplemented with 0.1% Tween 20 (TBS-T) and incubated with primary antibodies diluted with 5% skim milk in TBS-T for 30 min at RT. After the incubation, the membranes were washed three times with TBS-T, followed by incubation of HRP-linked secondary antibodies diluted with 5% skim milk in TBS-T for 30 min at RT. After the membranes were rinsed three times with TBS-T, the secondary antibodies were detected by chemiluminescent reactions of peroxidase substrate using ECL (ECL Prime; GE Healthcare). The luminous signals were obtained with a LAS3000 Mini imager (Fujifilm) and processed using Photoshop software (Adobe).
Freeze-fracture replica electron microscopy
Except for some modifications in cell culture conditions, freeze-fracture replicas were produced using a method described previously (Fujiwara et al., 2022). 4 × 10⁵ cells were plated and cultured on Transwell poly-carbonate filters with 0.4-μm pore size (#3401; Corning). After 6 days of culture, cells were fixed with 2% glutaraldehyde in 0.1 M phosphate buffer (PB), pH 7.4, at 4°C overnight. The fixed cells were removed from the filters with scalpels, cryoprotected with 30% glycerol in 0.1 M PB at 4°C overnight, and then rapidly frozen in between two copper carriers by using a high-pressure freezing machine (HPM010, BAL-TEC, Balzers, Liechtenstein). The cells were fractured by separating the two carriers at –120°C and then replicated with platinum (45° unidirectional from horizontal level, 2 nm thick) and carbon (20 nm thick) in a freeze-fracture replica machine (BAF060, BAL-TEC). The replicated materials were transferred to glass vials filled with a solution containing kitchen bleach (50%) and incubated on a reciprocal shaker until cell debris was removed from the replicas. The replicas were washed twice with distilled water and transferred to grids coated with pioloform (Agar Scientific) for transmission electron microscope observation. The samples were observed with a JEM1010 transmission EM (JEOL) at 100 kV accelerating voltage. Images were captured with a Veleta CCD camera using iTEM software (Olympus Soft Imaging Solutions).
Measurements of TER and paracellular flux
1 × 10⁵ cells were seeded on 12-mm-diameter Transwell polycarbonate filters with 0.4-μm pore size (#3401; Corning) and cultured for 4–5 days. The medium was changed to phenol red-free DMEM (08489-45; Nacalai Tesque) supplemented with 10% fetal calf serum and 2 mM L-glutamine. On the following day, TER and paracellular flux were measured. Electrical resistance was measured using Millicell ERS (Merck Millipore). As a blank, the electrical resistance of Transwell filters without cells was measured. The mean blank value was subtracted from the electrical resistance of the filters with cells, and TER was determined by multiplying the electrical resistance by the growth area of the Transwell filter. To measure paracellular tracer flux, the filters with cells were moved to 12 well culture plates with 1 ml of the phenol red-free medium in each well. Then the medium in the upper chamber was replaced with 250 μl of 200 μM fluorescein (16106-82; Nacalai Tesque) in the phenol red-free medium. After cells were incubated for 2 h at 37°C and 5% CO2, the medium of the lower chamber was collected, and the fluorescence intensity of the medium was measured by a microplate reader (SpectraMax Paradigm; Molecular Devices). The fluorescence intensity of the medium without a fluorescent tracer was measured as a blank. After subtraction of the mean blank values from fluorescence intensities of the samples, the apparent permeability (Papp) was calculated using the following equation: Papp = (dQ/dt)/ACo (dQ is the amount of tracer transported to the basal chamber, dt is incubation time, A is the area of the Transwell filters, and Co is the initial concentration of tracer in the apical chamber). Graphs were generated using Excel. Statistical tests were performed using R software (The R Foundation).
Ussing chamber electrophysiological studies
Ussing chamber methods are the same as those described previously (Hempstock et al., 2021). Cells were cultured to confluent on 12-mm-diameter Transwell polycarbonate filters with 0.4-μm pore size (#3401; Corning). Filters were cut from transwell inserts using a scalpel. The filter was then mounted vertically in Ussing chambers with an internal circular window with a diameter of 2 or 3 mm. The chambers were filled with standard HEPES buffer (10 mM HEPES pH 7.4, 150 mM NaCl, 1 mM MgCl2, 2 mM CaCl2, 10 mM Glucose) and maintained with gassing with 100% O2 at 37°C. Electrical parameters were measured under open-circuit conditions and Ohm’s law was used to calculate transepithelial conductance (Gt). To measure the dilution potential, the buffer on the apical side was replaced with the above HEPES buffer containing 75 mM NaCl and 150 mM mannitol. The relative permeabilities of Na+ and Cl– were calculated by the Goldman-Hodgkin-Katz equation (Yu et al., 2009). As a blank, a filter without any cells was mounted in the chamber and the membrane potential difference upon dilution was used as a blank to correct for contribution of the filter to the measured dilution potential in the cells.
RNA-seq analyses
Total RNAs were isolated from claudin quinKO cells by using RNeasy Mini Kit according to the manufacturer’s instruction (QIAGEN). Preparation of cDNA libraries from the total RNAs and RNA-seq of cDNA libraries was performed using TruSeq Stranded mRNA LT Sample Prep Kit (Illumina) and Illumina platform. cDNA fragments obtained from RNA-seq were mapped to a reference genome, and GCF_000002285.3 was used as the reference genome. In order to normalize gene expression in each sample after mapping, trimmed mean of M-values normalization with edgeR R library was performed, and after the FPKM and the TPM of each gene were subsequently calculated. These experiments were performed by Macrogen Japan excluding total RNA extraction.
Analysis of RNA-seq data
We first calculated the log2-transformed TPM and FPKM values of each gene in claudin quinKO cells, and density plots of log2-transformed TPM and FPKM values excluding 0 were made based on the calculated results. These analyses were performed using R software version 4.1.0 and Microsoft Excel version 16.65, respectively. Next, we calculated the values of TPM and FPKM which are estimated to have more than five times the rate of active genes compared to inactive genes. This analysis was performed using the characteristic that the density plot of log2-transformed TPM and FPKM values derived from RNA-seq analysis approximate a mixed gaussian distribution consisting of two gaussian distributions of active and inactive gene (Hart et al., 2013; McGowan et al., 2021). Also, the calculations for this analysis were performed using the R software and Perl version 5.18.4. Genes with a higher value than the calculated value were determined to be active genes.
Acknowledgments
We thank Hideki Chiba of Fukushima Medical University for the anti-claudin-12 antibody. We thank Mika Watanabe of NIPS for her technical assistance in the establishment of all the cell lines used in this study. We also thank Takako Maegawa and Hitoshi Takagi of the Life Science Innovation Center at the University of Fukui for their technical assistance in the preparation of freeze-fracture replicas. We thank Motohiro Nishita of NIPS for use of microplate reader. We appreciate Dorothee Günzel of Charité reading the manuscript and giving us valuable comments. We thank all the members of Furuse laboratory for their helpful discussions. This work was supported by JSPS KAKENHI (16K15226, Grant-in-Aid for Challenging Exploratory Research to MF; 21H02523, Grants-in-Aid for Scientific Research (B) to MF; 16H06280, Grant-in-Aid for Scientific Research on Innovative Areas—Platforms for Advanced Technologies and Research Resources “Advanced Bioimaging Support” to YF).
References
- Alexandre, M.D., Lu, Q., and Chen, Y.H. 2005. Overexpression of claudin-7 decreases the paracellular Cl– conductance and increases the paracellular Na+ conductance in LLC-PK1 cells. J. Cell Sci., 118: 2683–2693.
- Amasheh, S., Meiri, N., Gitter, A.H., Schöneberg, T., Mankertz, J., Schulzke, J.D., and Fromm, M. 2002. Claudin-2 expression induces cation-selective channels in tight junctions of epithelial cells. J. Cell Sci., 115: 4969–4976.
- Anderson, J.M. and Van Itallie, C.M. 2009. Physiology and function of the tight junction. Cold Spring Harb. Perspect. Biol., 1: a002584.
- Chomczynski, P. and Sacchi, N. 1987. Single-step method of RNA isolation by acid guanidinium thiocyanate-phenol-chloroform extraction. Anal. Biochem., 162: 156–159.
- Colegio, O.R., Van Itallie, C.M., McCrea, H.J., Rahner, C., and Anderson, J.M. 2002. Claudins create charge-selective channels in the paracellular pathway between epithelial cells. Am. J. Physiol. Cell Physiol., 283: 142–147.
- Fujita, H., Chiba, H., Yokozaki, H., Sakai, N., Sugimoto, K., Wada, T., Kojima, T., Yamashita, T., and Sawada, N. 2006. Differential expression and subcellular localization of claudin-7, -8, -12, -13, and -15 along the mouse intestine. J. Histochem. Cytochem., 54: 933–944.
- Fujiwara, S., Nguyen, T.P., Furuse, K., Fukazawa, Y., Otani, T., Furuse, M. 2022. Tight junction formation by a claudin mutant lacking the COOH-terminal PDZ domain-binding motif. Ann. N.Y. Acad. Sci., 1516: 85–94. doi: 10.1111/nyas.14881.
- Furuse, M., Fujita, K., Hiiragi, T., Fujimoto, K., and Tsukita, S. 1998a. Claudin-1 and -2: Novel integral membrane proteins localizing at tight junctions with no sequence similarity to occludin. J. Cell Biol., 141: 1539–1550.
- Furuse, M., Sasaki, H., Fujimoto, K., and Tsukita, S. 1998b. A single gene product, claudin-1 or -2, reconstitutes tight junction strands and recruits occludin in fibroblasts. J. Cell Biol., 143: 391–401.
- Furuse, M., Sasaki, H., and Tsukita, S. 1999. Manner of interaction of heterogeneous claudin species within and between tight junction strands. J. Cell Biol., 147: 891–903.
- Furuse, M., Furuse, K., Sasaki, H., and Tsukita, S. 2001. Conversion of zonulae occludentes from tight to leaky strand type by introducing claudin-2 into Madin-Darby canine kidney I cells. J. Cell Biol., 153: 263–272.
- Furuse, M. and Tsukita, S. 2006. Claudins in occluding junctions of humans and flies. Trends Cell Biol., 16: 181–188.
- Gonschior, H., Schmied, C., van der Veen, R.E., Eichhorst, J., Himmerkus, N., Piontek, J., Günzel, D., Bleich, M., Furuse, M. Haucke, V., and Lehmann, M. 2022. Nanoscale segregation of channel and barrier claudins enables paracellular ion flux. Nat. Commun., 13: 4985.
- Günzel, D., Stuiver, M., Kausalya, P.J., Haisch, L. Krug, S.M., Rosenthal, R., Meij, I.C. Hunziker, W., Fromm, M., and Müller, D. 2009. Claudin-10 exists in six alternatively spliced isoforms that exhibit distinct localization and function. J. Cell Sci., 122: 1507–1517.
- Günzel, D. and Yu, A.S.L. 2013. Claudins and the modulation of tight junction permeability. Physiol. Rev., 93: 525–569.
- Hart, T., Komori, H.K., LaMere, S., Podshivalova, K., and Salomon, D.R. 2013. Finding the active genes in deep RNA-seq gene expression studies. BMC Genomics, 14: 778.
- Hempstock, W., Ishizuka, N. and Hayashi, H. 2021. Functional assessment of intestinal tight junction barrier and ion permeability in native tissue by ussing chamber technique. J. Vis. Exp., 171. doi: 10.3791/62468.
- Hou, J., Gomes, A.S., Paul, D.L., and Goodenough, D.A. 2006. Study of claudin function by RNA interference. J. Biol. Chem., 281: 36117–36123.
- Hou, J., Renigunta, A., Konrad, M., Gomes, A.S., Schneeberger, E.E., Paul, D.L., Waldegger, S., and Goodenough, D.A. 2008. Claudin-16 and claudin-19 interact and form a cation-selective tight junction complex. J. Clin. Invest., 118: 619–628.
- Hou, J., Renigunta, A., Yang, J., and Waldegger, S. 2010. Claudin-4 forms paracellular chloride channel in the kidney and requires claudin-8 for tight junction localization. Proc. Natl. Acad. Sci. USA, 107: 18010–18015.
- Van Itallie, C., Rahner, C., and Anderson, J.M. 2001. Regulated expression of claudin-4 decreases paracellular conductance through a selective decrease in sodium permeability. J. Clin. Investn., 107: 1319–1327.
- Van Itallie, C.M., Fanning, A.S., and Anderson, J.M. 2003. Reversal of charge selectivity in cation or anion-selective epithelial lines by expression of different claudins. Am. J. Physiol. Renal. Physiol., 285: 1078–1084.
- Van Itallie, C.M., Rogan, S., Yu, A., Vidal, L.S., Holmes, J., and Anderson, J.M. 2006. Two splice variants of claudin-10 in the kidney create paracellular pores with different ion selectivities. Am. J. Physiol. Renal Physiol., 291: 1288–1299.
- Van Itallie, C.M. and Anderson, J.M. 2014. Architecture of tight junctions and principles of molecular composition. Semin. Cell Dev. Biol., 36: 157–165.
- Itoh, M., Yonemura, S., Nagafuchi, A., Tsukita, S., and Tsukita, S. 1991. A 220-kD undercoat-constitutive protein: Its specific localization at cadherin-based cell-cell adhesion sites. J. Cell Biol., 115: 1449–1462.
- Kiuchi-Saishin, Y., Gotoh, S., Furuse, M., Takasuga, A., Tano, Y., and Tsukita. S. 2002. Differential expression patterns of claudins, tight junction membrane proteins, in mouse nephron segments. J. Am. Soc. Nephrol., 13: 875–886.
- Krug, S.M., Günzel, D., Conrad, M.P., Lee, I.F.M., Amasheh, S., Fromm, M., and Yu, A.S.L. 2012a. Charge-selective claudin channels. Ann. N. Y. Acad. Sci., 1257: 20–28.
- Krug, S.M., Günzel, D., Conrad, M.P., Rosenthal, R., Fromm, A., Amasheh, S., Schulzke, J.D., and Fromm, M. 2012b. Claudin-17 forms tight junction channels with distinct anion selectivity. Cell Mol. Life Sci., 69: 2765–2778.
- Marlon, S.H. and Lando, J.B. 1974. Fundamentals of Physical Chemistry. Macmillian Publishing Co., Inc., New York. 519pp.
- McGowan, M.T., Zhang, Z., and Ficklin, S.P. 2021. Chromosomal characteristics of salt stress heritable gene expression in the rice genome. BMC Genom. Data, 22: 1–13.
- Milatz, S., Himmerkus, N., Wulfmeyer, V.C., Drewell, H., Mutig, K., Hou, J., Breiderhoff, T., Muller, D., Fromm, M., Bleich, M., and Gunzel, D. 2017. Mosaic expression of claudins in thick ascending limbs of Henle results in spatial separation of paracellular Na+ and Mg2+ transport. Proc. Natl. Acad. Sci. USA, 114: E219–E227.
- Mineta, K., Yamamoto, Y., Yamazaki, Y., Tanaka, H., Tada, Y., Saito, K., Tamura, A., Igarashi, M., Endo, T., Takeuchi K., and Tsukita, S. 2011. Predicted expansion of the claudin multigene family. FEBS Lett., 585: 606–612.
- Morita, K., Furuse, M., Fujimoto, K., and Tsukita, S. 1999. Claudin multigene family encoding four-transmembrane domain protein components of tight junction strands. Proc. Natl. Acad. Sci. USA, 96: 511–516.
- Niwa, H., Yamamura, K., and Miyazaki, J. 1991. Efficient selection for high-expression transfectants with a novel eukaryotic vector. Gene, 108: 193–199.
- Otani, T., Nguyen, T.P., Tokuda, S., Sugihara, K., Sugawara, T., Furuse, K. Miura, T., Ebnet, K., and Furuse, M. 2019. Claudins and JAM-A coordinately regulate tight junction formation and epithelial polarity. J. Cell Biol., 218: 3372–3396.
- Otani, T. and Furuse, M. 2020. Tight Junction Structure and Function Revisited. Trends Cell Biol., 30: 805–817.
- Saitou, M., Ando-Akatsuka, Y., Itoh, M., Furuse, M., Inazawa, J., Fujimoto, K., and Tsukita, S. 1997. Mammalian occludin in epithelial cells: its expression and subcellular distribution. Eur. J. Cell Biol., 73: 222–231.
- Shashikanth, N., France, M.M., Xiao, R., Haest, X., Rizzo, H.E., Yeste, J., Reiner, J., and Turner, J.R. 2022. Tight junction channel regulation by interclaudin interference. Nat. Commun., 13: 3780.
- Shigetomi, K. and Ikenouchi, J. 2018. Regulation of the epithelial barrier by post-translational modifications of tight junction membrane proteins. J. Biochem., 163: 265–272.
- Shukla, P., Vogl, C., Wallner, B., Rigler, D., Müller, M., and Macho-Maschler, S. 2015. High-throughput mRNA and miRNA profiling of epithelial-mesenchymal transition in MDCK cells. BMC Genomics, 16: 944.
- Staehelin, L.A. 1973. Further observations on the fine structure of freeze-cleaved tight junctions. J. Cell Sci., 13: 763–786.
- Suzuki, H., Tani, K., Tamura, A., Tsukita, S., and Fujiyoshi, Y. 2015. Model for the architecture of claudin-based paracellular ion channels through tight junctions. J. Mol. Biol., 427: 291–297.
- Tamura, A., Kitano, Y., Hata, M., Katsuno, T., Moriwaki, K., Sasaki, H., Hayashi, H., Suzuki, Y., Noda, T., Furuse, M., Tsukita, S., and Tsukita, S. 2008. Megaintestine in Claudin-15–Deficient Mice. Gastroenterology, 134: 523–534.
- Tamura, A., Hayashi, H., Imasato, M., Yamazaki, Y., Hagiwara, A., Wada, M., Noda, T., Watanabe, M., Suzuki, Y., and Tsukita, S. 2011. Loss of Claudin-15, but not claudin-2, causes Na+ deficiency and glucose malabsorption in mouse small intestine. Gastroenterology, 140: 913–923.
- Tanaka, H., Yamamoto, Y., Kashihara, H., Yamazaki, Y., Tani, K., Fujiyoshi, Y., Mineta, K., Takeuchi, K., Tamura, A., and Tsukita, S. 2016. Claudin-21 Has a Paracellular Channel Role at Tight Junctions. Mol. Cell Biol., 36: 954–964.
- Tokuda, S. and Furuse, M. 2015. Claudin-2 knockout by TALEN-mediated gene targeting in MDCK cells: Claudin-2 independently determines the leaky property of tight junctions in MDCK cells. PLoS One, 10: e0119869.
- Tokuda, S., Hirai, T., and Furuse, M. 2017. Claudin-4 knockout by TALEN-mediated gene targeting in MDCK cells: Claudin-4 is dispensable for the permeability properties of tight junctions in wild-type MDCK cells. PLoS One, 12: e0182521.
- Tsukita, S., Tanaka, H., and Tamura, A. 2019. The Claudins: From Tight Junctions to Biological Systems. Trends Biochem. Sci., 44: 141–152.
- Yu, A.S.L., Cheng, M.H., Angelow, S., Günzel, D., Kanzawa, S.A., Schneeberger, E., Fromm, M., and Coalson, R.D. 2009. Molecular basis for cation selectivity in claudin-2-based paracellular pores: Identification of an electrostatic interaction site. J. Gen. Physiol., 133: 111–127.
- Zihni, C., Mills, C., Matter, K., and Balda, M.S. 2016. Tight junctions: From simple barriers to multifunctional molecular gates. Nat. Rev. Mol. Cell Biol., 17: 564–580.
