Articles
Analysis of Glucose Uptake by Highly Metastatic Nanog-overexpressing Melanoma Cells Using Fluorescent Glucose Analogs

2024 Volume 92 Issue 2 Pages 022008

Details
2024 Volume 92 Issue 2 Pages 022008
Fluorescent glucose analogs, 2-[N-(7-nitrobenz-2-oxa-1,3-diazol-4-yl)amino]-2-deoxy-D-glucose (2-NBDG) and 2-[N-(7-nitrobenz-2-oxa-1,3-diazol-4-yl)amino]-2-deoxy-L-glucose (2-NBDLG) were applied to the detection of metastasis dependent glucose uptake and intracellular movement. The uptakes of both analogs by highly metastatic mouse melanoma cell line, Nanog+BL6 were significantly greater than those by the control cell line, BL6. Nucleus shape in Nanog+BL6, however, was not influenced by high concentration of 2-NBDLG, suggesting less active state of 2NBDLG in cells than in other cells reported elsewhere. We focused the involvement of Slc37a4 that was the top rank gene among those up-regulated by Nanog overexpression. When Slc37a4 in Nanog+BL6 was knocked down, the uptake of 2-NBDG decreased to 62 % but 2-NBDLG uptake was unchanged. This suggests that combined use of 2-NBDG and 2-NBDLG can detect intracellular glucose movement relevant to cancer cells with different metastatic potentials.
2-[N-(7-nitrobenz-2-oxa-1,3-diazol-4-yl)amino]-2-deoxy-D-glucose (2-NBDG) is a fluorescent glucose analog in which a fluorescent molecule NBD is bound at the 2nd carbon position of D-glucose.1 2-NBDG (Ex: 488 nm, Em: 540 nm) is taken into cells through glucose transporter (GLUT)-mediated pathway similar to D-glucose2 and 18F-fluorodeoxyglucose (FDG)3 and also via sodium-glucose cotransporter (SGLT).4 The antipode of 2-NBDG was also developed by introducing NBD to the 2nd carbon position of L-glucose (2-NBDLG).5 2-NBDLG can be used as the control to compensate the effects of non-specific adsorption and membrane passage of 2-NBDG. Although L-glucose is not used as an energy source by normal cells, it has been found that it is taken up by tumor cells,6,7 and new applications are expected for imaging of tumor areas. Therefore, accumulating the results of imaging analysis of D/L-glucose uptake activity for different types and stages of tumor cells and cancer cells is considered to provide important diagnostic information.
Regarding the metastasis of skin cancer melanoma, we have developed malignant melanoma model cells with high metastatic potential and are investigating the mechanism of enhanced metastatic potential.8 We developed an Nanog overexpressing melanoma cell line (Nanog+BL6) because undifferentiation state-maintaining factors such as Nanog are well correlated with cancer malignancy.9 Transcriptome analysis revealed the up-regulated and down-regulated genes in Nanog+BL6 as compared to BL6. Slc37a4 was the top up-regulated gene, followed by mitochondrial oxidative phosphorylation-related genes such as mt-Atp6, mt-Nd3, mt-Co3, mt-Atp8, and mt-Co2. Slc37a4 is a transporter located in the endoplasmic reticulum (ER) membrane that transports glucose-6-phosphate (G6P) from the cytoplasm to the ER. Glucose taken into cells is 6-phosphorylated to become G6P, which is transported to the ER, dephosphorylated, and then released outside the cell.10 It is thought that cells act like a pump to supply glucose in response to extracellular glucose deficiency. In other words, it is thought that it contributes to glucose replenishment to the cells in the center of the cancer colony as it grows.
This study is aimed at the comparative analysis of fluorescent glucose uptake activities in melanoma cell lines with different metastatic potential. Based on the results, we will discuss the correlation between metastatic potential and glucose uptake activity.
F1 is a non-metastatic melanoma cell line and BL6 is a metastatic melanoma cell line. Both cell lines are wild type. Nanog+BL6 is a high metastatic melanoma cell line developed by the authors.8 NIH3T3 is a cell line established from normal fibroblasts and obtained from RIKEN Bioresource Center. Melanoma cells were cultured in R10 medium maintained at 37 °C under 5 % CO2. NIH3T3 cells were cultured in DMEM medium containing 10 % FBS, 1 % penicillin-streptomycin at 37 °C under 5 % CO2 in a culture dish which was treated beforehand with 0.1 (w/v)% gelatin/PBS for 5 min.
2.2 Chemicals2-NBDG and 2-NBDLG were purchased from PEPTIDE INSTITUTE, Osaka, Japan. PKH26 was purchased from Sigma Aldrich.
2.3 Uptake of glucose analogs and staining with PKH26Medium was removed and the dish was washed twice with 500 µL Krebs Ringer buffer (KRB) and then 50 µM (50 × 10−9 mol/cm3) glucose analog/KRB solution was added to the dish. Under dark condition, the dish was incubated at 37 °C under 5 % CO2 for 30 min. After that, glucose analog solution was removed and the dish was washed twice with 500 µL KRB, and finally 500 µL KRB was added to the dish for confocal microscopic observation (Carl ZEISS, LSM510). When Nanog+BL6 cells were double-stained with 2-NBDLG and PKH26, cells were incubated in 100 µM 2-NBDLG for 30 min initially. Then 2-NBDLG solution was removed, the dish was washed, and finally a PKH26 solution was added to the dish.
2.4 Analysis of the uptake of fluorescent glucoseFluorescence intensity was calculated from the fluorescence images using Image J. The fluorescence images were obtained at five arbitrary locations in one culture dish. One image is 512 × 512 pixels. The fluorescence image was converted into a contrast image and a 256-level gray scale histogram was created. The brightness of the background was lowered until the outline of the cell could be clearly identified. The brightness thus adjusted was set as the brightness threshold. Under this condition, cells could be observed with brightness above the threshold (Fig. 1). Brightness of every pixel equal to or higher than the threshold level was integrated, and the result was divided by the number of integrated pixels (N0) to determine the fluorescence intensity indicator (L). Based on this fluorescence intensity indicator, the amount of fluorescent glucose taken into cells was analyzed.
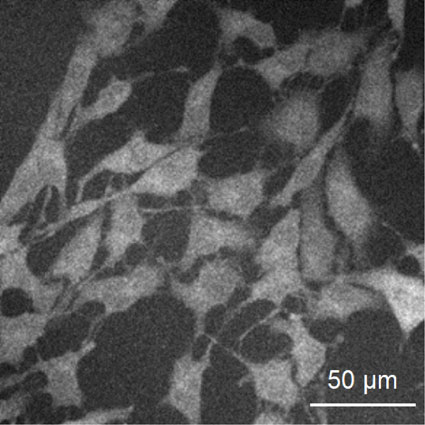
Fluorescent image of Nanog+BL6 cells stained with 2-NBDG after optimal adjustment of background threshold level. Light intensity was determined by the following formula: $\text{L} = \dfrac{1}{\text{N}_{0}}\mathop \displaystyle\sum \limits_{\text{i} = 1}^{\text{N}_{0}}$ (Light intensity–threshold light intensity)i N0: Number of pixels brighter than threshold light intensity
Melanoma cells were cultured in a dish (3.5 cmφ) at 5 × 10⁴ cells/2 mL. After culture for 2 days, medium was removed and the cells were fixed with 4 (w/v)% paraformaldehyde at room temperature for 15 min. After washing, 500 µL of 1 µg/mL DAPI (Dojindo) solution was added to stain nucleus at 37 °C for 30 min under dark condition.
2.6 Analysis of size and circularity of nucleusIn the fluorescence image obtained with a 20× objective lens, a nucleus with a perfect outline was selected and its area (µm2) and circularity were analyzed. Circularity was defined as follows: 4π(area/(perimeter)2). This value is 1.0 for a perfect circle.
2.7 Preparation of siRNA against Slc37a4 and primers for qPCR of Slc37a4siRNA was designed using a software SIDIRECT and asked its production to Japan Bio Service (Saitama, Japan). Sense strand and antisense strand are as follows:
Sense: GUUUGGUUUCUCUUCUUAUTT, Antisense: AUAAGAAGAGAAACCAAACTT Primers for qPCR of Slc37a4 were designed using a software Primer3Plus as follows:
Forward: TGGTCCCATTGCCTTGTTTG, Reverse: AGAAATCCACCCACATTGGC, Product: 108 bp.
2.8 StatisticsSpecific details regarding statistical analyses are presented in the figure legends.
Results are presented as mean ± standard deviation (SD) or mean ± standard error of mean (SEM) for the number of samples (n). The statistical significance between two specific data groups was analyzed by two-tailed Student’s t test. The statistical significance of results is denoted by marking with asterisk(s): ***: p < 0.001, **: p < 0.01, *: p < 0.05.
In the analysis of intracellular uptake of a fluorescent glucose, it is necessary to consider the influence of adsorption to the cell membrane. Therefore, we performed staining of cells with a fluorescent dye PKH26, which specifically binds to the cell membrane, and uptake of fluorescent glucose at the same time. The fluorescent image was analyzed with a confocal microscope to obtain a horizontal slice image at the center of the cell apart from the bottom of the dish. As a result, it was found that fluorescent glucose was distributed throughout the cytoplasm, in contrast to the result that PKH26 was localized in the cell membrane (Fig. 2).

Fluorescent image of Nanog+BL6 cells stained with PKH26 and 2-NBDLG. (a) Bright field image, (b) 2-NBDLG image, (c) PKH26 image, (d) merge. Scale bar: 20 µm.
NIH3T3 is originally a normal cell line but it has some characteristics of cancer cells since it has been established as a cell line. In fact, NIH3T3 showed L-glucose uptake in the same manner as the other melanoma cell lines (Fig. 3). Quantitatively, however, metastatic cell lines showed different behavior from the others. The uptake of L-glucose by BL6 was lower than that of F1. On the other hand, the uptake of L-glucose by Nanog+BL6 was significantly higher than that of BL6. Therefore, generally it cannot be said that there is a correlation between the metastatic potential and L-glucose uptake rate. However, it is clear that a highly metastatic melanoma Nanog+BL6 showed significantly high uptake of L-glucose as well as of D-glucose as compared to BL6. Therefore, we focused our analysis on this point.
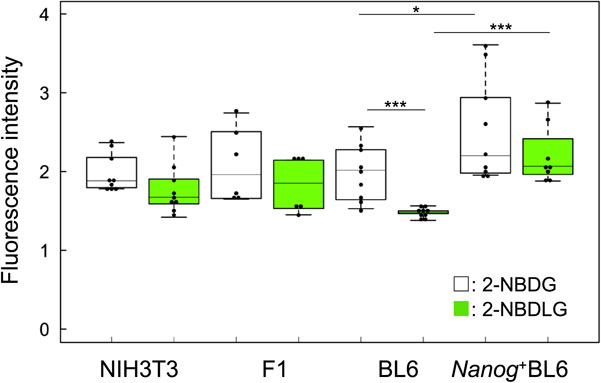
Uptake of 2-NBDG and 2-NBDLG by NIH3T3 and melanoma cells. n = 9 for NIH3T3, BL6, n = 6 for F1, n = 8 for Nanog+BL6. *: p < 0.05, ***: p < 0.001.
Competitive inhibition experiments were performed with 2-NBDG and D-glucose, and 2NBDLG and L-glucose, respectively in Nanog+BL6 cells. Consequently, the inhibition rate was about 10 % at most (Table 1), indicating that the fluorescent glucose uptake was mainly carried out through non-selective pathways and not via GLUT and SGLT.
| BL6 (n = 6, mean ± SD) |
pR(+)BL6 (n = 15, mean ± SD) |
Nanog hR(+)BL6 (n = 15, mean ± SD) |
|
|---|---|---|---|
| 2-NBDG + D-Glucose | 4.7 ± 5.6 % | 11.3 ± 1.9 % | 7.1 ± 4.2 % |
| 2-NBDLG + L-Glucose | 4.5 ± 5.4 % | 0.7 ± 6.3 % | 2.1 ± 3.1 % |
It has been reported that cells that have taken up 2NBDLG vary in the shape (size and circularity) of their nuclei. Therefore, we also investigated the case of melanoma. The size of the cell nucleus was smaller in non-metastatic F1 than in metastatic BL6 and Nanog+BL6 (Fig. 4(a)). Regarding circularity, F1 had a lower value than BL6 and Nanog+BL6 (Fig. 4(b)). However, no significant difference in size and circularity was observed between BL6 and Nanog+BL6. Furthermore, detailed observation at the single-cell level revealed no particular difference in the shape of the nucleus between Nanog+BL6 cells having taken up different amount of 2NBDLG (Fig. 5). Therefore, it was concluded that Nanog increased the uptake activity of 2NBDLG, but did not cause a change in the shape of the nucleus.

Distribution of nuclear size (a) and circularity (b) of melanomas after taking in 2-NBDLG. Number of cells analyzed: F1 [116, 106, 169], BL6 [123, 226, 231], Nanog+BL6: [213, 192, 165]. mean ± SD for n = 3. Numbers in [ ] indicate the number of cells in each of three samples of F1, BL6, and Nanog+BL6.
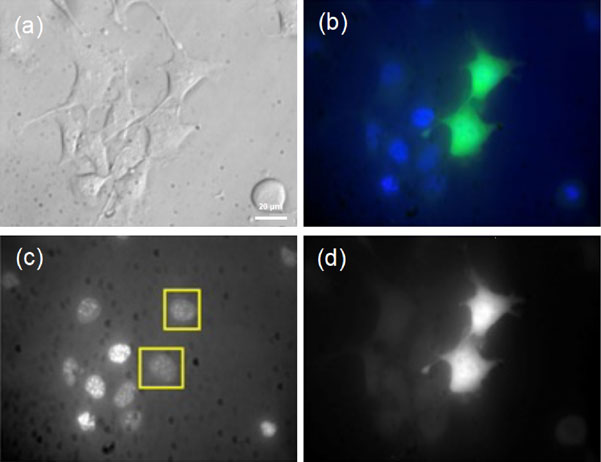
Comparison of nuclear images of Nanog+BL6 single-cells taking in different quantity of 2NBDLG. (a) Bright field image, (b) merge, (c) DAPI image, (d) 2-NBDLG image. Scale bar: 20 µm.
Slc37a4 was up-regulated in the Nanog-overexpressing cell line compared to the wild-type BL6, as predicted by RNA sequencing (Fig. 6). When 1 nM of siRNA against Slc37a4 was introduced into Nanog+BL6, it was significantly knocked down, and the knockdown effect was maintained until 48 h later. Subsequently, we investigated changes in fluorescent glucose uptake activity associated with this knockdown. Under the condition of 1 nM siSlc37a4, the uptake of 2NBDG was significantly reduced to 62 % (Fig. 7) by knockdown and not by knockout of Slc37a4. In contrast, the uptake of 2NBDLG was not affected.
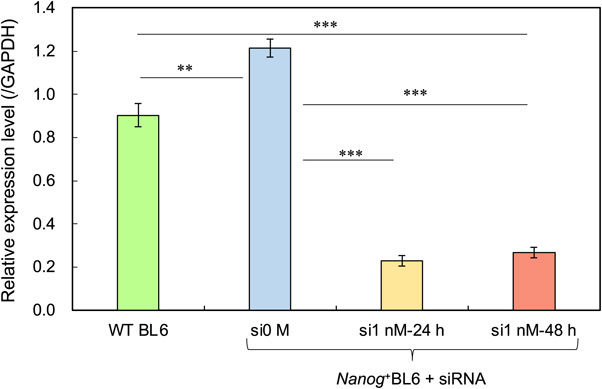
Relative expression of Slc37a4 in BL6, Nanog+BL6, and Nanog+BL6 after treated with siSlc37a4 for 24 h or 48 h. mean ± SD for n = 3. **: p < 0.01, ***: p < 0.001.
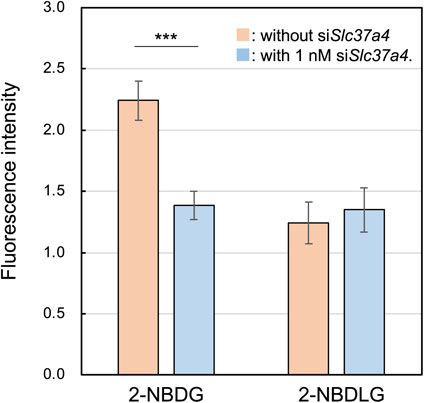
Effects of Slc37a4 knock down on the uptake of 2NBDG and 2NBDLG in Nanog+BL6. mean ± SEM for n = 14 for 2NBDLG without siSlc37a4, n = 15 for other cases. ***: p < 0.001.
These results clearly indicate that 2-NBDG can detect the loss of G6PT, the product of Slc37a4, suggesting that 2-NBDG is phosphorylated to become 2-NBDG-P and further recognized by G6PT. Regarding 2-NBDLG, however, it is unclear whether 2-NBDLG is phosphorylated or not. If phosphorylated, it is also unclear whether 2-NBDLG-P is recognized by G6PT. In this case, 2-NBDLG can be used as the control for the 2-NBDG function. The results of the present study are summarized in Fig. 8.
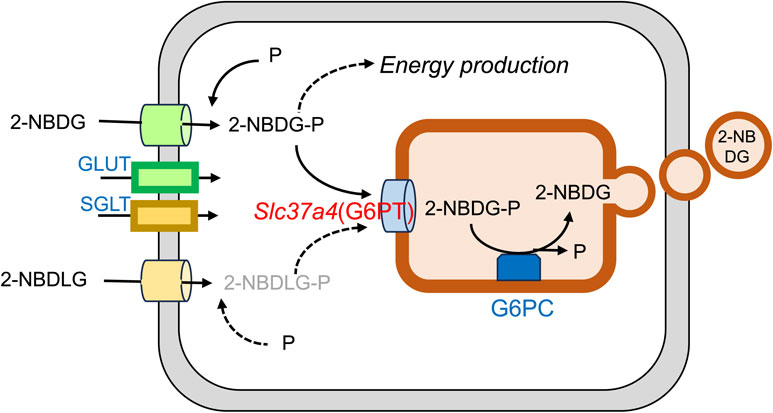
Potential use of 2NBDG as a fluorescent probe to detect glucose transport from the cytosol to the ER in melanoma. G6PC: glucose-6-phosphatase catalytic subunit.
Initially, 2-NBDG was used alone as a probe for the process of glucose uptake into cells to evaluate cell viability. The development of 2-NBDLG as the control for 2-NBDG significantly increased the accuracy in the 2-NBDG-dependent analyses. Moreover, combined uses of 2-NBDG and 2-NBDLG has enabled the specific detection of cancer cells and normal cells. Here, we demonstrated that these glucose analogs detected the influence of genes involved in cancer cell malignancy (metastatic potential). These results suggest that the combined use of 2-NBDG and 2-NBDLG can evaluate the degree of malignancy of cancer cells. Since glucose uptake activity is directly linked to cellular energy metabolism, the intracellular redox state will change and consequently, cell membrane potential will change. Therefore, the present results will lead to the development of a novel biosensing system for cancer cell malignancy based on cell electrochemistry.
Mikako Saito: Conceptualization (Lead), Funding acquisition (Lead), Investigation (Lead), Project administration (Lead), Supervision (Lead), Writing – original draft (Lead), Writing – review & editing (Lead)
Miyu Fukaya: Data curation (Lead), Formal analysis (Lead)
Risa Sugawara: Data curation (Supporting)
The authors declare no conflict of interest in the manuscript.
M. Saito: ECSJ Active Member