Abstract
A novel type of encephalopathy associated with the ingestion of Sugihiratake mushroom
(Pleurocybella porrigens) occurred in patients with chronic renal
failure treated on hemodialysis in fall, 2004 in Japan. To clarify the mechanism of
encephalopathy onset, we, for the first time, purified the cyanogen glycoside fraction
(CG) from Sugihiratake mushroom using reversed phase high-performance liquid
chromatography and hydrophilic interaction chromatography. Furthermore, we investigated
single dose toxicity of the CG in an adenine-induced rat model of chronic renal damage
(CRD). Pathological examination of kidneys indicates the development of CRD. Oral
administration of the CG induces the accumulation of thiocyanate in the hemolyzed blood
and brain in CRD rats, although no morphological changes were found in the brain. No
further enhancement of kidney damage is observed after the oral administration of the CG
in CRD rats. This is the first experimental report to suggest that acute encephalopathy,
induced by Sugihiratake mushroom intake in the patients with chronic renal failure, is
associated with intoxication of cyanide and thiocyanate, presumably produced metabolically
produced after the ingestion of Sugihiratake mushroom.
1. Introduction
Sugihiratake (Pleurocybella porrigens) is a thin, tongue-shaped mushroom
that grows on cedar and pine trees in autumn and is widely distributed in Japan1). It has a characteristic flavor and
is popularly consumed in Japan with processed foods such as miso soup (fermented bean paste
soup) and deep-fried as tempura. In fall, 2004, an outbreak of encephalopathy exclusive to
patients with chronic renal failure treated on hemodialysis, occurred after Sugihiratake
intake in northern areas of Japan including Akita, Yamagata, and Niigata Prefectures.
To date, several clinical reports are available on the encephalopathy induced after
ingestion of Sugihiratake. The reported symptoms are tremor, difficulty in walking,
consciousness disturbance, and then followed by status epileptics. Diffuse lesions in the
basal ganglia and multiple ringed lesions in the cerebral cortex are also observed by
magnetic resonance imaging (MRI). The exact etiology of encephalopathy associated with
Sugihiratake intake remains unclear.
Suzuki and Kawagishi et al2,3,4)
isolated to characterize a novel lectin and several amino acids from Sugihiratake, and
proposed that the lectin might be related to the acute encephalopathy. Takano et
al5) reported that
intraperitoneal injection of a P. porrigens extract resulted in shock and
acute toxic death with severe hemolysis in mice. They also noted a possible association with
unidentified thermolabile high molecular weight constituents. Most of aqueous
polysaccharides or high molecular weight constituents are negligibly absorbed and
transported as intact to the brain. The role of polysaccharide on instigating encephalopathy
thus remains uncertain.
We have determined cyanide contents of Sugihiratake samples collected from various regions
of Japan where experienced incidents of encephalopathy in fall, 2004. High levels of cyanide
were detected in some of the samples collected in 2004. In addition, some reports suggested
sublethal doses of cyanide to induce encephalopathy6,7,8,9,10,11). These data suggest a possible association between cyanide
intake and encephalopathy onset. No experimental evidence to support the hypothesis for the
association is, however, available between cyanide intake and the onset of
encephalopathy.
In the present study, we have, for the first time, purified the cyanogen glycoside fraction
(CG) from wild Sugihiratake using reversed phase high-performance liquid chromatography
(RP-HPLC) and hydrophilic interaction liquid chromatography (HILIC) and investigated its
single-dose toxicity in an adenine-induced rat model of chronic renal damage (CRD). The
present study suggests the possible association of acute encephalopathy induced by
Sugihiratake mushroom intake in the patients having renal damage with cyanide and
thiocyanate intoxication. The cyanide and thiocyanate are possibly produced metabolically
through the digestion of cyanogen glycoside contained in Sugihiratake mushroom.
2. Materials and Methods
2-1. Purification of the Cyanogen Glycoside Fraction (CG)
Wild Sugihiratake samples (approximately 3 kg) were collected in Higashihouden,
Mogamimachi, Yamagata prefecture in October 2009 and extracted as follows. Freeze-dried
samples were ground to a fine powder using a grinder (Retsch GmbH, Haan, Germany), and
then samples (107.2 g) were extracted three times with 1072 mL each of methanol-water
(70:30, v/v) in a sonication bath using 2 L flask. And then, the obtained clear
supernatant was collected by centrifugation (2330 × g) at 4ºC for
30 minutes and evaporated under reduced pressure at 40°C. The obtained dried extract
(approximately 5 g) was resuspended in 70% methanol.
The CG was consecutively purified from the 70% methanol extract using RP-HPLC, dialysis
and HILIC as follows. The 70% methanol extract (total 500 mg, 50 mg for each
fractionation) was consecutively fractionated using RP-HPLC, a dialysis membrane, and
HILIC. A series of the fractionation was repeated ten times (for each 50 mg). RP-HPLC was
performed using a Unison US-C18 column (5 µm ID, 250 × 10 mm; Imtakt Corporation, Kyoto,
Japan) at a flow rate of 1.2 mL/min on an apparatus composed of a HITACHI L-2130 pump and
HITACHI UV detector L-2400 (Hitachi, Ltd., Tokyo, Japan). The column was maintained at
40ºC using a water bath. The mobile phases were (A) H2O and (B) 95%
acetonitrile under the following gradient conditions: 0–20 min (B: 0%),
20–30 min (B: 0%→100%), 30–50 min (B: 100%), 50–60 min (B: 100%→0%), 60–80 min (B: 0%).
The content of cyanogen glycoside in each fraction was determined as below. Fractions
containing large molecular weight (MW) molecules were subjected to dialysis with a MW
cutoff (MWCO) of 3500 (Spectra/Por® Dialysis Membrane MWCO: 3500;
Spectrum® Laboratories, Inc., Shiga, Japan). Fractions containing small MW
molecules (MW < 3500) were concentrated and subsequently subjected to dialysis with a
MWCO of 1000 (Spectra/Por® Dialysis Membrane MWCO: 1000; Spectrum®
Laboratories, Inc.).
The fraction containing small MW molecules (MW < 1000) was fractionated by HILIC using
an XBridgeTM Amide column (3.5 µm ID, 4.6 × 250 mm; Nihon Waters K.K., Tokyo,
Japan) at a flow rate of 0.5 mL/min and column temperature of 30ºC. The mobile phase
consisted of (A) 95% acetonitrile and (B) H2O under the following gradient
conditions: 0–70 min (B: 0%→77%), 70–80 min (B: 77%→0%), 80–100 min (B: 0%). Fractions
were collected every one minute using a MODEL 2110 fraction collector (Bio-Rad
Laboratories, Inc., CA, USA), and determination of cyanogen glycoside contents in each
fraction was carried out as below.
2-2. Determination of Cyanogen Glycoside Contents by Fluorometric Detection
Determination of cyanogen glycosides using HPLC with fluorometric detection was performed
according to the method of Akiyama et al12) with minor modifications. Briefly, the reaction mixture
(1 mL) containing 50 mM sodium citrate (pH 5.2), 52 mU of β-glucosidase from almonds
(Sigma-Aldrich Japan K.K., Tokyo, Japan), and 10 µL of sample was placed in the outer well
of a Conway cell (Shibata Scientific Technology Ltd., Saitama, Japan). After incubation at
37ºC for three hours, 1 mL of 10% sulfuric acid was added and mixed with the reaction
mixture. The liberated hydrogen cyanide was recovered with 1 mL of 0.1N sodium hydroxide
in the center chamber for one hour.
2-3. Establishment of Adenine-induced CRD Rats
Ten male, 9-week-old Crl:CD (Sprague Dawley (SD)) specific pathogen free (SPF) rats (the
body weights: 288–315 g) were purchased from Charles River Laboratories Japan, Inc.
(Tokyo, Japan). According to the procedure of Nagano et al13), SD rats with CRD were generated by feeding
diets containing 0.75% or 0.5% (w/v) of adenine for four weeks. In brief, the animals were
maintained in an experimental facility under temperature- and light-controlled conditions,
and were allowed free access to diet and ultraviolet-exposed tap water. One week prior to
the study start, rats were fed a CE-2 diet (CLEA Japan, Inc., Tokyo, Japan). During the
study period, they were allowed free access to diet containing 0.75% adenine (Sigma;
minimum 99%, Cat. No. A8626) for the first two weeks. For the next two weeks, they were
allowed free access to 0.5% adenine diet. Feeding of the adenine-containing diets for a
total of four weeks (28 days) established a rat model of CRD. The adenine-containing diets
were composed of CE-2 diet supplemented with 0.75 or 0.5% adenine. The adenine-containing
diets were purchased from CLEA Japan, Inc. (Tokyo, Japan). One rat died on the eighth day
of adenine diet feeding, presumably due to the renal damage and decrease of feed intake,
although the reason of the death remains unclear. The remaining nine 14-week-old CRD rats
(the body weights: 217–294 g) were divided into three groups: control, low-dose CG and
high-dose CG groups.
2-4. Single Dose Toxicity Test of CG Extracted from Sugihiratake in CRD Rats
The CGs were dissolved in distilled water and orally administered by gavage to CRD rats
according to the following groups: control group, only distilled water; low-dose group,
360 mg CG/kg body weight (corresponding to 0.31 mg sodium cyanide/kg body weight);
high-dose group, 2840 mg CG/kg body weight (corresponding to 2.44 mg sodium cyanide/kg
body weight). All test samples were orally administered to rats at 20 mL/kg body weight.
The administration levels were determined in consideration of the amount extracted from
Sugihiratake and the toxicity information of the Registry of Toxic Effects of Chemical
Substances, i.e., LD50 of sodium cyanide in rats is 4.7 mg/kg or 6.4 mg/kg. The
rats were allowed free access to CE-2 diet for 24 hours before administration of the test
samples. Blood was collected from rats via the jugular vein without anesthesia before
administration, and 8 hours and 24 hours after administration. The collected blood (0.5 mL
per rat) was added to 0.5 mL of 0.1M sodium hydroxide, stirred well and hemolyzed. The
hemolyzed blood was stored at −30ºC, and then subjected to determinations of cyanide or
thiocyanate content according to the method of Akiyama et al12).
The rats were euthanized under deep anesthesia by inhalation of isoflurane 24 hours after
administration, and the brain, heart, lungs (including bronchial tubes), liver, pancreas
and kidneys were excised. Brains were cut in two sagittal sections. The left parts of the
brain were fixed in 10% neutral buffered formalin solution. The right parts of the brain
were weighed and then added to an equal amount of 0.1M sodium hydroxide. The brains were
homogenized, stored at −20ºC, and analyzed for cyanide and thiocyanate contents. The
heart, lungs (including bronchial tubes), liver, pancreas and kidneys were also fixed in
10% neutral buffered formalin and routinely processed for histopathological analysis.
Sections at frontoparietal cortex, parietal cortex/hippocampus, and cerebellum pons of
each brain were stained with hematoxylin-eosin (HE).
Statistical Analysis All values are expressed as the mean ± standard
deviation (SD). A p value of less than 0.05 was considered to be
statistically significant. Differences between values were evaluated using Bonferroni’s
method after analysis of variance (ANOVA).
3. Results
The CG was consecutively purified using RP-HPLC, dialysis and HILIC. The cyanogen
glycosides were collected using a fraction collector and monitored using HPLC with
fluorometric detection. When samples were subjected to RP-HPLC, 92.5% of cyanogen glycosides
were found in fractions eluted from 1 to 20 minutes (data not shown). With dialysis, 44.7%
of cyanogen glycosides were found in fractions containing small MW molecules (MW < 1000)
(data not shown). When HILIC was used to separate small MW molecules, the fractions eluted
between 35 and 43 minutes showed a high amount of cyanogen glycoside (Fig. 1). The fractions collected from 35 to 43 minutes were
freeze-dried and dissolved in distilled water to be the CG. The CG was then evaluated in the
single dose toxicity test using CRD rats.
3-1. Adenine-induced Rat Model of CRD
To prepare an adenine-induced rat model of CRD13), adenine (0.75 and 0.5%)-containing diet was administered
to rats for four weeks. Body weight changes during the four-week feeding of
adenine-containing diet and single dose treatment with CG are shown in Table 1. Body weight of rats showed minimal changes throughout
the study. Features of adenine-induced CRD are described in the pathological findings.
Necropsy at the end of the study revealed swollen yellowish kidneys. Histopathological
examination of kidneys revealed crystal nephropathy characterized by severe accumulation
of 2,8-dihydroxyadenine (DHA) crystals in dilated tubules with foreign body giant cells,
inflammatory cells and interstitial fibrosis, indicating successful generation of an
adenine-induced CRD rat model.
Table 1.
The body weight changes
| IndividualNo. |
Animal*No. |
|
Quarantine and acclimation periods |
Adenine-component feed feeding period |
|
---- 0.75% --- |
-------- 0.5% -------- |
| Day |
1 |
5 |
9 |
1 |
8 |
15 |
22 |
28 |
| 1 |
1302 |
|
298 |
334 |
355 |
362 |
281 |
270 |
270 |
259 |
| 2 |
exc. |
|
308 |
355 |
381 |
384 |
267 |
- |
- |
- |
| 3 |
1203 |
|
295 |
344 |
366 |
368 |
268 |
282 |
285 |
282 |
| 4 |
1103 |
|
288 |
317 |
332 |
334 |
257 |
220 |
219 |
220 |
| 5 |
1301 |
|
304 |
337 |
368 |
378 |
270 |
282 |
285 |
256 |
| 6 |
1303 |
|
297 |
343 |
366 |
375 |
321 |
303 |
298 |
282 |
| 7 |
1101 |
|
315 |
354 |
385 |
388 |
293 |
258 |
260 |
262 |
| 8 |
1201 |
|
306 |
348 |
368 |
378 |
301 |
279 |
279 |
261 |
| 9 |
1102 |
|
303 |
340 |
361 |
362 |
275 |
271 |
270 |
273 |
| 10 |
1202 |
|
305 |
345 |
363 |
369 |
266 |
268 |
264 |
254 |
| Mean |
|
|
302 |
342 |
365 |
370 |
280 |
270 |
270 |
261 |
| S.E. |
|
|
2 |
3 |
5 |
5 |
6 |
8 |
8 |
6 |
Unit: g.
No.2: died on day 8 of adenine-component feed feeding period (266 g body weight).
* Identification numbers after allocation to treatment groups (exc.:
excluded from this study).
Quarantine period: 5 days.
Acclimation period: 9 days (with quarantine period).
3-2. Changes after Administration of CG in Adenine-induced CRD Rats
3-2-1. Clinical Signs
Rats were clinically evaluated after CG administration. One of three rats in the
high-dose group appeared weak and lay down in a prone position one hour after
administration. Two hours later, the animal had recovered. No other rats showed any
abnormalities.
3-2-2. Changes of Cyanide and Thiocyanate Levels in the Hemolyzed Blood
After administration of CG to CRD rats, cyanide and thiocyanate levels in the hemolyzed
blood were determined. As shown in Fig.2, slight
increases in the cyanide levels between 0–8 hours were observed in both the low-dose and
high-dose groups, although the increase between 0–24 hours was minimal. On the other hand,
as shown in Fig.3, the increase of the
thiocyanate levels in the hemolyzed blood between 0–8 hours and 0–24 hours in both the
low-dose and high-dose groups, were significantly higher than those of the control. In
addition, the increases of thiocyanate levels between between 0–8 hours and 0–24 hours in
the high-dose group were significantly higher than those of the low-dose group.
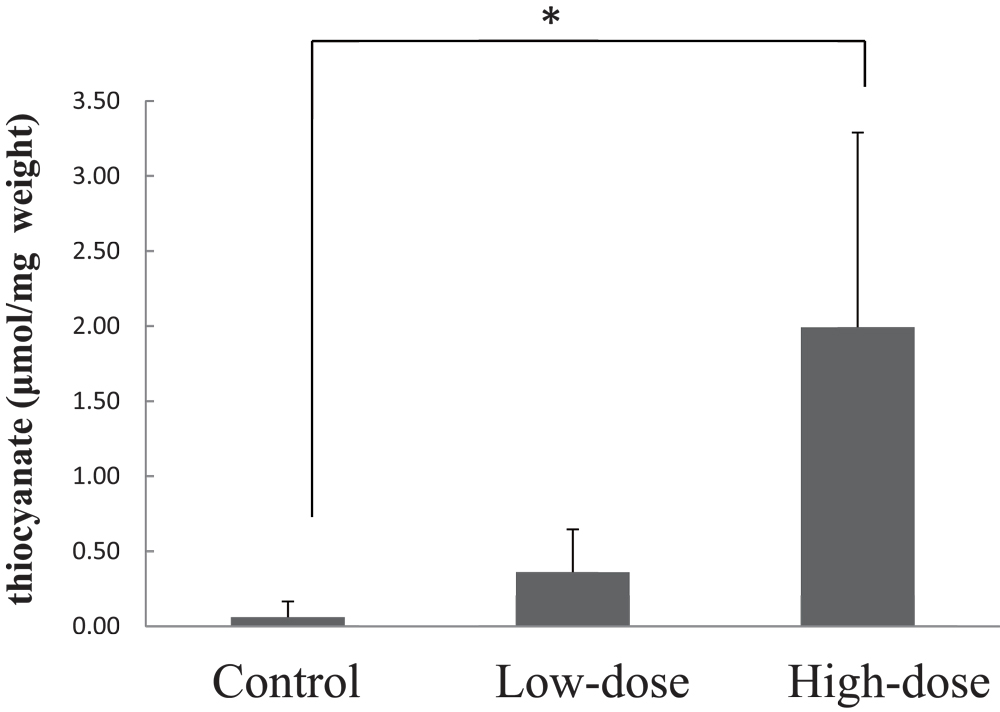
3-2-3. Change of Brain Thiocyanate Levels in Adenine-induced CRD Rats
After CG administration to CRD rats, brain levels of cyanide and thiocyanate were
determined. Brain cyanide levels in the brain were very low and not detectable, only
thiocyanate levels are thus shown in Fig. 4. The
mean thiocyanate level in the low-dose group appeared to be higher than that of the
control. The high-dose group showed significant increase in thiocyanate levels compared to
the control group.
3-2-4. Pathological Findings in Brain, Heart, Lungs, Liver, Pancreas and Kidneys of
CRD Rats
Macroscopically, no abnormalities were detected in the brain of CRD rats administered CG.
The kidneys of CRD rats were swollen and yellowish in color, and were comparable in
appearance in the control, low- and high-dose groups (Fig. 5). The thymus appeared shrunken in all groups, the arcus aortae of one
control rat was whitish-gray in color, and the glandular stomach/colon in the control and
high-dose groups was grayish in color.

Microscopic observation did not reveal any treatment-related findings or
degenerative/necrotic lesions in any parts of the cerebrum or the cerebellum in all
treatment groups (Fig. 6). Histopathological
changes corresponding to the macroscopic abnormalities in the kidneys were confirmed
(Fig. 7). The kidneys of CRD rats showed
similar morphological features to chemically-induced obstructive nephritis, an accepted
model of CRD13). Briefly, the
normal kidney structure was disrupted and replaced with an abnormal one (Fig. 7 A and B). Many distal convoluted tubules were
obstructed with DHA crystals, observed as brown to black dots (Fig. 7 D), and showed basophilic changes. Dilated distal renal
tubules and inflammatory reactions including neutrophils and giant cells surrounding the
obstructed tubules were noted (Fig. 7 D).
Cellular infiltration of neutrophils and mononuclear cells as well as fibrosis were also
detected in the interstitium. Histopathological findings are summarized in Table 2. The pathological findings in kidney
indicate the development of CRD in the present study. In addition, augmentation of CRD
treatment-related changes were not observed in the kidneys of CRD rats administered CG.
Systemic mineralization in the artery or interstitium of various tissues, known as
secondary hyperparathyroidism, which is associated with CRD, was noted in the aorta,
heart, lung and glandular stomach in some animals. However, the extent and location of the
mineralization was not different in the CG treated rats. All groups showed atrophy of the
small thymus, suggesting systemic deterioration as a result of CRD (Table 3).
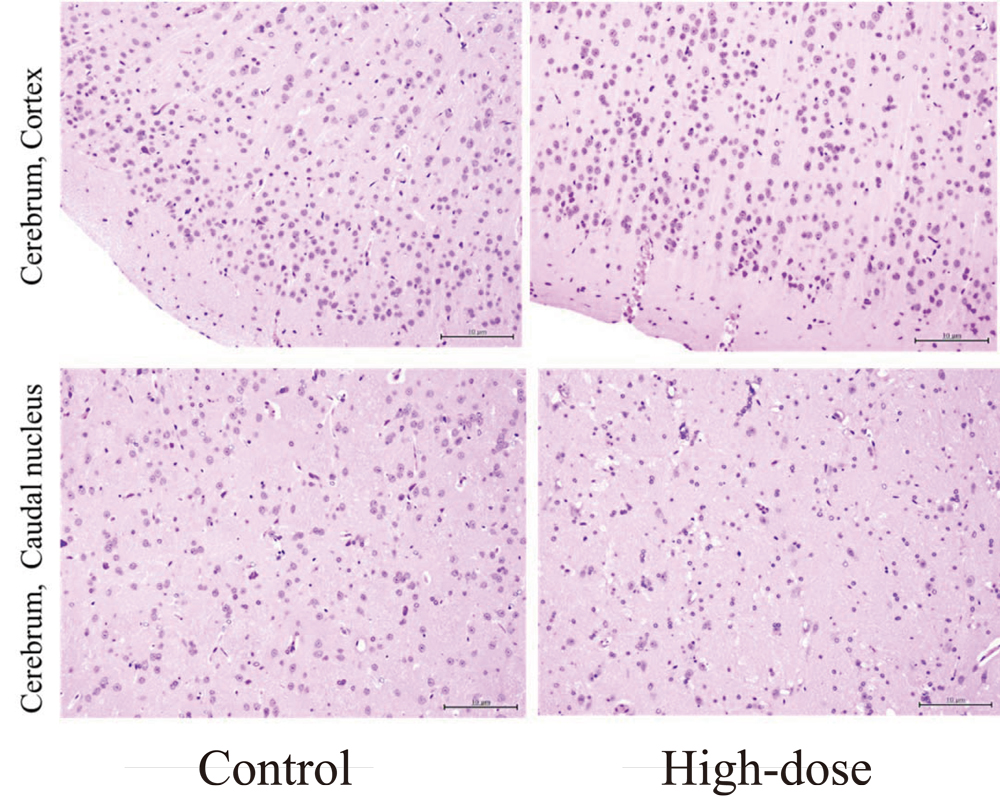
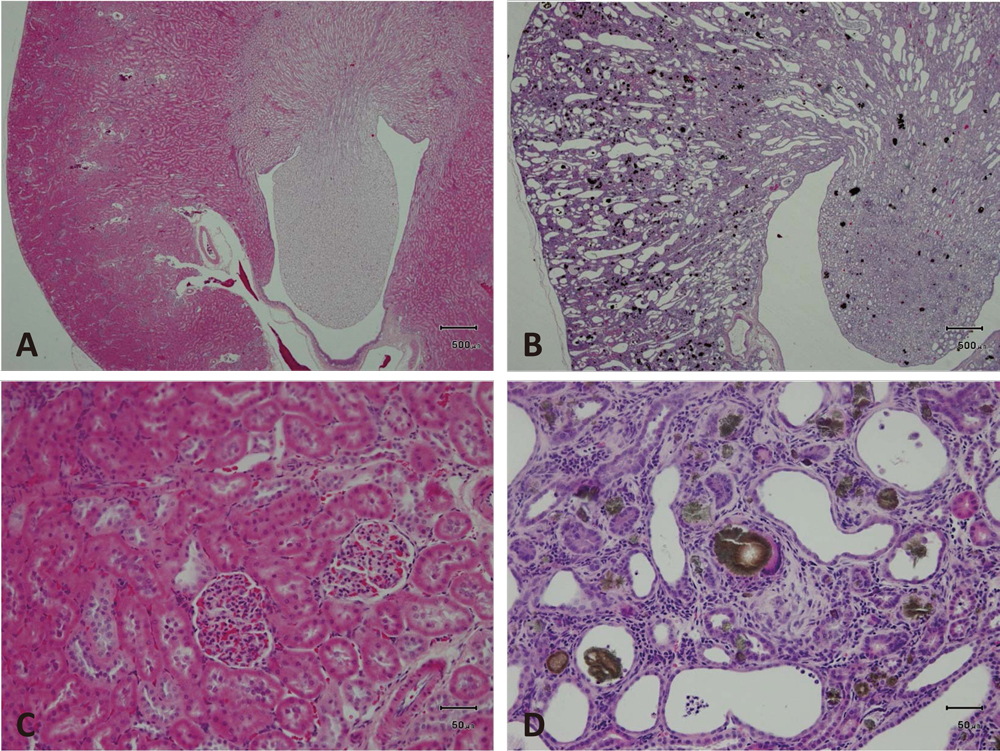
Table 2.
Pathological findings in rats with adenine-induced renal failure after oral
administration of Sugihiratake extract
|
Test substance |
Control |
|
Sugihiratake extract |
| 360 mg/kg |
|
2840 mg/kg |
| Animal No. |
1101 |
1102 |
1103 |
|
1201 |
1202 |
1203 |
|
1301 |
1302 |
1303 |
| Heart |
|
|
|
|
|
|
|
|
|
|
|
| Myocardium |
|
|
|
|
|
|
|
|
|
|
|
| Focal calcification |
0 |
0 |
1 |
|
1 |
0 |
0 |
|
1 |
1 |
0 |
| Coronary artery |
|
|
|
|
|
|
|
|
|
|
|
| Cellular infiltration,
mononuclear cell |
1 |
0 |
1 |
|
1 |
0 |
0 |
|
1 |
1 |
0 |
| Calcification |
0 |
0 |
3 |
|
3 |
0 |
0 |
|
3 |
2 |
1 |
| Arcus aorta |
|
|
|
|
|
|
|
|
|
|
|
| Tunica media,
calcification |
2 |
0 |
3 |
|
3 |
1 |
0 |
|
3 |
2 |
1 |
Tunica intima, cellular
infiltration, neutrophil /
mononuclear cell |
1 |
0 |
0 |
|
1 |
0 |
0 |
|
0 |
0 |
0 |
| Lung |
|
|
|
|
|
|
|
|
|
|
|
| Alveolar septa, calcification |
0 |
0 |
3 |
|
0 |
0 |
0 |
|
2 |
0 |
0 |
| Bronchial smooth muscle,
calcification |
0 |
0 |
2 |
|
0 |
0 |
0 |
|
1 |
0 |
0 |
| Kidney |
|
|
|
|
|
|
|
|
|
|
|
| Artery |
|
|
|
|
|
|
|
|
|
|
|
| Calcification |
1 |
0 |
2 |
|
2 |
1 |
0 |
|
2 |
2 |
1 |
| Renal tubule |
|
|
|
|
|
|
|
|
|
|
|
| 2,8-dihydroxyadenine (DHA)
crystals |
3 |
3 |
3 |
|
3 |
3 |
3 |
|
3 |
3 |
3 |
| Tubular dilatation |
3 |
3 |
3 |
|
3 |
3 |
3 |
|
3 |
3 |
3 |
| Tubular basophilic change |
3 |
3 |
3 |
|
3 |
3 |
3 |
|
3 |
3 |
3 |
| Cellular infiltration,
neutrophil |
2 |
2 |
2 |
|
2 |
2 |
2 |
|
2 |
2 |
2 |
| Giant cells |
1 |
1 |
1 |
|
1 |
1 |
1 |
|
1 |
1 |
1 |
| Interstitium |
|
|
|
|
|
|
|
|
|
|
|
Cellular infiltration,
neutrophil /
mononuclear cell |
1 |
1 |
1 |
|
1 |
1 |
1 |
|
1 |
1 |
1 |
| Fibrosis |
2 |
2 |
2 |
|
2 |
2 |
2 |
|
2 |
2 |
2 |
0: No change, 1: Slight, 2: Moderate, 3: Marked.
No significant changes were detected: Spleen, Liver.
Table 3.
Pathological findings in rats with adenine-induced renal failure after oral
administration of Sugihiratake extract
|
Test substance |
Control |
|
Sugihiratake extract |
| 360 mg/kg |
|
2840 mg/kg |
| Findings |
Animal No. |
1101 |
1102 |
1103 |
|
1201 |
1202 |
1203 |
|
1301 |
1302 |
1303 |
| Kidney |
| Enlargement, pale yellow |
+ |
+ |
+ |
|
+ |
+ |
+ |
|
+ |
+ |
+ |
| Thymus |
| Small size |
+ |
+ |
+ |
|
+ |
+ |
+ |
|
+ |
+ |
+ |
| Arcus aorte |
| Grayish white |
- |
- |
+ |
|
- |
- |
- |
|
- |
- |
- |
| Coronary artery |
| Grayish white |
- |
- |
+ |
|
- |
- |
- |
|
- |
- |
- |
| Glandular stomach |
| Grayish white |
- |
- |
+ |
|
- |
- |
- |
|
+ |
- |
- |
| Colon |
| Grayish white |
- |
- |
+ |
|
- |
- |
- |
|
+ |
- |
- |
-: No change, +: Change.
4. Discussion
We, for the first time, purified the CG from the autumn mushroom Sugihiratake using RP-HPLC
and HILIC. We further investigated the single dose toxicity of the CG in a rat model of
adenine-induced CRD. The cyanide and thiocyanate levels in the hemolyzed blood were
increased in CRD rats administered CG; a substantial increase of thiocyanate was observed in
both the low-dose and high-dose CG groups compared to control. In the preliminary
experiments using normal SD rats orally administrated with potassium cyanate, increases of
blood cyanide and thiocyanate levels are not observed at eight hours after the
administration (data not shown). The study suggests that cyanide from cyanogen glycoside is
metabolized to thiocyanate until eight hours after administration probably by rhodanese in
the liver and kidneys. Also, the thiocyanate levels in the hemolyzed blood continued to
increase for one day after administration in CRD rats. In addition, the study suggests that
the thiocyanate produced from cyanogen glycoside was transported to and distributed in the
brain because of the increase of thiocyanate levels in brain after administration of CG.
Therefore, these findings suggest that cyanogen glycoside contained in Sugihiratake was
absorbed and metabolized by β-glucosidase distributed in the organs or tissue, and then
transported to the blood and brain. It is known that cyanide is metabolized to thiocyanate
as a final metabolite by rhodanese expressed in various organs such as liver and kidney.
Accordingly, we presume that patients with renal dysfunction who consumed Sugihiratake
mushroom exhibit accumulation of cyanide and thiocyanate because of inhibited thiocyanate
urine excretion14).
One of the three rats in the high-dose group was weak and lay down in a prone position one
hour after CG administration; two hours later, the animal recovered. This symptom may be
attributed to the high cyanide level due to intake of cyanogen glycoside in the CG; however,
any treatment-related morphological changes were not observed in the brain.
Histopathological examination confirmed the successful establishment of a rat model of
adenine-induced CRD using the protocol in the present study. In addition, CG extracted from
Sugihiratake did not appear to enhance CRD or induce any treatment-related changes in the
kidney in the present study.
A number of clinical case studies focused on the outbreak of acute encephalopathy in fall
of 2004 in Japan15,16,17,18,19). All cases involved patients with varying degrees of renal
dysfunction who had consumed Sugihiratake. Common clinical symptoms at onset included
weakness and tremor or dysarthria and subsequent intractable focal motor seizures, resulting
in the generalized status epilepticus or a comatose state. Magnetic resonance imaging (MRI)
examination of the brain revealed diffuse lesions in the basal ganglia and multiple ringed
lesions in the cerebral cortex. Nomoto et al18) reported a case of encephalopathy associated with
Sugihiratake ingestion in a patient with diabetic nephropathy. Results of brain MRI and
cerebrospinal fluid examination led to the conclusion that the observed demyelination was
likely associated with Sugihiratake intake.
These clinical case studies discussed similarities in the symptoms and characteristics of
Sugihiratake intake-induced encephalopathy with those induced by exposure to respiratory
toxins such as manganese, methanol, 3-nitro propionic acid (3-NPA) and cyanide. However,
there are no reports that manganese and 3-NPA were detected in high levels in Sugihiratake,
and these compounds were not detected in our investigation (data not shown). Although
symptoms of methanol intoxication are mainly characterized by visual disturbance and
abnormalities in the optic nerve, there are no reported clinical case studies dealing with
these symptoms. Therefore, this led us to consider that Sugihiratake-induced encephalopathy
is unlikely to associate with intoxication of manganese, 3-NPA and methanol.
We quantified the cyanide content of Sugihiratake samples collected from specific areas of
Japan during the fall of 2004; the samples contained cyanide in the range of N.D. (not
detected)-114.0 µg/g12).
The findings suggested that the cyanide in samples is present in sodium or potassium salt
form, and that the cyanide contained in the Sugihiratake might be associated with the onset
of encephalopathy in patients with chronic renal failure treated on hemodialysis, documented
in fall, 2004 in Japan.
Many edible plants, including agriculturally important species such as cassava, flax,
sorghum, alfalfa, peaches, almonds, and beans, are cyanogenic20). The precursor of cyanide production is cyanogen
glycoside. Cassava flour from central Africa contains large quantities of linamarin, a
cyanogen glycoside. In diets where cassava is a staple, the daily human consumption is
equivalent to about one-half the lethal dose, and is thought to be the reason for the
widespread incidence of chronic neurological disorders, called “konzo”, frequently found in
this area21). In addition,
cyanide production has been observed in a wide range of fungal species such as
Phaeolepiota aurea, Rozites caperatus, and
Leucopaxillus giganteus, in addition to P. porriggens
(Sugihiratake) 22). In the
present study, we have purified the cyanogen glycoside as a source of cyanide from
P. porriggens, the Sugihiratake mushroom. The reason why these fungal
species produce cyanide and the identity of the precursor of cyanide remain unknown,
although some reports have suggested that fungal cyanide production is associated with snow
mold disease and fairy ring disease in some plants22).
While the studies dealing with cyanide-induced encephalopathy have been reported6,7,8,9,10,11), Smith et al6) demonstrated that long-term low-dose cyanide ingestion caused
histological changes in the central nervous system of rats. In a clinical study of patients
that attempted suicide with cyanide, Rachinger et al9) showed that intermittent exposure produced histological
changes in the central nervous system, causing cerebral damage primarily to the basal
ganglia. These symptoms are consistent with the cases reported in Akita Prefecture of
Japan.
Furthermore, a recent study has shown that cyanide and thiocyanate are accumulated in the
blood of hemodialysis patients due to cigarette smoking23). Cyanide is metabolized to thiocyanate by rhodanese and
excreted in urine. The detoxification of cyanide is an essential defense mechanism, and
thiocyanate synthesis can be accelerated under cyanide-loaded conditions such as cigarette
smoking and eating certain plants including cyanogen glycoside or cyanide24).
Recently, the sodium iodide symporter, mediating active iodide transport into the thyroid,
the lactating mammary gland and placenta, was found to be competitively inhibited by
thiocyanate from maternal smoking for the intoxication of thiocyanate25). In addition, a recent study has
also shown that the risk of cerebral infarction is significantly increased in individuals
with high thiocyanate concentrations in the hemolyzed blood26).
Thiocyanate enhances the action of glutamate for a subclass of neuronal glutamate receptors
involved in neurodegenerative disorders27). Some evidence exists that thiocyanate modulates
(RS)-α-amino-3-hydroxy-5-methyl-4-isoxazolepropionic acid (AMPA) receptor
function in rodent brain tissue in vitro and in
vivo28,29,30). Several receptor-binding studies have shown that
potassium thiocyanate enhances the affinity of [3H] AMPA for its receptor and
increased [3H] glutamate binding to the AMPA receptor without altering the number
of binding sites31,32,33,34,35,36). Quantitative autoradiography shows that potassium
thiocyanate similarly increases the number of high-affinity [3H] AMPA-binding
site without altering the binding affinity36). These findings are consistent with the idea that
cyanide-induced elevated thiocyanate provides a coalition, in which synaptic glutamate
increases its potency selectively at AMPA receptors, thereby resulting in selective damage
to AMPA-enriched neurons in the motor cortex.
Cyanide and thiocyanate intoxication has been known to occur with medications such as the
hypotensive drug nitroprusside (NP), which consists of an iron molecule bound to five
cyanide molecules and one nitric oxide molecule. After NP is administered, nitric oxide is
rapidly liberated in blood during infusion, whereas the cyanide molecules are released
gradually. Therefore, the use of NP can potentially cause cyanide and thiocyanate
intoxication as side effects. Nessim et al37) reported a case of thiocyanate toxicity secondary to NP
infusion in which the patient was successfully treated with continuous venovenous
hemodiafiltration. It was suggested that thiocyanate can lead to toxicity, especially in the
context of impaired renal function, although it is less toxic than cyanide. Symptoms of
thiocyanate toxicity include confusion, hallucination, delirium, seizures, fatigue,
weakness, miosis, tinnitus and rash, and are closely similar to the symptoms of
Sugihiratake-induced acute encephalopathy. These reports imply that cyanogen glycoside
intake from foods may cause the accumulation of thiocyanate in the blood and brain of
patients with chronic renal failure treated on hemodialysis.
In the findings of present study considering the context of previous reports, we suggest
the possibility of association of acute encephalopathy induced by Sugihiratake mushroom
intake in the patients having renal damage with cyanide and thiocyanate intoxication. In
addition, we suggest that the cyanide and thiocyanate are possibly produced metabolically
through the digestion of cyanogen glycoside contained in Sugihiratake mushroom. However, the
human capacity for cyanide detoxification, and for cyanide and thiocyanate toxicities from
food exposure in hemodialysis patients, has not been fully investigated36). Therefore, the further research
is necessary to elucidate the structure of cyanogen glycosides contained in Sugihiratake and
to clarify the further mechanism of encephalopathy onset by cyanogen glycoside intake.
Acknowledgements
We thank Dr. Taku Nagao, Dr. Yukihiro Goda and Dr. Satoshi Kitajima for their useful
suggestions. This study was supported by a grant from the Food Safety Commission, Cabinet
Office, Government of Japan (Research Program for Risk Assessment Study on Food Safety, No
0903).
References
- 1. Gejyo F, Homma N, Higuchi N, et al. A novel type
of encephalopathy associated with mushroom Sugihiratake ingestion in patients with chronic
kidney diseases. Kidney Int. 2005; 68(1): 188–192.
- 2. Suzuki T, Igarashi K, Dohra H, et al. A new omics
data resource of Pleurocybella porrigens for gene discovery. PLoS One. 2013; 8(7): e69681.
- 3. Suzuki T, Amano Y, Fujita M, et al. Purification,
characterization, and cDNA cloning of a lectin from the mushroom Pleurocybella porrigens.
Biosci Biotechnol Biochem. 2009; 73(3): 702–709.
- 4. Kawaguchi T, Suzuki T, Kobayashi Y, et al.
Unusual amino acid derivatives from the mushroom Pleurocybella porrigens. Tetrahedron.
2010; 66(2): 504–507.
- 5. Takano F, Yamaguchi M, Shoda S, Fu ZD, Ohta T.
Toxicological studies on hot water extracts of Pleurocybella porrigens (Pers.:Fr.) in
mice. Natural Medicines. 2005; 59(4): 151–156.
- 6. Smith ADM, Duckett S, Waters AH.
Neuropathological changes in chronic cyanide intoxication. Nature. 1963; 200: 179–181.
- 7. Smith ADM. Cyanide encephalopathy in man? Lancet.
1964; 2(7361): 668–670.
- 8. Funata N, Song SY, Okeda R, Funata M, Higashino
F. A study of experimental cyanide encephalopathy in the acute phase—physiological and
neuropathological correlation. Acta Neuropathol (Berl). 1984; 64(2): 99–107.
- 9. Rachinger J, Fellner FA, Stieglbauer K, Trenkler
J. MR changes after acute cyanide intoxication. AJNR Am J Neuroradiol. 2002; 23(8):
1398–1401.
- 10. Yen D, Tsai J, Wang LM, et al. The clinical
experience of acute cyanide poisoning. Am J Emerg Med. 1995; 13(5): 524–528.
- 11. Wilson J. Cyanide in human disease: a review of
clinical and laboratory evidence. Fundam Appl Toxicol. 1983; 3(5): 397–399.
- 12. Akiyama H, Toida T, Sakai S, et al. Determination
of cyanide and thiocyanate in Sugihiratake mushroom using HPLC method with fluorometric
detection. J Health Sci. 2006; 52(1): 73–77.
- 13. Nagano N, Miyata S, Abe M, et al. Effect of
manipulating serum phosphorus with phosphate binder on circulating PTH and FGF23 in renal
failure rats. Kidney Int. 2006; 69(3): 531–537.
- 14. Obara K, Okawa S, Kobayashi M, Takahashi S,
Watanabe S, Toyoshima I. [A case of encephalitis-type encephalopathy related to
Pleurocybella porrigens (Sugihiratake)]. Rinsho Shinkeigaku. 2005; 45(3): 253–256.
Japanese.
- 15. Kuwabara T, Arai A, Honma N, Nishizawa M. [Acute
encephalopathy among patients with renal dysfunction after ingestion of “sugihiratake”,
angel’s wing mushroom—study on the incipient cases in the northern area of Niigata
Prefecture]. Rinsho Shinkeigaku. 2005; 45(3): 239–245. Japanese.
- 16. Kurokawa K, Sato H, Nakajima K, Kawanami T, Kato
T. [Clinical, neuroimaging and electroencephalographic findings of encephalopathy occuring
after the ingestion of “sugihiratake” (Pleurocybella porrigens), an autumn mashroom: a
report of two cases]. Rinsho Shinkeigaku. 2005; 45(2): 111–116. Japanese
- 17. Kato T, Kawanami T, Shimizu H, et al. [An
outbreak of encephalopathy after eating autumn mushroom (Sugihiratake; Pleurocybella
porrigens) in patients with renal failure: a clinical analysis of ten cases in Yamagata,
Japan]. No To Shinkei. 2004; 56(12): 999–1007. Japanese.
- 18. Nomoto T, Seta T, Nomura K, et al. A case of
reversible encephalopathy accompanied by demyelination occurring after ingestion of
Sugihiratake mushrooms. J Nippon Med Sch. 2007; 74(3): 261–264.
- 19. Eyjólfsson R. Recent advances in the chemistry of
cyanogenic glycosides. Fortscher Chem Org Naturst. 1970; 28: 74–108.
- 20. Singer R. The Agaricales in modern taxonomy. 3rd ed.
J. Cramer Vaduz 1975; 912.
- 21. Spencer PS. Food toxins, ampa receptors, and
motor neuron diseases. Drug Metab Rev. 1999; 31(3): 561–587.
- 22. Knowles CJ. Microorganisms and cyanide. Bacteriol
Rev. 1976; 40(3): 652–680.
- 23. Hasuike Y, Nakanishi T, Moriguchi R, et al.
Accumulation of cyanide and thiocyanate in haemodialysis patients. Nephrol Dial
Transplant. 2004; 19(6): 1474–1479.
- 24. Pettigrew AR, Fell GS. Simplified colorimetric
determination of thiocyanate in biological fluids, and its application to investigation of
the toxic amblyopias. Clin Chem. 1972; 18(9): 996–1000.
- 25. Andersen SL, Nøhr SB, Wu CS, Olsen J, Pedersen
KM, Laurberg P. Thyroglobulin in smoking mothers and their newborns at delivery suggests
autoregulation of placental iodide transport overcoming thiocyanate inhibition. Eur J
Endocrinol. 2013; 168(5): 723–731.
- 26. Wang H, Sekine M, Yokokawa H, et al. The
relationship between new stroke onset and serum thiocyanate as an indicator to cigarette
smoking. J Epidemiol. 2001; 11(5): 233–237.
- 27. Arai A, Silberg J, Kessler M, Lynch G. Effect of
thiocyanate on AMPA receptor mediated responses in excised patches and hippocampal slices.
Neuroscience. 1995; 66(4): 815–827.
- 28. Nielsen EO, Johansen TH, Wätjen F, Drejer J.
Characterization of the binding of [3H]NS 257, a novel competitive AMPA receptor
antagonist, to rat brain membranes and brain sections. J Neurochem. 1995; 65(3):
1264–1273.
- 29. Hawkinson JE, Espitia SA. Effects of thiocyanate
and AMPA receptor ligands on (S)-5-fluorowillardiine, (S)-AMPA and (R,S)-AMPA binding. Eur
J Pharmacol. 1997; 329: 213-221.
- 30. Ross SM, Roy DN, Spencer PS.
β-N-oxalylamino-L-alanine action on glutamate receptors. J Neurochem. 1989; 53(3):
710–715.
- 31. Murphy DE, Snowhill EW, Williams M.
Characterization of quisqualate recognition sites in rat brain tissue using
DL-[3H]alpha-amino-3-hydroxy-5-methylisoxazole-4-propionic acid (AMPA) and a filtration
assay. Neurochem Res. 1987; 12(9): 775–781.
- 32. Nielsen EO, Cha JH, Honoré T, Penney JB, Young
AB. Thiocyanate stabilizes AMPA binding to the quisqualate receptor. Eur J Pharmacol.
1988; 157(2-3): 197–203.
- 33. Baudry M, Monaghan D, Cotman C, Altar CA.
Regional distribution of alpha-[3H]amino-3-hydroxy-5-methylisoxazole-4-propionic acid
binding sites in rat brain: effect of chemical modification of SH- groups in tissue
sections. J Neurochem. 1990; 54: 1682-1688.
- 34. Hall RA, Massicotte G, Kessler M, Baudry M, Lynch
G. Thiocyanate equally increases affinity for two
DL-α-amino-3-hydroxy-5-methylisoxazolepropionic acid (AMPA) receptor states. Mol
Pharmacol. 1993; 43(3): 459–464.
- 35. Shahi K, Baudry M. Increasing binding affinity of
agonists to glutamate receptors increases synaptic responses at glutamatergic synapses.
Proc Natl Acad Sci USA. 1992; 89(15): 6881–6885.
- 36. Cha JH, Makowiec RL, Penney JB, Young AB.
Multiple states of rat brain (RS)-α-amino-3-hydroxy-5-methylisoxazole-4-propionic acid
receptors as revealed by quantitative autoradiography. Mol Phrmacol. 1992; 41(5): 832–838.
- 37. Nessim SJ, Richardson RM. Dialysis for
thiocyanate intoxication: a case report and review of the literature. ASAIO J. 2006;
52(4): 479–481.


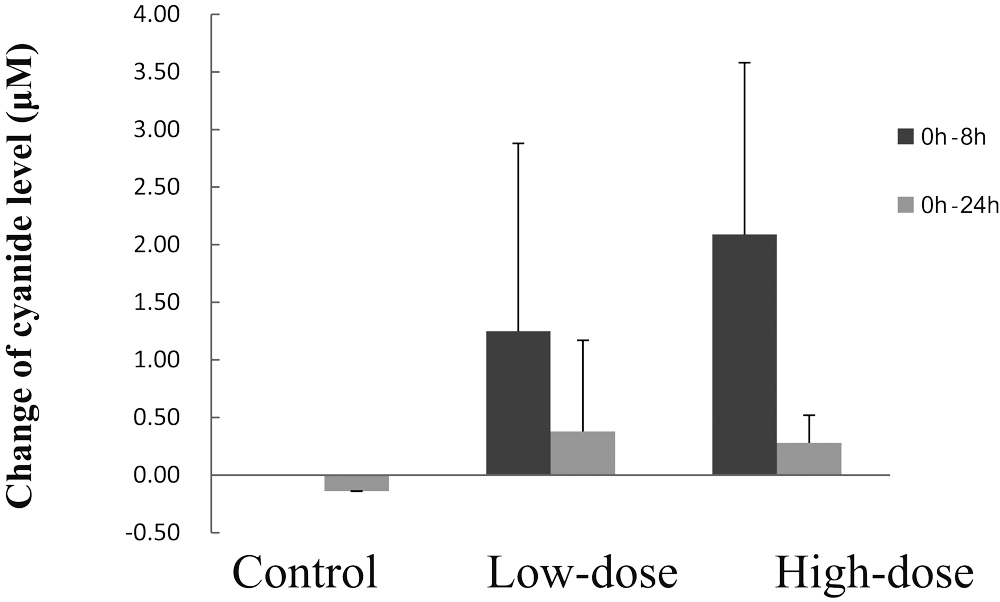
 The bar represents the change of cyanide level in the hemolyzed blood from 0 h to 8 h
after administration of CG
The bar represents the change of cyanide level in the hemolyzed blood from 0 h to 8 h
after administration of CG The bar represents the change of cyanide level in the hemolyzed blood from 0 h to
24 h after administration of CG
The bar represents the change of cyanide level in the hemolyzed blood from 0 h to
24 h after administration of CG
 The bar represents the change of thiocyanate level in the hemolyzed blood from 0 h to
8 h after administration of CG
The bar represents the change of thiocyanate level in the hemolyzed blood from 0 h to
8 h after administration of CG The bar represents the change of thiocyanate level in the hemolyzed blood from 0 h to
24 h after administration of CG
The bar represents the change of thiocyanate level in the hemolyzed blood from 0 h to
24 h after administration of CG