ARTICLE
Raman spectroscopic evaluation of precision of oxygen isotope ratio of carbon dioxide

2023 年 57 巻 2 号 p. 92-99

詳細
2023 年 57 巻 2 号 p. 92-99
We measured the Raman spectra of CO2 fluid at 30 MPa and room temperature (19.1–21.3°C). The spectra showed peaks attributed to the CO2 combining various isotopes such as 12C16O2, 13C16O2, and 12C16O18O. The relative ratio of 12C16O2 to 12C16O18O peaks represents the oxygen isotope ratio of CO2. To evaluate the precision of the peak ratios, we measured the CO2 Raman spectra at different exposure times. We examined the standard deviation (1 σ) of the peak intensity ratios and area ones for 20 measurements at each exposure time. The standard deviations of the intensity ratios and area ones were 2.7 and 3.1%, respectively, at a maximum exposure time of 494 s, conversion to peak intensity of 12C16O2 yields about 2,000,000 counts. The uncertainties are 2.5–3 times greater than expected from the noise of a CCD camera and photon statistics. The oxygen isotope ratios (δ18O) of natural samples have a range of variation of about 16.6%. Compared to that value, the precision we obtained from this study is very small. Raman spectroscopy can be combined with microscopy to analyze areas as small as approx. 1 μm in diameter. Therefore, oxygen isotope measurement using Raman spectroscopy has potential for application to natural samples as a new method for small CO2 fluids such as fluid inclusions.
Fluid inclusions have important information for elucidating fluid circulation system in the Earth. Fluid density has been used to estimate the depth at which a host mineral including the fluid had existed (e.g., Roedder and Bodnar, 1980; Yamamoto et al., 2002). Combined information about the depths and isotopic compositions of fluids can inform whereabout and the origin of fluid circulating us in the Earth’s interior. The isotopic ratios of noble gases (e.g., Burnard et al., 1998), nitrogen (e.g., Yamamoto et al., 2020), and carbon (e.g., Yamamoto et al., 2001) extracted by ablating and crushing deep-derived minerals in vacuum have been used to examine characteristics of the fluids in the fluid inclusions, but they are not desirable as a means of exploring the origin of the fluids because the extracted gases might be mixtures derived from fluid inclusions of several kinds, each with a different origin. Therefore, the isotopic ratios of individual fluid inclusions must be analyzed for the support of accurate estimation of the fluid origin. SIMS (Secondary Ion Mass Spectrometry) and spectroscopy are available for in-situ analyses of the isotopic compositions of fluid inclusions even with diameters of a few micrometers. Unfortunately, SIMS analysis requires solidification of the fluid (Yurimoto et al., 2014), which might lead to rupture and isotopic zoning within the inclusions. Micro-FT-IR (Fourier Transform Infrared) Spectroscopy technique offers some potential for use in isotopic analyses of fluid components in fluid inclusions (e.g., Richter et al., 2002; Sakai et al., 2022). However, a cylindrical analytical region of absorbance analysis is not suitable for the analysis of individual fluid inclusions. Micro-Raman spectroscopy is the only technique for in-situ analysis of the isotopic composition of individual fluid inclusions without changing the fluid state.
As for the isotope analysis using micro-Raman spectroscopy, five reports of the relevant literature have described carbon isotope analysis of CO2 (Arakawa et al., 2007; Li et al., 2018; Yokokura et al., 2020; Cui et al., 2021; Wang et al., 2022). One report describes nitrogen isotope analysis of N2 (Yamamoto and Hagiwara, 2022). CO2-dominant fluids are commonly observed as fluid inclusions in mantle-derived rocks (Andersen and Neumann, 2001). Therefore, the carbon isotope analysis applicable to a fluid inclusion is expected to be a useful tool for investigating the origins of fluids. However, considering the possible existence of fluids originating from a mixture of three or more endmembers, proving the origin of fluids based solely on δ13C is difficult. If we were able to measure not only the carbon isotope ratio of CO2 but also the oxygen isotope ratio simultaneously, then we would be able to distinguish fluid origins more clearly (e.g., Luciani et al., 2022).
In the Raman spectrum of CO2, a peak of 12C16O18O is evident in addition to those of 12C16O2 and 13C16O2, which are used for carbon isotope analysis (Fig. 1). The ratios of the intensity and area of the 12C16O18O and 12C16O2 peaks would indicate the oxygen isotope ratio (δ18O). The range of variation in δ18O presented in geological samples is approximately 16.6% (Holden et al., 2018). Therefore, we investigate whether the oxygen isotope ratio of CO2 can be determined by Raman spectrometry with precision that falls within the range of ±8.3%.
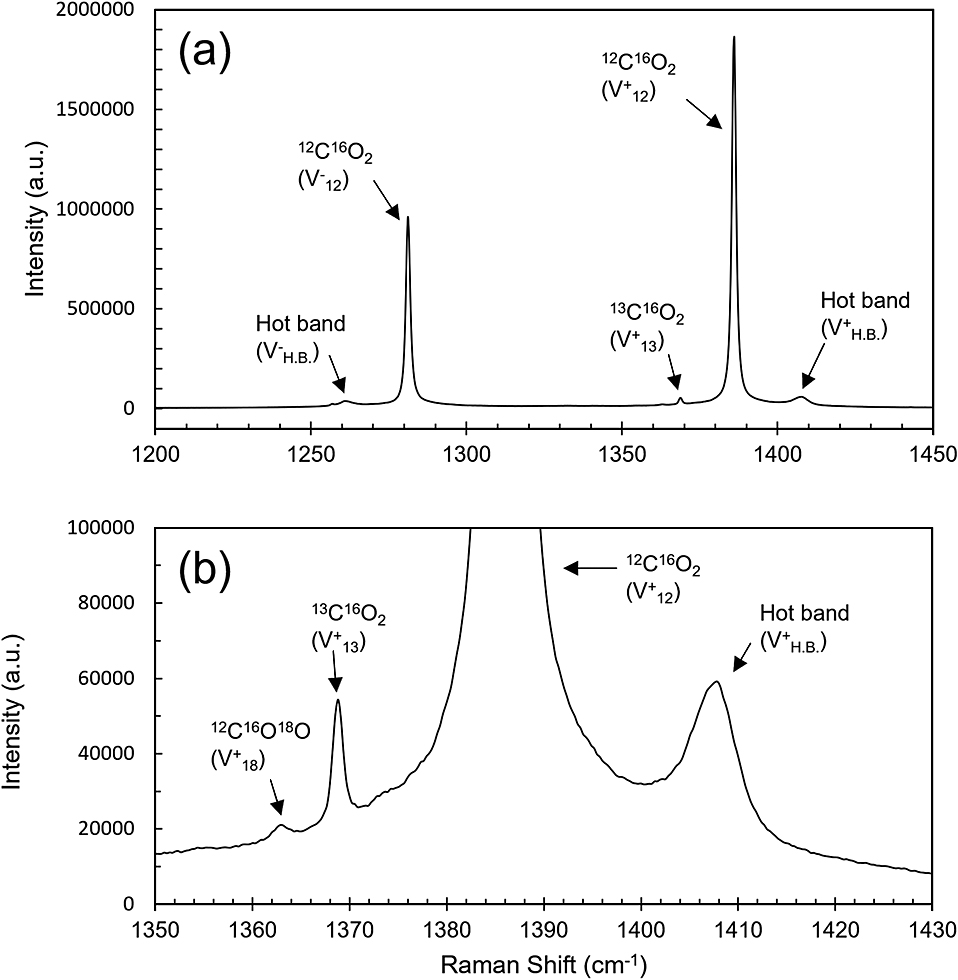
(a) Raman spectrum of CO2 at 30 MPa with accumulation time of 494 s. (b) Enlarged spectrum of (a).
To detect subtle Raman peaks attributable to trace amounts of 18O in CO2, we used CO2 compressed to a high-pressure cell with sapphire windows (PC-400 MS; Syn Corp.) at room temperature. The windows are made of high-purity sapphire glasses. Fluorescence from the windows did not affect the data of this study. First, the cell was filled with liquid-phase artificial CO2 (99.5% purity, Fukuoka Oxygen Co., Ltd). The pressure in the cell was then increased by reducing the volume with an apparatus using a pressurizer. The CO2 pressure was adjusted to 30 MPa because high-pressure CO2 is often found as fluid inclusions in mantle xenoliths, with density of approx. 0.95 g/cm3 (Andersen and Neumann, 2001), which corresponds to about 30 MPa at room temperature. The pressure had been monitored by a PG-2TH digital pressure transducer with a manometer (WGA-650A; Kyowa Electronic Instruments Co., Ltd.). The accuracy of the pressure transducer is ±0.2%. The pressure and temperature during the measurements were 30 ± 0.1 MPa and 19.1–21.3°C respectively.
Micro-Raman spectroscopyRaman spectra were measured using diode-pumped solid-state laser (532 nm; Changchun New Industries Optoelectronics Technology Co., Ltd.) excitation, a 75 cm focal length spectrometer (Acton SP-2750; Princeton Instruments, Inc.), and CCD camera (1650 × 200 pixel, 16 μm width, iVac; Andor Technology). The laser was focused through a 10× objective with super long working distance (T Plan SLWD; Nikon Corp.; N.A. = 0.2). The laser power was 1 W at the source and 0.4 W at the surface of the sapphire window of the high-pressure cell; the pixel resolution of this Raman spectrometer when using a grating of 1800 lines/mm is 0.29 cm–1/pixel at about 1334 cm–1. The spectrum was measured in a single window between 1004.48 and 1483.57 cm–1. This range covers two peaks: the 12C16O18O peak at about 1362 cm–1 and the 12C16O2 peak at about 1368 cm–1. Neon atomic emission lines were used for wavenumber calibration.
The obtained Raman peaks of 12C16O2 and 12C16O18O were fitted to a Voigt curve using Fityk software (Wojdyr, 2010).
From measuring Raman spectra of CO2 at 30 MPa at 10 different exposure times, the obtained intensity of 12C16O2 was found to be approx. 600 to approx. 2,000,000 counts. Figure 1 shows the Raman spectrum of CO2 at a maximum intensity of 12C16O2 as approx. 20,000,000 counts. Two prominent peaks are visible at about 1280 cm–1 (ν–) and 1386 cm–1 (ν+) (Fig. 1a) which are split by Fermi resonance of symmetric stretching and bending vibrations. In Fig. 1b, the small peaks at the wavenumber position lower than that of ν+ (1386 cm–1) are 12C16O18O (1369 cm–1) and 13C16O2 (1363 cm–1) peaks, which are also split by Fermi resonance.
The relative intensity of the peaks to the noise is crucially important for obtaining the proper shape of the peaks (Fig. 2). When the 12C16O2 peak intensity is approx). 600 counts, the 12C16O18O peak was indistinguishable from noise (Fig. 2j). Under the analytical conditions used for this study, the noise effect, especially on the shape of the 12C16O18O peak, is significant when the 12C16O2 peak intensity is less than 7500 counts (Fig. 2h, i). The noise effect becomes less marked in Fig. 2b when the intensity of 12C16O2 peaks exceeds 20,000 counts. Higher intensity of 12C16O2 peak is associated with weaker noise effects. However, the long exposure time necessary to obtain high intensities leads to another difficulty for Raman spectrum analysis. Yamamoto and Hagiwara (2022) reported that when they measured the nitrogen isotope ratio of N2 fluid using the same instrument used for this study, the effects of possible deformation of the spectrometer caused by changes in room temperature appeared on the observation of Raman peaks at exposure times longer than a half hour. Therefore, we acquired no data beyond 2,000,000 counts, or approx. 15 min.

CO2 Raman spectra obtained at various accumulation times. An arrow indicates the 12C16O18O peak (ν+18). The range of the vertical axis is 6% of the height of the 12C16O18O peak.
Table 1 presents the mean and standard deviation of the 12C16O18O/12C16O2 peak intensity ratio (I46/I44) and its area ratio (A46/A44), which were measured 20 times for each intensity range of 12C16O2. The relation between the 12C16O2 intensity and I46/I44 or A46/A44 is shown in Fig. 3.
| Time (s) | Intensity | I46/I44 | 1σ | 1σ (%) | A46/A46 | 1σ | 1σ (%) |
|---|---|---|---|---|---|---|---|
| 1.0 | 3657 | 0.002453 | 0.000760 | 31.0 | 0.002158 | 0.000756 | 35.1 |
| 2.0 | 7522 | 0.001610 | 0.000533 | 33.1 | 0.001816 | 0.000448 | 24.6 |
| 6.0 | 21651 | 0.002062 | 0.000336 | 16.3 | 0.001605 | 0.000267 | 16.6 |
| 10.0 | 37336 | 0.001790 | 0.000162 | 9.0 | 0.001454 | 0.000195 | 13.4 |
| 20.0 | 80763 | 0.001552 | 0.000131 | 8.4 | 0.001387 | 0.000134 | 9.6 |
| 52.0 | 202339 | 0.001532 | 0.000105 | 6.8 | 0.001352 | 0.000121 | 8.9 |
| 77.0 | 293612 | 0.001487 | 0.000113 | 7.6 | 0.001305 | 0.000095 | 7.3 |
| 107.1 | 473329 | 0.001552 | 0.000092 | 5.9 | 0.001197 | 0.000082 | 6.9 |
| 494.0 | 1928076 | 0.001547 | 0.000041 | 2.7 | 0.001172 | 0.000037 | 3.1 |
Note: Data were obtained from 20 measurements of CO2 fluid at 30 MPa at room temperature. The intensities of the 20 data in each intensity region have variation of less than 5%.
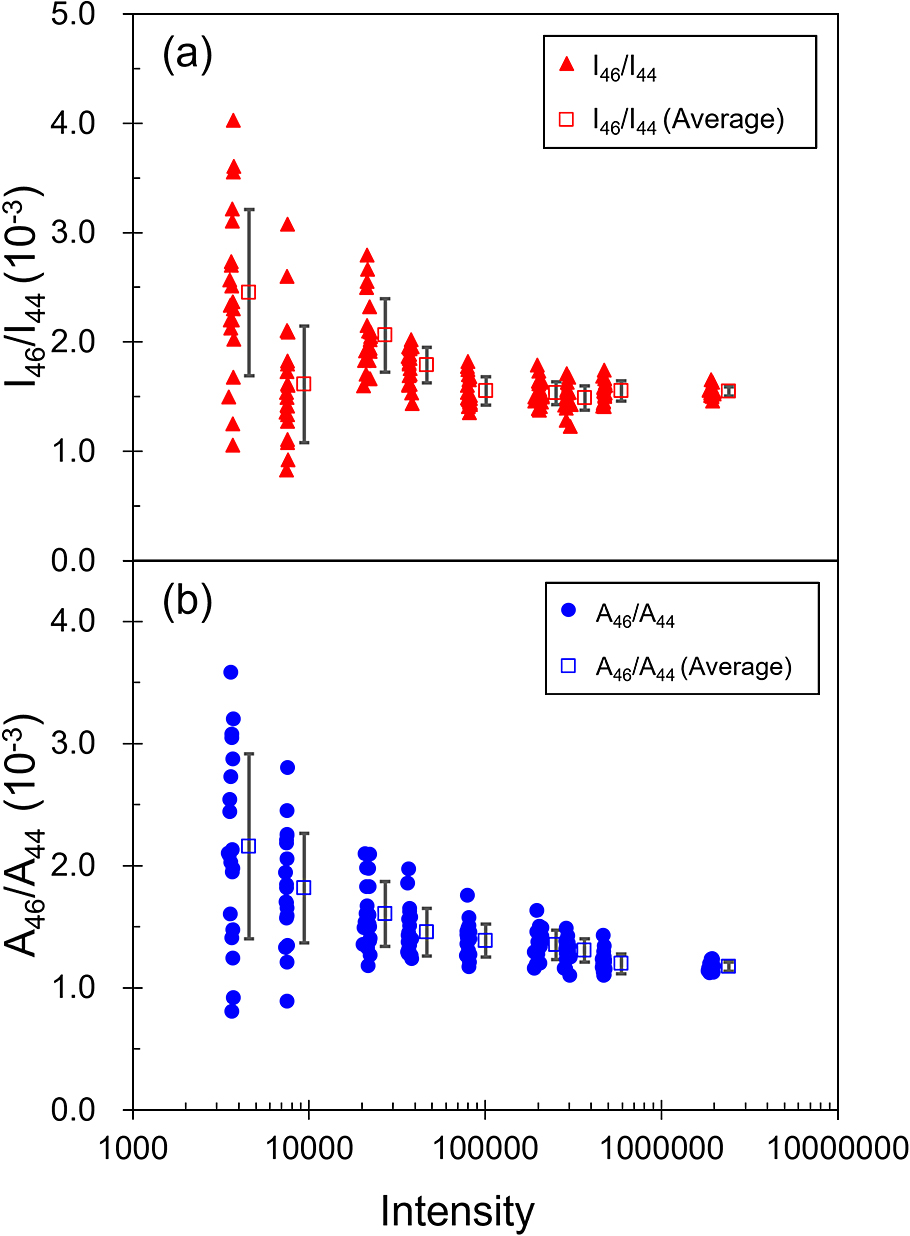
Counts of 12C16O2 Raman peaks of 30 MPa CO2 fluid versus peak intensity ratios (I46/I44) (a) and peak area ratios (A46/A44) (b) of 12C16O18O and 12C16 O2 Raman peaks. Data with error bars in (a) and (b) are means and standard deviations of 20 peak intensity ratios, and peak area ones for each of the nine intensity regions.
The mean values of I46/I44 and A46/A44 decrease with increasing intensity of 12C16O2 (Fig. 3a). The I46/I44 and A46/A44 means with high 12C16O2 intensity sometimes do not overlap with the I46/I44 and A46/A44 means with low 12C16O2 intensity, even considering uncertainties. This tendency is also recognized from the relation between the nitrogen isotope ratio of N2 (14N15N/14N2) and 14N2 intensity obtained by the same instrument used in this study (Yamamoto and Hagiwara, 2022). That earlier report suggests that it results from noise effects on the shapes of low-intensity peaks. The high intensity ratio and area ratio of 14N15N/14N2 in the lower count regions would be attributable to the discrimination threshold between the tail of the smaller 14N15N peak and noise, which were intermingled with each other in the curve-fitting process. On the other hand, in the higher count regions (>100,000 counts for a main peak (14N2) or >700 counts for a small 14N15N peak), the effect of noise on the shape of 14N15N peak becomes negligible. The same can be said for the sent study. When the intensity of 12C16O2 is obtained at 2,000,000 counts, the intensity of 12C16O18O is much higher than 700 counts. Therefore, we were able to obtain reliable I46/I44 and A46/A44 at least in the 2,000,000 counts region. However, the A46/A44 at an intensity of 12C16O2 of 2,000,000 counts is 0.0011720 (37), which is quite different from the I46/I44 of 0.001545 (42). This difference might reflect the difference in the shape of the 12C16O18O and 12C16O2 peaks. When discussing the absolute value of 12C16O18O/12C16O2, it is necessary to correct the measured value using a standard CO2 with a known 12C16O18O/12C16O2.
Figure 4 shows the relation between 12C16O2 intensity and precision (1 σ) of I46/I44 or A46/A44. The precision improves as the 12C16O2 intensity increases, and reached 3.13% and 2.68% for I46/I44 and A46/A44, respectively, at around 2,000,000 counts. These values are less than half the target precision of 8.3%. Therefore, the oxygen isotope analysis technique using a micro-Raman spectrometer would be applicable to geological samples. However, the variation range of δ18O in mantle is about 0.5% (Sharp et al., 2018). Further reduction of precision is expected to be necessary for application of the present method to mantle fluid.
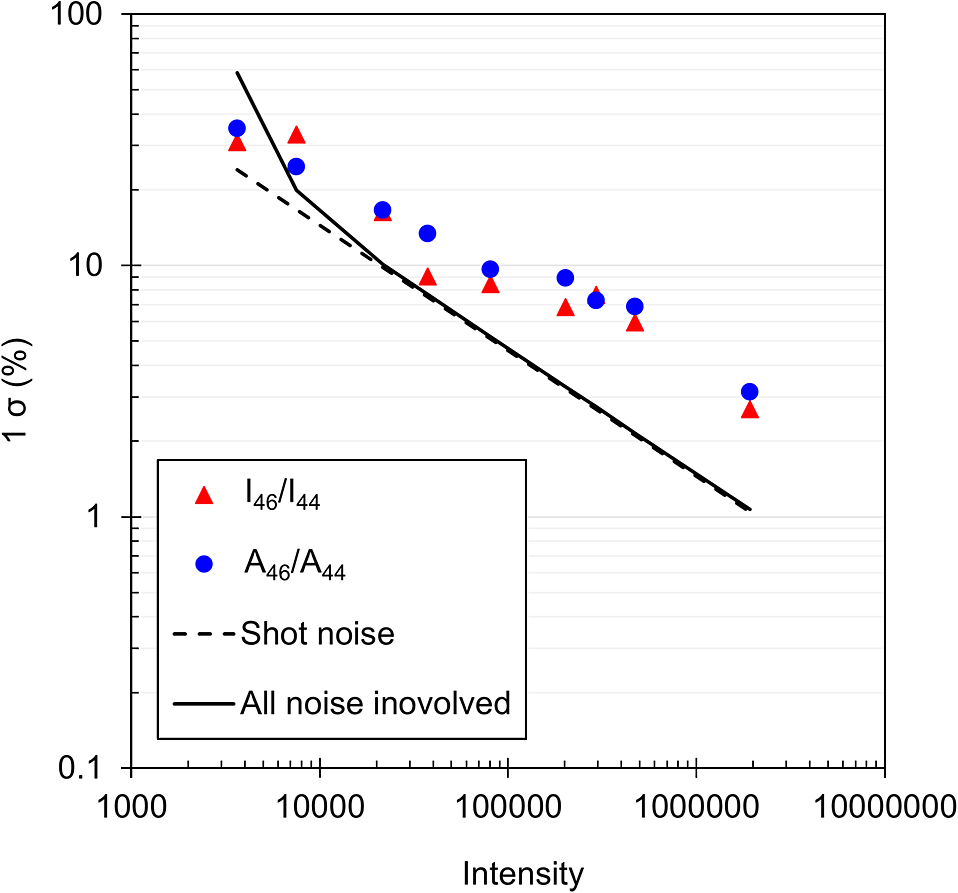
Counts of 12C16O2 Raman peaks versus standard deviations of 20 measurements in various intensity ranges for I46/I44 and A46/A44. The dashed line is the sum of squares of the shot noise (σS2) calculated for each count. The solid line is the sum of the squares of the noise (shot noise (σS2), dark noise (σD2) and readout noise (σR2)) of the CCD camera for each count.
Although the target value of uncertainty was achieved, the reduction rate of uncertainty with increasing intensity was found to be worse than expected.
The uncertainty in 12C16O18O/12C16O2 derived from the noise of the CCD camera (i.e., dark noise σD and readout noise σR) used for this study and that resulting from photon statistics (σS) can be calculated according to the calculation method presented by Yamamoto and Hagiwara (2022). The noise calculation results are presented in Table 2. Similar to the precision of I46/I44 and A46/A44 in the measurements, the calculated noise values decrease with increasing 12C16O2 intensity. However, the rate of decrease in the noise uncertainty is markedly larger than that in the uncertainty of the measurements. The precision of the measurements normalized to the noise uncertainty is presented in Fig. 5. For reference, we included the normalized precisions of 29N2/28N2 obtained by the same instrument (Yamamoto and Hagiwara, 2022). The overall trend is similar; it does not differ by molecule. The findings suggest that the increase in uncertainty dissociation associated with this increase in intensity might depend on the equipment characteristics.
| Time (s) | Intensity | Squared shot noise (σS2) | Squared dark noise (σD2) | Squared read out noise (σR2) | All noise |
|---|---|---|---|---|---|
| 1.0 | 3657 | 23.73 | 0.31 | 52.15 | 57.30 |
| 2.0 | 7522 | 16.55 | 0.21 | 10.65 | 19.68 |
| 6.0 | 21651 | 9.75 | 0.13 | 2.20 | 10.00 |
| 10.0 | 37336 | 7.43 | 0.10 | 1.62 | 7.60 |
| 20.0 | 80763 | 5.05 | 0.06 | 1.06 | 5.16 |
| 52.0 | 202339 | 3.19 | 0.04 | 0.68 | 3.26 |
| 77.0 | 293612 | 2.65 | 0.03 | 0.57 | 2.71 |
| 107.1 | 473329 | 2.09 | 0.02 | 0.42 | 2.13 |
| 494.0 | 1928076 | 1.04 | 0.01 | 0.22 | 1.06 |
Note: All noise is the square root of the sum of the squared shot noise (σS2), squared dark noise (σD2), and squared readout noise (σR2) of a CCD device. σS represents the square root of the signal counts of a peak. σD denotes the dark current arising from thermal energy in the silicon structure of a CCD. σR is defined as the noise in the amplifier on the CCD chip, which converts the stored charge of each pixel into an analog voltage. Values of σD and the σR were obtained from blank measurements of the spectrometer at various exposure times and numbers of accumulation.
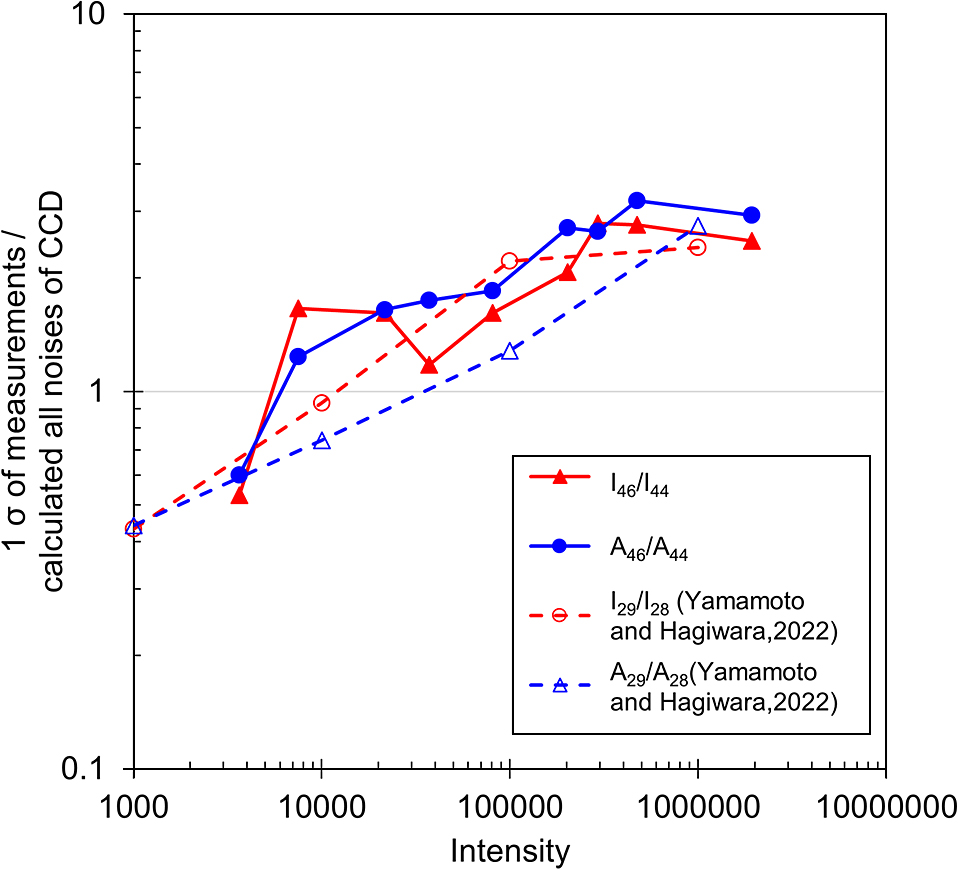
Counts of 12C16O2 Raman peaks versus the standard deviations of 20 measurements in various intensity ranges for I46/I44 and A46/A44 normalized by the calculated all noises of the CCD. For reference, data are shown when measuring 14N15N/14N2 of N2 (Yamamoto and Hagiwara, 2022), which were obtained using the same apparatus used for the present study.
Although, Yamamoto and Hagiwara (2022) proposed the possibility that the discrepancy was attributable to room temperature fluctuations, they were unable to prove it because the room temperature had not been monitored during measurements.
We monitored both the Raman spectra of CO2 and room temperature at 10 s intervals. Figure 6 shows the result representing the relation of room temperature fluctuation with positions, intensities, areas, intensity ratios, and area ratios of two main peaks of CO2 at approx. 1286 cm–1 and approx. 1388 cm–1. 12C16O18O is not visible in short measurements. Therefore, approx. 1282 cm–1 and approx. 1387 cm–1 of 12C16O2, which have stronger intensity, were used. The room temperature fluctuates with a cycle of approx. 25 min. This room temperature fluctuation seems to be linked to the positions, intensities, areas, area ratios, and intensity ratios. During measurement, the intensity ratio and the area ratio varied as much as 16%. If more than several minutes are necessary to take 20 measurements for the precision evaluation of 12C16O18O/12C16O2, then the influence of room temperature fluctuations is unavoidable. Obtaining 2,000,000 counts data for 12C16O2 takes about 3 hours for 20 measurements. Therefore, the main reason for the much higher uncertainty than that expected from the noise calculation, especially at high intensity ranges, is probably room temperature fluctuation. Resulting wavenumber fluctuations change the relative positions of the peaks to the CCD, leading to changes in the shapes of the detected peaks, and thereby changes in both the peak intensity ratios and the area ratios (Arakawa et al., 2007; Yamamoto and Hagiwara, 2022). To reduce the uncertainty, it would be useful to minimize the range of room temperature fluctuation and to complete the measurements quickly.
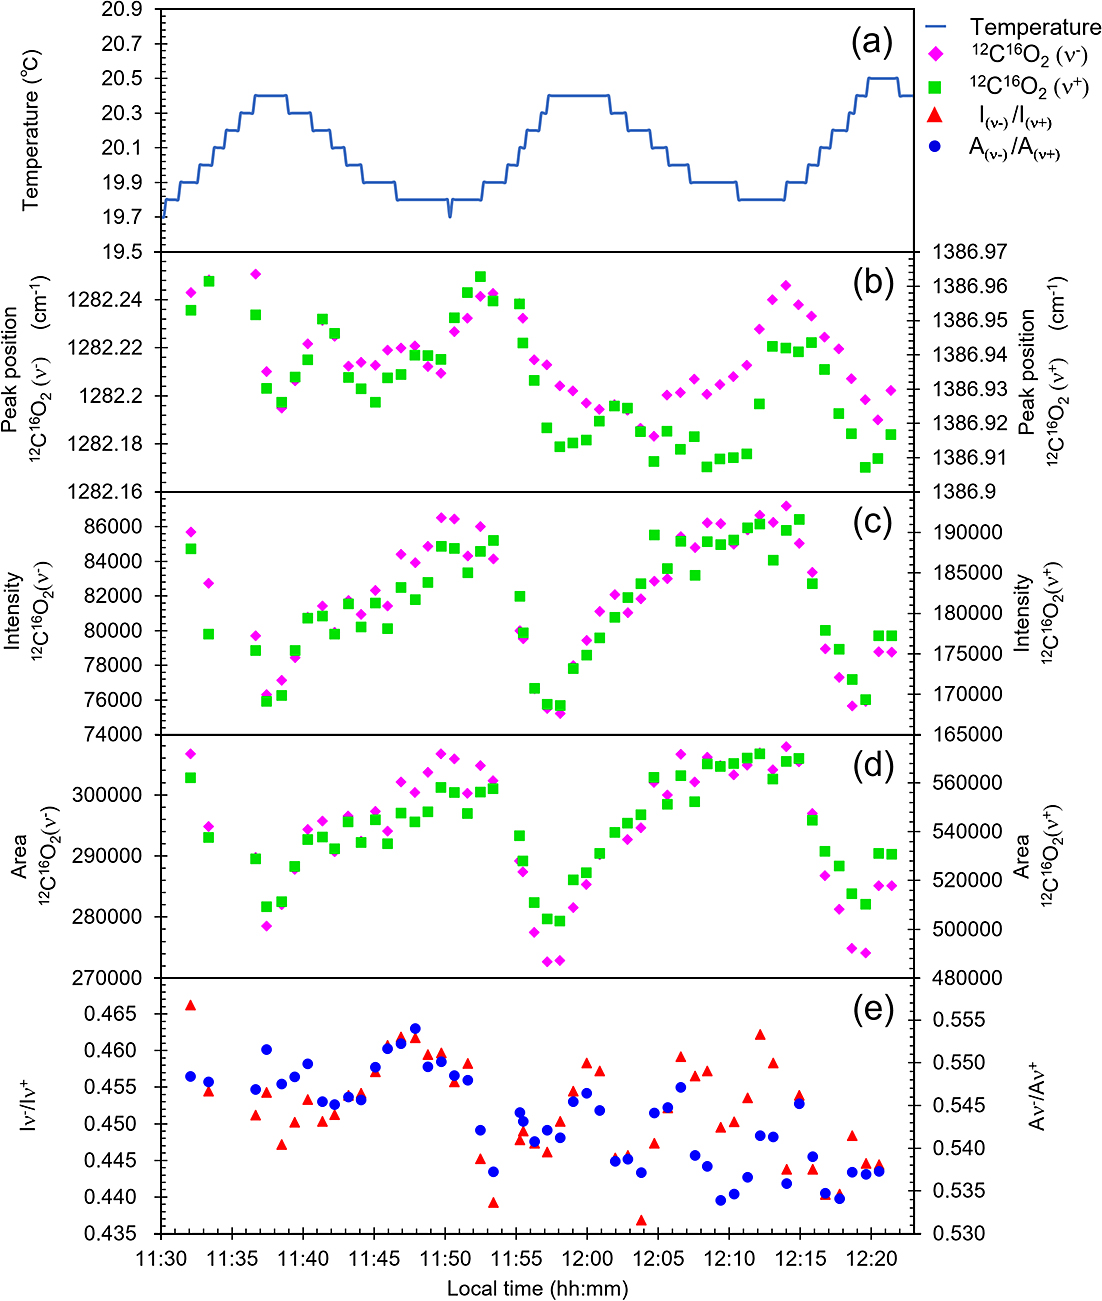
Fluctuations of (a) room temperature, (b) peak position of 12C16O2 (ν–), and 12C16O2 (ν+) (c) intensity of 12C16O2 (ν–) and 12C16O2(ν+), (d) area of 12C16O2 (ν–) and 12C16O2(ν+), and (e) intensity ratios and areas of 12C16O2 (ν–) to 12C16O2 (ν+).
Finally, we summarize some points to apply the Raman mass spectrometry for natural CO2 fluid.
The effects of fluid inclusion sizeThe focal region of the incident laser beam elongated in the direction of the incident beam. Assuming a spherical fluid inclusion with several micrometer diameter, some of the light will leave the inclusion and excite a host mineral in the direction of the incident beam, even if the beam is aimed at the center of the inclusion. On the other hand, the thickness of the fluid-filled area in the high-pressure cell used in this study is more than 1000 μm (Hagiwara et al., 2021a). Therefore, in order to obtain CO2 Raman peaks with high intensities from natural CO2 fluid inclusions, it requires a longer measurement time than in the case of the present study. Yamamoto and Kagi (2008) measured Raman spectra of CO2 in fluid inclusions in mantle xenoliths and obtained 12C16O2 peak at approximately 30–100 counts/sec, resulting in that approximately 10 hours are necessary to obtain intensity of 2,000,000 counts. Measuring inclusions with large size and high CO2 densities would be effective to shorten the measurement time.
The effects of host mineral propertiesA host mineral surrounding inclusions affects the Raman spectrum of the inclusions. Following conditions should be kept in mind when applying the Raman mass spectrometry to natural CO2 inclusions.
1) Fluorescence emitted from a host mineral may mask a Raman spectrum of an inclusion. This effect may be reduced by changing the wavenumber of incident laser.
2) Raman peaks of a host mineral may overlap with those of an inclusion. This could be resolved by subtracting the Raman spectrum of the host mineral, which is obtained separately.
3) The Raman spectrum of an inclusion may depend on the crystallographic orientation of a host mineral, possibly due to the birefringence of the host mineral (Caumon et al., 2020). When measuring an inclusion within a mineral with birefringence, it is important to examine whether it also affects 12C16O18O/12C16O2.
4) The Raman spectrum of an inclusion is affected by the absorption of the incident laser beam by a host mineral. One of the effects is the attenuation of incident laser power. It can be reduced by measuring inclusions close to sample surface. The other is that the increase in internal pressure of an inclusion induced by laser heating may cause apparent fluctuation in 12C16O18O/12C16O2. Pressure change in CO2 causes fluctuation in the wavenumber of CO2 Raman peaks. As with the effect of changes in room temperature, the wavenumber fluctuation caused by the pressure change would change the relative position of the peaks to the CCD, leading to change of the shape of detected Raman peaks. The apparent pressure dependence may be corrected by estimating the CO2 pressure of the inclusion using Raman barometry for CO2 fluid proposed by Hagiwara et al. (2020, 2021b).
We measured the Raman spectra of the CO2 fluid at 30 MPa. The precisions of I46/I44 and A46/A44 of the 12C16O2 and 12C16O18O peaks are, respectively, 0.00117 (37) (2.6%) and 0.001547 (42) (3.1%) in the intensity region of approx. 2,000,000 counts for 12C16O2 peak. These values are much smaller than the variation of δ18O found in nature (approx. 16.6%). The uncertainties of I46/I44 and A46/A44 caused by the CCD noise and photon statistics were calculated as about 1% at 2,000,000 counts for 12C16O2 peak. Therefore, the precision in the measurements has main causes other than the uncertainty derived from the photon detection device. The I46/I44, A46/A44, and wavenumber positions of the relevant peaks were apparently related to room temperature fluctuation. The fluctuation of wavenumber positions would change the relative positions of the peaks to the CCD, leading to variation in I46/I44 and A46/A44. Minimizing temperature fluctuations around a spectrometer and rapid measurements can be expected to improve the precision of I46/I44 and A46/A44.
We thank the two anonymous reviewers who reviewed the manuscript and provided various useful comments.
This study was supported by Grants-in-Aid for Scientific Research (Nos. 20H02000 and 20K20931) and for JSPS Fellows (JP19J21537 and JP22J00081) from the Japan Society for the Promotion of Science.