Abstract
During the early Paleogene (59–50 Ma), several short-term global warming events, known as hyperthermal events, occurred. Negative carbon isotope (δ13C) excursions are a typical proxy for detecting hyperthermal events. During the recovery from hyperthermal events, δ13C values returned toward pre-event levels via scavenging lighter C isotopes from the ocean and sequestrating them within sediments. The biological pump plays a key role in this process. Barium (Ba) is a nutrient-type element primarily transported in the water column by barite formed in microenvironments associated with the decomposition of organic matter, and the Ba-stable isotope ratio is a proxy of biological productivity. In this study, the δ138/134Ba values of bulk sediment samples from Ocean Drilling Program Site 738C in the southern part of the Kerguelen–Heard Plateau were analyzed. Although the samples predominantly comprised calcareous chalk corresponding to the latest Paleocene to early Eocene (56–52 Ma), the Ba isotope ratios of the bulk samples reflected a barite mixture with slight carbonate. Three negative δ138/134Ba shifts were detected, corresponding to the global super-warming event “Paleocene–Eocene Thermal Maximum” at 56 Ma and to two hyperthermal events, known as ETM2 and I1. The changes in δ138/134Ba and δ13C values during PETM were comparable to those reported from the South Atlantic Ocean. Although commonly recognized, the scale of δ138/134Ba changes was smaller in the modest hyperthermal events (ETM2 and I1). Ba stable isotope ratios are a highly effective and powerful tool to reveal the response of the surficial system of Earth during hyperthermal events.
Introduction
The global super-warming event known as the Paleocene–Eocene Thermal Maximum (PETM) occurred around 56 Ma and increased the global sea surface temperature by >5°C (McInerney and Wing, 2011). At the onset of the PETM, isotopically lighter 12C-rich greenhouse gases, such as carbon dioxide and methane, were supplied instantaneously in substantial amounts to the atmosphere-ocean system. They have been recorded as negative carbon isotope (δ13C) excursions (CIEs) in sediment core samples from global ocean areas (McInerney and Wing, 2011). In addition to those of the PETM, frequent small and negative CIE spikes have been observed in early Eocene marine sediment, reflecting transient warming events at smaller scales than that of the PETM; the latter is known as early Eocene hyperthermal events (Westerhold et al., 2018).
After a negative CIE, the recovery of δ13C values towards pre-event values requires approximately 104 to 105 years (McInerney and Wing, 2011; Westerhold et al., 2018). The biological pump associated with an increase in oceanic biological productivity has played a crucial role in the termination of global warming by efficiently removing excess carbon from the atmosphere into sedimentary layers (Yasukawa et al., 2017). Nutrients supplied to the ocean by terrestrial rock weathering, including phosphate, have increased the biological productivity of the ocean surface, thereby accelerating the fixation of atmospheric carbon into sedimentary layers (McInerney and Wing, 2011). This biological pump is closely associated with the behavior of nutrient-type elements, such as barium (Ba). Therefore, elucidating the behavior of nutrient-type elements is critical for revealing the recovery mechanism from hyperthermal events.
Although several nutrient-type elements are transported to the seafloor as organic matter, Ba is transported to the seafloor by different mechanisms. Ba is typically transported as barite during the sequential processes associated with biological production. In reality, Ba is released from sinking organic matter or biogenic remains to a minute region during the decomposition of the organic matter in the water column. This microenvironment supersaturated with respect to barium enables barium and sulfate ions to bond, thus forming barite (Carter et al., 2020 and references therein). In addition, other precipitated minerals, such as carbonate, also play a role in Ba transport (Schoepfer et al., 2015).
The Ba stable isotope ratios of barite are considered to reflect those of the upper ocean water because dissolved Ba is incorporated into organic matter in surface water masses with a similar initial δ138/134Ba composition, and the fractionation factor (selective uptake of lighter Ba isotopes from the seawater) is largely constant in the marine environment (Hsieh and Henderson, 2017; Bridgestock et al., 2018).
Except for the slow growth rate of aragonite, the incorporation of Ba into CaCO3 induces isotope fractionation, with selective uptake of lighter Ba isotopes (Mavromatis et al., 2020). Although little is known regarding isotope fractionation according to species differences, the Ba isotope fractionation between coral aragonite and seawater is constant under conditions of the same species and production area, in that coral aragonite uptakes the lighter isotopes (Hemsing et al., 2018; Geyman et al., 2019).
Therefore, changes in the Ba stable isotope ratios of barite and carbonate minerals are considered to reflect the changes in Ba stable isotope ratios of the upper ocean water; hence, Ba stable isotope ratios can provide key insights into the biological processes underlying Ba export.
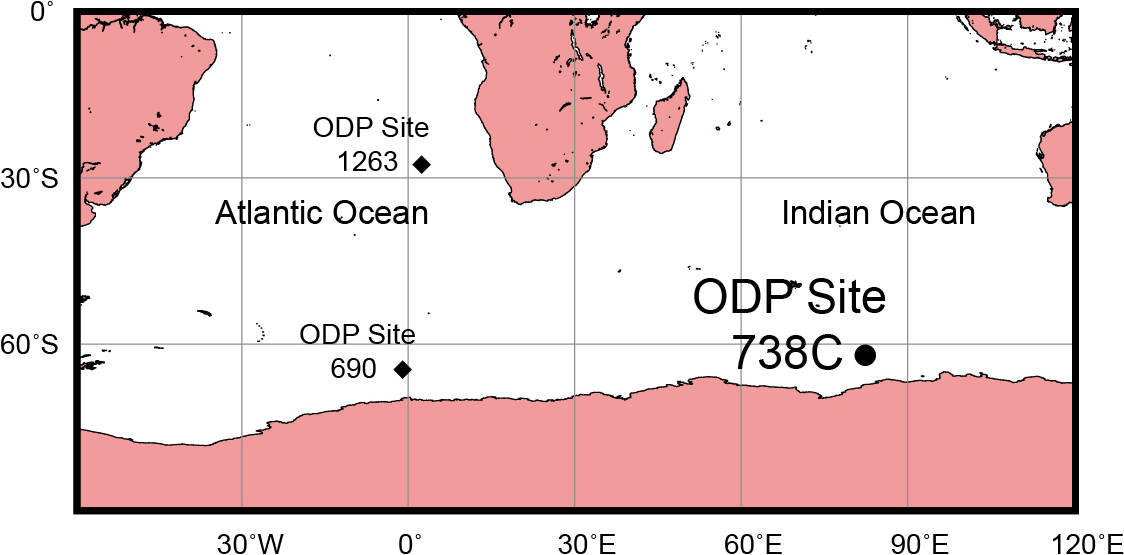
Bridgestock et al. (2019) found that the export production rate changed from the pre-PETM to the recovery phase, according to records of stable isotope ratios of Ba and non-detrital Ba accumulation rates (BAR) from Ocean Drilling Program (ODP) Sites 690 and 1263, which are located in the Atlantic sector of the Southern Ocean and the eastern South Atlantic Ocean, respectively (Fig. 1).
ODP site 738C (Fig. 1), which is less continuous than ODP Sites 690 and 1263 but contains multiple negative CIEs including PETM, and follows the modest hyperthermal, was selected as the third target site. The present study first aimed to clarify whether the Ba stable isotope ratios of ODP Site 738C changed similarly to those of ODP Sites 690 and 1263 before and after the PETM, focusing solely on isotope ratios as event markers. Moreover, this study also aimed to clarify whether similar changes could be observed for smaller-scaled warming events other than the PETM.
Materials and Methods
Sediment samples
The sediment samples analyzed in this study were obtained from ODP Site 738C (62°42.54'S, 82°47.25'E) at a water depth of 2,253 m in the southern part of the Kerguelen–Heard Plateau, in the Indian sector of the Southern Ocean (Fig. 1). Detailed data on the major and trace element compositions, carbon isotope ratios, and the carbonate content of the bulk sediment samples obtained from 235 to 286 m below sea floor (mbsf) have been reported by Yasukawa et al. (2015, 2017). In this study, we performed Ba stable isotope ratio analyses on 19 samples, including those representing the PETM, ETM2, H2, I1, and I2 hyperthermal events, established using the negative CIE spikes (Yasukawa et al., 2017). These 19 samples were selected with the comparison of carbon isotope (δ13C) data to cover pre-, during, and after hyperthermal events. We used the same sample powders that were used to measure the carbon isotope ratio and carbonate concentration by Yasukawa et al. (2017). The preparation method for the sample powder was performed as described by Yasukawa et al. (2017).
To estimate the Ba stable isotope ratios of paleo-seawater from a bulk sediment sample mixed with detrital and other source components, removing detrital and other source components and distinguishing between the effects of biogenic barite and carbonate are necessary. Moreover, the amount of barite in the sediment sample, particularly for the sediment sample shallower than carbonate compensation depth (CCD), was substantially low relative to the primary compositional carbonate minerals. Although, for such samples, the multi-step leaching method, in which several reagents with different liquid properties such as acidity are used to chemically separate the components (Lin et al., 2020), adjusting the leaching conditions for each sample is difficult, as various component and particle sizes exist. Thus, we analyzed the stable Ba isotope ratio of bulk sediment samples using a simple acid decomposition method with no additional leaching treatment and treated data with a careful evaluation of the effects from different components.
Ba stable isotope ratio
TAMAPURE®-AA grade ultra-pure water, 38% hydrofluoric acid (HF), 68% nitric acid (HNO3), and 70% perchloric acid (HClO4) (Tama Chemical Co., Ltd., Kawasaki, Japan) were used without additional purification. TAMAPURE®-AA grade ultra-pure water was used for dilution of the double-spike (DS) standard. The de-ionized water and HCl were purified using a two-bottle Teflon® still from Milli-Q® water (Merck KGaA, Darmstadt, Germany) and EL grade HCl (Kanto Chemical Co., Inc., Tokyo, Japan), respectively.
The Ba stable isotope ratios were analyzed at the Japan Agency for Marine-Earth Science and Technology (JAMSTEC) following the procedures of Miyazaki et al. (2014, 2018). All chemical procedures were performed in a class 100 cleanroom. Approximately 0.01 g of powdered sediment samples were decomposed in closed 7 mL Teflon® perfluoroalkoxy screw cap vials (Savillex®) with approximately 4 M of HCl, followed by digestion in a 1:4 mixture of 12 M of HClO4 and 20 M of HF, then by digestion in a 1:4 mixture of 12 M of HClO4 and 6 M of HCl, and finally dissolved in 5 ml of 6 M of HCl as a stock solution. No visibly undissolved material was observed in the aliquots after centrifugation at 4000 rpm for 20 min. Furthermore, no visible barite particles could be observed in the solution collected from the bottom of the vial under the microscope at a magnification of 400×, except for some zircon and graphite particles of several μm-diameter, which were identified by a Raman spectrometer (RAMANtouch VIS-HP-MAST; Nanophoton, Osaka, Japan) at JAMSTEC.
A sample containing 425 ng of Ba was obtained from the stock solution and mixed with 75 ng of a 130Ba–135Ba DS. The mixed solution was dissolved in 1 mL of 2.5 M of HCl. A 1 mL cation-exchange resin (AG50W-X8, 200–400 mesh, Bio-Rad Laboratories, California, USA) was loaded into a polypropylene column with a polyethylene filter. The Ba fraction was eluted using 6 mL of 2 M of HNO3 after removing the major matrixes using 8.5 mL of 2.5 M of HCl. Column separation was then conducted using the fully automated open-column chemical-separation system “COLUMNSPIDER,” developed by JAMSTEC and HOYUTEC Co., Ltd. (Kawagoe, Japan). The total procedural blank of Ba was <90 pg. We did not perform a blank correction because of the negligible level of the blank.
The Ba isotope ratios were determined using a Thermo Finnigan TRITON TI® thermal ionization mass spectrometer equipped with nine Faraday cup collectors. The 130Ba-135Ba DS-total evaporation (DS-TEV) method was used, as detailed in Miyazaki et al. (2018). The 137Ba/134Ba ratio was calculated to determine the δ137/134Ba value based on the following equation:
δ137/134Ba = [(137Ba/134Ba)smp/(137Ba/134Ba)std – 1] × 1000
(1)
where subscript smp indicates the sample isotope ratio and subscript std indicates the reference isotope ratio (NIST SRM 3104a). Since 138Ba was not measured in this study, the δ138/134Ba value was calculated from the δ137/134Ba value by multiplying with 1.3281 of the kinetic mass-dependent fractionation factor,
δ138/134Ba = δ137/134Ba × 1.3281.
(2)
The mean δ138/134Ba value of the NIST SRM 3104a was 0.00 ± 0.02‰ (2SD, n = 104). The mean δ138/134Ba values in the standard rock reference samples from the Geological Survey of Japan were 0.07 ± 0.01‰ (JB-2; 2SD, n = 9) and 0.25 ± 0.02‰ (JCp-1; 2SD, n = 5). Therefore, the minimum error of the δ138/134Ba value for each sediment sample was assumed to be ±0.02‰ (2SD) and is presented in the discussion of this study.
Results and Discussion
Ba isotope ratio and data evaluation
Table 1 and Fig. 2 present the δ138/134Ba values for samples analyzed in this study, with the δ13C values and CaCO3, Ba, and Al concentration data from Yasukawa et al. (2015, 2017). The δ138/134Ba value for each sample is the average of three to nine measurements made using the DS-TEV method. The standard error for Table 1 is represented as 2σ, determined by the following equation:
Table 1.
δ
138/134Ba and δ
13C values, and Ba and Al concentration values for the bulk core sample of ODP Site 738C
| Sample ID |
Sampling interval |
Bulk sediment |
n |
δ13C (‰ PDB)* |
CaCO3 (wt.%)* |
Ba (ppm)** |
Al (ppm)** |
Ba/Al |
Ba detrital (%)*** |
Detrital effect removed δ138BaNIST3104a (‰)**** |
| Depth (mbsf) |
δ138BaNIST3104a (‰) |
2σ (95.45%) |
| A |
10R-1, 5–6 cm |
273.86 |
0.09 |
<0.01 |
3 |
0.85 |
91 |
1098 |
3927 |
0.3 |
2.68 |
0.10 |
| B |
10R-1, 34–35 cm |
274.15 |
0.07 |
0.01 |
3 |
0.50 |
93 |
2021 |
3551 |
0.6 |
1.32 |
0.07 |
| C |
10R-1, 52–53 cm |
274.33 |
0.07 |
0.02 |
3 |
0.52 |
92 |
1251 |
4165 |
0.3 |
2.50 |
0.08 |
| D |
10R-1, 83–84 cm |
274.64 |
0.04 |
0.01 |
8 |
0.42 |
94 |
1205 |
3092 |
0.4 |
1.92 |
0.04 |
| E |
10R-2, 1–2 cm |
275.32 |
0.08 |
0.02 |
3 |
1.09 |
92 |
1067 |
3560 |
0.3 |
2.50 |
0.08 |
| F |
10R-2, 107–108 cm |
276.38 |
0.07 |
0.01 |
7 |
1.02 |
92 |
923 |
4249 |
0.2 |
3.45 |
0.08 |
| G |
10R-3, 54–55 cm |
277.35 |
0.07 |
0.01 |
4 |
0.77 |
94 |
1560 |
2934 |
0.5 |
1.41 |
0.07 |
| H |
10R-3, 74–75 cm |
277.55 |
0.06 |
0.01 |
4 |
0.58 |
91 |
1447 |
3846 |
0.4 |
1.99 |
0.06 |
| I |
10R-3, 94–95 cm |
277.75 |
0.07 |
0.01 |
5 |
0.81 |
89 |
1279 |
5436 |
0.2 |
3.19 |
0.07 |
| J |
10R-3, 132–133 cm |
278.13 |
0.06 |
0.01 |
8 |
0.65 |
90 |
1767 |
5062 |
0.3 |
2.15 |
0.06 |
| K |
10R-3, 142–143 cm |
278.23 |
0.04 |
0.02 |
4 |
0.55 |
88 |
1980 |
6427 |
0.3 |
2.43 |
0.05 |
| L |
10R-4, 21–22 cm |
278.52 |
0.08 |
0.01 |
4 |
1.01 |
91 |
1007 |
4316 |
0.2 |
3.22 |
0.08 |
| M |
11R-1, 67–69 cm |
284.08 |
0.10 |
0.02 |
3 |
1.42 |
89 |
1441 |
4855 |
0.3 |
2.53 |
0.10 |
| N |
11R-1, 132–134 cm |
284.73 |
0.09 |
0.01 |
6 |
0.61 |
91 |
3291 |
4340 |
0.8 |
0.99 |
0.09 |
| O |
11R-2, 4–6 cm |
284.95 |
0.07 |
0.01 |
9 |
0.13 |
91 |
2527 |
4401 |
0.6 |
1.31 |
0.07 |
| P |
11R-2, 32–34 cm |
285.23 |
0.04 |
0.01 |
4 |
0.03 |
90 |
2379 |
5075 |
0.5 |
1.60 |
0.04 |
| Q |
11R-2, 49–51 cm |
285.40 |
0.02 |
0.01 |
4 |
1.08 |
78 |
4037 |
12671 |
0.3 |
2.35 |
0.02 |
| R |
11R-2, 68–69 cm |
285.59 |
0.05 |
<0.01 |
4 |
2.16 |
90 |
1493 |
4601 |
0.3 |
2.31 |
0.05 |
| S |
11R-2, 140–141 cm |
286.31 |
0.06 |
<0.01 |
3 |
2.31 |
92 |
1099 |
3681 |
0.3 |
2.51 |
0.06 |
* Yasukawa et al. (2017), ** Yasukawa et al. (2015), *** Calculated by the equation of [(Ba/Al detrital) × {1/(Ba/Al)}] using (Ba/Al detrital) = 0.0075, **** Calculated by the equation of {δ138/134BaNIST3104a × (1 – Ba detrital/100)} using δ138/134Badetrital = 0 ‰.

2σ = 2 × (tn–1 × SD/√n)
(3)
where SD is the standard deviation over n measurements of the sample, and tn–1 is the student’s law factor with n – 1 degree of freedom at a 95.45% confidence interval. If the 2σ error was less than ±0.02 (‰), ±0.02 (‰) was selected as the minimum error (cf. Subsection “Ba stable isotope ratio”) and is indicated with error bars in Fig. 2.
The δ138/134Ba values between 286.31 and 284.08 mbsf, including the super-warming phase (PETM), had a range of 0.02–0.10‰, with the minimum value of 0.02‰ at 285.40 mbsf. However, the error bar of the δ138/134Ba value at 285.40 mbsf overlaps with those of the δ138/134Ba values at 285.23 and 285.59 mbsf above and below the minima, respectively (Fig. 2). From 278.52 to 273.86 mbsf, the δ138/134Ba values were in the range of 0.04–0.09‰, and two local minima were observed. One value was 0.04‰ at 278.23 mbsf, and the other was 0.04‰ at 274.64 mbsf, which correspond with the ETM2 and I1 events, respectively (Yasukawa et al., 2017). Although the error bars overlap or touch approximately all data in the samples above and below each of these minima, these appeared to be negative peaks (Fig. 2).
Therefore, a statistical test was performed to determine whether the δ138/134Ba values of the 285.40, 278.23, and 274.64 mbsf samples were significantly different from the δ138/134Ba values of the corresponding upper and lower samples. Statistical tests were performed for minimum value data and samples above and below, excluding samples wherein the error bars did not overlap. The tests were performed on three sample groups. For the sample at 285.40 mbsf, the samples at 285.59 mbsf and 285.23 mbsf were tested (PETM group). For the sample at 278.23 mbsf, the samples at 278.52, 278.13, 277.75, 277.55, and 277.35 mbsf were tested (ETM2 group). For the sample at 274.64 mbsf, the samples 276.38, 275.32, 274.33, and 274.15 mbsf were tested (I1 group).
Two statistical tests, Welch’s and Dunnett’s tests, were performed. All calculations were performed using Excel (Microsoft Corporation, Washington, USA) and BellCurve for Excel (Social Survey Research Information Co., Ltd., Tokyo, Japan). Welch’s test was performed to determine whether a significant difference was present between the minimum value sample data and all other sample data. Notably, multiple tests cannot be performed using only Welch’s test; if at least one sample with no significant difference exists in one group, the group cannot be assessed. Thus, multiple testing corrections should be performed, or other multiple testing methods should be used. Dunnett’s test is a multiple comparison method and allows the comparison of each sample against a reference sample (the minimum value sample in this case).
Both statistical tests required the assumption of normality of the population data. Therefore, we examined the data’s normality using standard sample data and rock standard sample data obtained in this study. The repeated measurements of NIST3104a presented in the histogram are distributed symmetrically around the mean (Fig. S1a). Linearity is also shown in quantile-quantile (Q-Q) plots and compares the measured data distribution with the theoretical normal distribution (Fig. S1b). The Shapiro–Wilk test, which tests the data normality, failed to reject the null hypothesis describing that the data followed a normal distribution for repeated measures, NIST3104a, JB-2, and JCp-1 (Table S1). Therefore, we assumed that the measurement data in this study were normally distributed, and so were the sample population data.
The Welch’s test results (Table S2) showed significance between the sample data, with the lowest value at the 5% significance level (p < 0.05) and all other sample data for all comparison groups. Power is the probability that a type II error (failure to reject the null hypothesis when it is false) does not occur and increases with effect and sample size (see footnote to Table S2). In the ETM2 group, two of the five paired comparisons had less than 70% power. In the PETM and I1 groups, the sample data with the respective minimum was considered significantly different from other sample data in each group. However, in the ETM2 group, although all comparison pairs showed p < 0.05, we determined two pairs to be underpowered and concluded the test’s invalidity.
The Dunnett’s test results (Table S3) showed that the data with the lowest value for each of the PETM and I1 groups were significantly different at the 5% significance level compared to the other sample data for each group, respectively. In the ETM2 group, the sample data of 278.52 m, 277.75 m, and 277.35 m, and the sample data of the minimum value, showed a significant difference at the significance level of 5%. However, there was no significant difference between the 278.13 m and 277.55 m sample data and the minimum sample data.
The two test results indicated that negative peaks with minimum δ138/134Ba values may exist between 285.59 m and 285.23 m, between 278.52 m and 277.75 m, and between 275.32 m and 274.33 m; these negative peaks are likely related to PETM, ETM2, and I1 events, respectively. In the carbon isotope ratio, other H2 and I2 events exist (Yasukawa et al., 2017). However, these events could not be detected in the analytical resolution of this study.
Impact of Ba from different sources
The water depth indicated by ODP Site 738C samples has been shallower than the CCD since the initiation of deposition; therefore, carbonates have remained at the site (Yasukawa et al., 2017). Accordingly, the ODP Site 738C samples in this study were primarily composed of carbonate. Excluding one sample with a 78% CaCO3 concentration (Sample ID “Q”, Core 11R, Section 2, 49–51 cm, 285.4 mbsf), all samples in this study contained a CaCO3 concentration of approximately 88–94% (Table 1).
The presence of detrital components can be examined by the elemental compositions of the bulk core samples. The detrital Ba influence can be estimated using the following formula:
Badetrital (%) = (Ba/Al)detrital × Altotal/Batotal × 100
(4)
using the Ba/Al ratio of the bulk core sample (Bridgestock et al., 2019). Badetrital is the Ba fraction derived from the detrital component, Batotal and Altotal are the concentrations of Ba and Al in the bulk sample, and (Ba/Al)detrital is the reference ratio of the detrital component. Following Bridgestock et al. (2019), the maximum (Ba/Al)detrital reference ratio is 0.0075 for the upper crust, and the global average (Ba/Al)detrital ratio is 0.0037. Based on elemental concentration data from Yasukawa et al. (2015), Badetrital (%) of the bulk core samples in this study ranged from 0.49 to 1.70% when (Ba/Al)detrital = 0.0037 was used, and from 0.99 to 3.45% when (Ba/Al)detrital = 0.0075 was used. The corrected δ138/134Ba values, by subtracting the Badetrital using the (Ba/Al)detrital = 0.0075 and the δ138/134Ba value of the upper continental crust (0.00‰, Nan et al., 2018), revealed slight differences of <0.003 (‰) from the δ138/134Ba value for each bulk sample (Table 1). Fe-Mn oxyhydroxide is also a Ba-hosting phase; however, no correlation was observed between Ba and Mn concentrations in the samples of this study, and any effects related to this phase were absent (Fig. S2). Thus, the influence of the detrital and Fe-Mn oxyhydroxide components in the bulk samples was negligible.
Biogenic barite and biogenic carbonate are probable candidates for the Ba-hosting phases of the sediment samples in this study. Calcareous chalks of the ODP Site 738C consisted of coccoliths and foraminifera and showed a high CaCO3 concentration (Barron and Larsen, 1989), which is presumably the primary hosting phase of Ba. However, the Ba concentration of calcite constituting coccoliths and foraminifera is low. For example, Langer et al. (2009) reported the Ba exchange coefficient (Ba/Ca ratio of coccoliths of Emiliania huxleyi for Ba/Ca ratio of the seawater) is 0.10. Using the Ba/Ca (mmol/mol) ratio of 0.011, which was determined by the equation and the Ba/Ca ratio of natural seawatwer in Langer et al. (2009), the range of Ba concentration in carbonate based on the Ca concentration of each core sample is 12–14 ppm, which is markedly lower than the Ba concentration of the bulk sample (923–4037 ppm). From this result, it can be expected that the primary Ba host is barite, similar to the result for sediment samples from ODP Sites 1263 and 690 (Bridgestock et al., 2019). The percentage of Ba contained in barite, carbonate, and clastic material in the bulk sediment was 95.0–98.6%, 0.3–1.5%, and 1.0–3.5% (Table S4), respectively. Therefore, the Ba stable isotope ratios of the bulk samples presumably reflected a barite and carbonate mixture.
It has been demonstrated that the isotopic fractionation of seawater and barite is constant, at approximately 0.5‰ (Δ138/134Baseawater–barite) (Bridgestock et al., 2019). However, different degrees of fractionation occurs for different coral species, although corals of the same species and habitat will have a certain isotope fractionation value (Hemsing et al., 2018; Geyman et al., 2019). Moreover, the isotopic fractionation of coccoliths and foraminifera in calcareous chalks at ODP Site 738C is poorly understood. Mavromatis et al. (2020) revealed using model calculations that the isotopic fractionation of calcite varied from 0‰ to 1.6‰ (Δ137/134Bafluid–calcite) with the precipitation rate. Although the calcite growth rate of coccoliths and foraminifera in calcareous chalks at ODP Site 738C is not entirely clear, Geerken et al. (2022) showed that the calcite growth rate of benthic foraminiferal Ammonia beccarii was 24 ± 4 nmol/cm2/min. Using this calcite growth rate as the calcite precipitation rate in the model of Mavromatis et al. (2020), the isotopic fractionation is approximately 1.33‰ (Δ138/134Bafluid–calcite), which is larger than that of barite. Thus, we estimated the Ba isotope ratio of barite by excluding the effect of carbonate from the Ba isotope ratio after removing the clastic component from the bulk component, using 1.33‰ for the isotopic fractionation and 0.011 for Ba/Ca ratio (Table S4 and Fig. 2) (The detailed calculation formula is shown in the annotation of Table S4). Although the δ138/134Ba value of barite was higher than that of the bulk sample, the maximum differenece was less than 0.02‰.
Comparison of the Ba stable isotope ratio and the carbon stable isotope ratio
We obtained δ138/134Ba values for the bulk samples from 19 stratigraphic positions in the ODP Site 738C core, ranging in age from the latest Paleocene to early Eocene (56–52 Ma). These 19 stratigraphic positions were selected based on the high-resolution δ13C variation capturing the crucial CIEs. Therefore, despite the small sample size, the δ138/134Ba values captured essential changes. Furthermore, the data demonstrate that changes in the δ138/134Ba values are closely correlated to changes in the δ13C values.
The decreasing trends observed in the δ138/134Ba value are nearly coincident with the negative CIEs (Fig. 2). The data also show broad similarities from the pre-PETM to the post-PETM changes in the δ138/134Ba values reported by Bridgestock et al. (2019) for samples from the South Atlantic (ODP Sites 690 and 1263). Although a δ138/134Ba value corresponding to the early stage of the PETM was missing from the ODP Site 690 sample, Bridgestock et al. (2019) reported that δ138/134Ba values of the ODP Site 1263 sample abruptly dropped from approximately +0.10‰ (at pre-PETM) to +0.03‰, corresponding to the δ13C decreasing trend; the values then recovered accordingly with the δ13C recovery and continued increasing until reaching +0.20‰ after 140 kyr since the onset of the PETM. In this study, the δ138/134Ba values at ODP Site 738C also abruptly dropped to the minimum value (bulk +0.02‰; calculated barite +0.02‰) and gradually increased during the recovery phase of the PETM until reaching +0.10‰ (calculated barite +0.11‰), which is similar to the characteristics of the ODP Site 1263 sample during the PETM. Based on this result, we infer that the scale of change indicated by δ138/134Ba values observed at ODP Site 1263 by Bridgestock et al. (2019) was not limited to a single ocean region but may be global in scale. We could also detect the negative shift of δ138/134Ba in several subsequent early Eocene warming events (equivalent to the ETM2 and I1 events), although their scale of change was smaller than that indicated by the peak of the PETM and the negative CIE trends.
The timing of changes in the δ138/134Ba and δ13C values for the ETM2 and I1 events were nearly consistent. However, for the PETM event, the change in δ138/134Ba values preceded that of the δ13C values. Though the δ138/134Ba value reached a minimum at 285.40 mbsf, the δ13C value did at 285.23 mbsf, and at that depth, the recovery of δ138/134Ba already commenced. The change in δ13C values generally reflects the amount of greenhouse gases dissolved in the ocean, and these gases would have been released at the onset of an event and sequestered during the recovery phase. Therefore, the lag in phase and duration between the δ138/134Ba and the δ13C values observed in this study may indicate the differences in bioproduction efficiency between the recovery phase and the hyperthermal event. However, a massive dissociation of seafloor methane hydrates at the onset of PETM might have released a large amount of Ba into the ocean, as well as greenhouse gases enriched in isotopically light carbon (Dickens et al., 2003). We cannot deny the possibility that the collapse of methane hydrate has an effect, although a more detailed investigation is needed.
Bridgestock et al. (2019) demonstrated that coupling of sediment δ138/134Ba values and non-detrital BARs provides a good proxy of export production in the past ocean. For Site 738C samples with poor continuity, the sedimentation rate is largely uncertain. Therefore, comparing core data from other sites with good continuity and reliable BARs is crucial as a next step. However, our findings suggest that Ba stable isotope ratios are a highly effective and powerful tool for revealing the responses of the surficial system of the Earth during transient hyperthermal events.
Conclusions
The Ba stable isotope ratios (δ138/134Ba values) of bulk samples from 19 stratigraphic positions in the ODP Site 738C core in the Indian sector of the Southern Ocean during the latest Paleocene to the early Eocene (56–52 Ma) were analyzed. High concentrations of Ba could not be fully explained by carbonate as the Ba-host, and instead, it can be inferred that the primary Ba-host was barite and that the Ba stable isotope ratios of the bulk samples reflect those of barite and slight carbonate mixture. Several decreasing trends of the δ138/134Ba values were detected in line with the negative CIEs of the PETM, ETM2, and I1 hyperthermal events. The correlating changes in the δ138/134Ba and δ13C values are a common feature between the South Atlantic and the Indian sector of the Southern Ocean concerning PETM and between multiple early Eocene hyperthermal events in the study site.
Acknowledgments
We thank K. Ikegami and Y. Kuwahara for their constructive discussion. We are also grateful to M. Kanazawa, H. Higuchi, and W. Zhang of JAMSTEC for their support with the laboratory work. This work was supported by the Japan Society for the Promotion of Science KAKENHI [grant numbers JP19K04049, JP20H02678, and JP22K03767].
Competing Interest
The authors declare that they have no known competing interests.
Data Availability
The data that support the finding of this study are provided in the Supplementary Materials.
References
- Barron, J. and Larsen, B. (1989) Proc. ODP, Init. Repts., 119: College Station, TX (Ocean Drilling Program).
- Bridgestock, L., Hsieh, Y.-T., Porcelli, D., Homoky, W. B., Bryan, A. and Henderson, G. M. (2018) Controls on the barium isotope compositions of marine sediments. Earth Planet. Sci. Lett. 481, 101–110. https://doi.org/10.1016/j.epsl.2017.10.019
- Bridgestock, L., Hsieh, Y.-T., Porcelli, D. and Henderson, G. M. (2019) Increased export production during recovery from the Paleocene–Eocene thermal maximum constrained by sedimentary Ba isotopes. Earth Planet. Sci. Lett. 510, 53–63. https://doi.org/10.1016/j.epsl.2018.12.036
- Carter, S. C., Paytan, A. and Griffith, E. M. (2020) Toward an improved understanding of the marine barium cycle and the application of marine barite as a paleoproductivity proxy. Minerals 10, 421. https://doi.org/10.3390/min10050421
- Dickens, G. R., Fewless, T., Thomas, E. and Bralower, T. J. (2003) Excess barite accumulation during the Paleocene–Eocene Thermal Maximum: Massive input of dissolved barium from seafloor gas hydrate reservoirs. Causes and Consequences of Globally Warm Climates in the Early Paleogene 369 (Wing, S. L., Gingerich, P. D., Schmitz, B. and Thomas, E., eds.), 11–23, Geological Society of America. https://doi.org/10.1130/0-8137-2369-8.11
- Geerken, E., de Nooijer, L., Toyofuku, T., Roepert, A., Middelburg, J. J., Kienhuis, M. V. M., Nagai, Y., Polerecky, L. and Reichart, G.-J. (2022) High precipitation rates characterize biomineralization in the benthic foraminifer Ammonia beccarii. Geochim. Cosmochim. Acta 318, 70–82. https://doi.org/10.1016/j.gca.2021.11.026
- Geyman, B. M., Ptacek, J. L., LaVigne, M. and Horner, T. J. (2019) Barium in deep-sea bamboo corals: Phase associations, barium stable isotopes, & prospects for paleoceanography. Earth Planet. Sci. Lett. 525, 115751. https://doi.org/10.1016/j.epsl.2019.115751
- Hemsing, F., Hsieh, Y.-T., Bridgestock, L., Spooner, P. T., Robinson, L. F., Frank, N. and Henderson, G. M. (2018) Barium isotopes in cold-water corals. Earth Planet. Sci. Lett. 491, 183–192. https://doi.org/10.1016/j.epsl.2018.03.040
- Hsieh, Y.-T. and Henderson, G. M. (2017) Barium stable isotopes in the global ocean: Tracer of Ba inputs and utilization. Earth Planet. Sci. Lett. 473, 269–278. https://doi.org/10.1016/j.epsl.2017.06.024
- Langer, G., Nehrke, G., Thoms, S. and Stoll, H. (2009) Barium partitioning in coccoliths of Emiliania huxleyi. Geochim. Cosmochim. Acta 73, 2899–2906. https://doi.org/10.1016/j.gca.2009.02.025
- Lin, Y.-B., Wei, H.-Z., Jiang, S.-Y., Hohl, S., Lei, H.-L., Liu, X. and Dong, G. (2020) Accurate determination of barium isotopic compositions in sequentially leached phases from carbonates by double spike-thermal ionization mass spectrometry (DS-TIMS). Anal. Chem. 92, 2417–2424. https://doi.org/10.1021/acs.analchem.9b03137
- Mavromatis, V., van Zuilen, K., Blanchard, M., van Zuilen, M., Dietzel, M. and Schott, J. (2020) Experimental and theoretical modelling of kinetic and equilibrium Ba isotope fractionation during calcite and aragonite precipitation. Geochim. Cosmochim. Acta 269, 566–580. https://doi.org/10.1016/j.gca.2019.11.007
- McInerney, F. A. and Wing, S. L. (2011) The Paleocene-Eocene Thermal Maximum: A perturbation of carbon cycle, climate, and biosphere with implication for the future. Annu. Rev. Earth Planet Sci. 39, 489–516. https://doi.org/10.1146/annurev-earth-040610-133431
- Miyazaki, T., Kimura, J.-I. and Chang, Q. (2014) Analysis of stable isotope ratios of Ba by double-spike standard-sample bracketing using multiple-collector inductively coupled plasma mass spectrometry. J. Anal. At. Spectrom. 29, 483–490. https://doi.org/10.1039/C3JA50311A
- Miyazaki, T., Kimura, J.-I., Wakaki, S., Vaglarov, B. S. and Haraguchi, S. (2018) Determination of stable isotope ratios of Ba by 130Ba–135Ba double-spike total evaporation method using thermal ionization mass spectrometry (DS-TEV-TIMS). JAMSTEC Rep. Res. Develop. 27, 109–118. https://doi.org/10.5918/jamstecr.27.109
- Nan, X., Yu, H.-M., Rudnick, R. L., Gasching, R. M., Xu, J., Li, W.-Y., Zhang, Q., Jin, Z.-D., Li, X.-H. and Huang, F. (2018) Barium isotopic composition of the upper continental crust. Geochim. Cosmochim. Acta 233, 33–49. https://doi.org/10.1016/j.gca.2018.05.004
- Schoepfer, S. D., Shen, J., Wei, H., Tyson, R. V., Ingall, E. and Algeo, T. J. (2015) Total organic carbon, organic phosphorus, and biogenic barium fluxes as proxies for paleoma-rine productivity. Earth Sci. Rev. 149, 23–52. https://doi.org/10.1016/j.earscirev.2014.08.017
- Westerhold, T., Röhl, U., Donner, B. and Zachos, J. C. (2018) Global extent of early Eocene hyperthermal events: A new pacific benthic foraminiferal isotope record from Shasky rise (ODP Site 1209). Paleoceanogr. Paleoclimatology 33, 626–642. https://doi.org/10.1029/2017PA003306
- Yasukawa, K., Nakamura, K., Fujinaga, K., Machida, S., Ohta, J., Takaya, Y. and Kato, Y. (2015) Rare-earth, major, and trace element geochemistry of deep-sea sediments in the Indian Ocean: Implications for the potential distribution of REY-rich mud in the Indian Ocean. Geochem. J. 49, 621–635. https://doi.org/10.2343/geochemj.2.0361
- Yasukawa, K., Nakamura, K., Fujinaga, K., Ikehara, M. and Kato, Y. (2017) Earth system feedback statistically extracted from the Indian Ocean deep-sea sediments recording Eocene hyperthermals. Sci. Rep. 7, 11304. https://doi.org/10.1038/s41598-017-11470-z