ARTICLE
Evolution of porewater in a Neogene sedimentary formation in the Horonobe area, Hokkaido, Japan: Modeling of burial diagenesis

2023 年 57 巻 5 号 p. 155-175

詳細
2023 年 57 巻 5 号 p. 155-175
Low groundwater flow is essential in impeding radionuclide migration in the geological disposal of high-level radioactive waste (HLW). In the deep subsurface of thick marine sediments, groundwater may actually be ancient seawater altered during deposition and burial, termed “fossil seawater” in this study. In such cases, groundwater flow is extremely slow because it is not affected by infiltration of meteoric water, even after uplift and erosion of strata. Fossil seawater is often found in the deeper parts of the Neogene marine sedimentary Koetoi and Wakkanai Formations of the Tempoku Basin, Horonobe, northern Hokkaido, Japan. Groundwater dating using Cl isotopes and He concentration indicates that this fossil seawater may have barely moved since uplift of the area began. To confirm the low-flow nature of fossil seawater, its chemistry in the Horonobe area and burial diagenesis were investigated by numerical modeling, focusing on the effects of dehydration associated with phase transitions of biogenic silica, smectite interlayer water dehydration, and drainage and upwelling through porosity reduction. Results indicate that groundwater with δ18O values of >0‰, δ2H values of –30‰ to –20‰, and Cl– concentrations of ≤80% lower than that of seawater can be formed during burial without mixing with meteoric water. Groundwater formed during burial in the deeper parts of the Koetoi and Wakkanai Formations may thus have been preserved since uplift, confirming that fossil seawater is of extremely low mobility. The results should contribute to understanding the dilution mechanism of porewater in marine sediments and the selection of suitable site for geological disposal of high-level radioactive waste.
A basic requirement for the safe geological disposal of high-level radioactive waste (HLW) is a slow hydraulic field to ensure that the migration of radioactive elements is inhibited by a low hydraulic gradient or low permeability (NUMO, 2021). Deep, thick marine sedimentary formations often contain “fossil seawater”, which is seawater that entered pore spaces during sedimentation and was altered during burial diagenesis. The presence of fossil seawater indicates that groundwater has not been washed out by recharge, even after uplift with a high hydraulic gradient, and such a site may be a long-term low-flow area. Here, we consider fossil seawater as being altered groundwater that has remained undisturbed by infiltration, uplift, and erosion (Mahara et al., 2006), where successional burial processes have altered the original seawater retained as porewater during deposition.
The main diagenetic processes that modify fluid composition include dehydration and transformation of hydrous minerals (especially clay minerals and biogenic silica), upward fluid flow owing to porosity reduction, formation and dissociation of gas hydrates, bacterial and thermal degradation of organic matter, alteration of volcanic ash and the upper oceanic crust, carbonate recrystallization, and ion filtration due to the semi-permeable nature of clay minerals (e.g., Kastner et al., 1991). Data from seafloor drilling studies in the Nankai Trough and Bering Sea suggest that dehydration of interlayer water associated with the phase transformation from smectite to illite is the leading cause of the lower Cl– concentration in pore water and changes in δ18O and δ2H values (Saffer and McKiernan, 2009; Ijiri et al., 2018; Tremosa et al., 2021). Upwelling due to porosity reduction through burial compaction has been described by a one-dimensional numerical model considering sedimentation rate and porosity changes (Holzbecher, 2002). Upwelling velocities in marine bottom sediments are very low (~10–4 m yr–1; Schrag and DePaolo, 1993). Porewater chemistry may be affected by mixing with upward flow from depths associated with burial diagenesis of sedimentary layers, but quantitative understanding of this is limited.
In Japan, the existence of fossil seawater has been reported in the northern Hokkaido area, the Ishikari area of Hokkaido, and in areas of thick Neogene marine deposits in oil and gas fields in Akita, Yamagata, Niigata, Chiba, and Miyazaki (Sakai and Matsubaya, 1974; Kato and Kajiwara, 1986; Kato et al., 2000, 2011; Maekawa et al., 2006; Ueda et al., 2010; Takahashi et al., 2011; Kato, 2014, 2018, 2020; Muramatsu, 2017). Such saline groundwater is thought to have been formed by alteration of seawater captured in pore spaces during burial diagenesis, through rock–water reactions with silica minerals and organic matter, but quantitative understanding of the formation mechanism is limited to attempts to account for dehydration of biogenic silica (Kai and Maekawa, 2009). The deeper part of the Neogene marine sediment Koetoi and Wakkanai Formations (Horonobe, Hokkaido, Japan) has low fracture connectivity, and fossil seawater is often found with little evidence of seepage of surface water, based on hydrogen isotopic ratios (Ishii, 2018). Fossil seawater in the deeper formations have been shown to have a groundwater age that is much greater than the half-life of 36Cl (3.01 × 10⁵ yr; Phillips, 2013), based on 36Cl/Cl isotopic ratios and dissolved He, suggesting that little movement has occurred, at least since uplift began in the area (Nakata et al., 2018a).
Fossil seawater in the Horonobe area has a Cl– concentration ≤80% lower than that of seawater, and the δ18O values are >0‰, and δ2H values are –30‰ to –20‰, notably different from those of seawater (Teramoto et al., 2006; Amano et al., 2012; Ishii, 2018; Nakata et al., 2018a). Fossil seawater in the Horonobe area is thought to have barely moved since the area was uplifted (Nakata et al., 2018a), so its chemistry is not based on mixing with surface water but rather burial diagenesis. Diatoms, as a form of biogenic silica, include amorphous opal-A and contain water. Opal-A deposited on the seafloor is transformed into opal-CT and quartz in subsequent burial diagenesis. Here, we refer to water contained in opal-A and opal-CT as “silica water” following Kai and Maekawa (2009), who described the relationship between Cl– concentrations and δ18O and δ2H values of fossil seawater by simulating the dehydration of silica water from biogenic silica and the decrease in porosity due to burial compaction of Neogene marine deposits. The lower Cl– concentration of fossil seawater than that of seawater cannot be explained by the maximum burial depth of the Wakkanai Formation, and dehydration from clay minerals must be considered (Kai and Maekawa, 2009). Iodine concentrations and isotopic ratios (129I/127I) in groundwater and rocks in the Horonobe area indicate upward migration of porewater from lower strata during sedimentary basin evolution (Togo et al., 2016).
Although the formation and dissociation of gas hydrates are known in the Japan Sea (e.g., Hiruta et al., 2009; Tomaru et al., 2012), evidence of massive-gas hydrates such as microdolomite mineralization (Snyder et al., 2020) is unknown in the Horonobe area. The total organic carbon content in the Koetoi and Wakkanai Formations decreases with increasing maximum burial depth down to approximately 200 m below the formation boundary, with roughly constant values of about 1 wt% below that depth (Miyakawa et al., 2017). The vitrinite reflectance values of around 0.5% indicate that the upper part of the Wakkanai Formation underwent a transition from diagenesis to catagenesis at the time of maximum burial (JNOC, 1995; Miyakawa et al., 2017). Tephra layers are intercalated with Neogene to Quaternary deposits in the Horonobe area (e.g., Yasue et al., 2006; Niwa et al., 2020). Tephra-derived smectite-rich shear zones, where smectite formed as a result of burial diagenesis of volcanic glass, were found in the Wakkanai Formation (Ishii and Furusawa, 2017). Carbonate veins are rare in the Koetoi Formation, but are widespread in the Wakkanai Formation, which is closely related to the diagenetic process and microbial carbonate reduction (Miyakawa et al., 2017). The Wakkanai Formation has the requisite conditions of both salinity gradient and semipermeability to generate geologic osmotic pressures comparable to observed excess pressures (Takeda et al., 2014, 2019; Takeda and Manaka, 2018), suggesting that Cl– concentration and water isotope ratios can be affected by ion filtration while an extent of the effect may be slight (Coplen and Hanshaw, 1973; Hanshaw and Coplen, 1973; Demir, 1988). These above processes may have modified fluid composition in the Horonobe area during burial diagenesis. However, specific knowledge about these processes, formation and dissociation of gas hydrates, bacterial and thermal degradation of organic matter, alteration of volcanic ash, carbonate recrystallization, and ion filtration due to clay minerals, is limited to the Koetoi and Wakkanai Formations. Hence, this study focused on three main processes: dehydration of biogenic silica, dehydration of clay minerals, and upward fluid flow owing to porosity reduction.
This study of the evolution of porewater chemistry in sedimentary formations aimed to determine whether the chemistry of fossil seawater in the Horonobe area was established during burial diagenesis, as a means of ascertaining whether areas containing fossil seawater are low-flow areas. Numerical analyses were undertaken focusing on the effects of silica water dehydration associated with the phase transition of biogenic silica during burial, the effects of smectite interlayer water dehydration, and drainage and upwelling due to porosity reduction.
The Horonobe area lies in northwestern Hokkaido on the eastern margin of a Paleogene–Quaternary sedimentary basin (the Tempoku Basin; Fig. 1). Sedimentary rocks in the basin comprise, from oldest to youngest, the Haboro (Paleogene sandstone, mudstone, tuffaceous sandstone, and coal-bearing beds), Magaribuchi (Paleogene sandstone and mudstone), Masuporo (Neogene conglomerate, sandstone, and mudstone), Wakkanai (Neogene siliceous mudstones containing opal-CT), Koetoi (Neogene diatomaceous mudstones containing opal-A), Yuchi (fine–medium-grained sandstones), and Sarabetsu (alternating beds of conglomerate, sandstone, and mudstone, intercalated with coal seams) Formations, all of which are overlain by late Pleistocene–Holocene deposits (Fukusawa, 1987). The Wakkanai, Koetoi, Yuchi, and Sarabetsu Formations respectively constitute a series of deep-marine, shallow-marine, and terrestrial deposits unconformably overlying the Masuporo Formation (Fukusawa, 1985; Ishii et al., 2006). In northern Horonobe, Paleogene sedimentary formations are distributed to a depth of ~3600 m (JNOC, 1995). In southern Horonobe, seismic-reflection surveys indicate that Paleogene sedimentary formations are distributed to a depth of ~4000 m in relatively horizontal areas away from the fold axis (Ogura and Kamon, 1992).

Maps showing the location of the Horonobe Underground Research Laboratory (HURL) and boreholes with surface geology. The geological map is based on Sakai and Matsuoka (2015).
Fold tectonic movement in the Horonobe area is considered to have begun at 2.2–1.0 Ma and ended at 0.3–0.2 Ma (Iwatsuki et al., 2009). The Koetoi and Wakkanai formations are thought to have been maximally buried at 1.3–1.0 Ma and then uplifted during anticline formation (Ishii et al., 2008). Consolidation of the Koetoi and Wakkanai formations during sedimentation may have occurred between 13 and 1 Ma. The decrease in porosity of both layers is estimated to be by 50–75%, with a greater degree of consolidation in the Wakkanai Formation due to the phase change from opal-A to opal-CT caused by silica diagenesis (Iwatsuki et al., 2009). A phase change from opal-CT to quartz is observed in the lower Wakkanai Formation (Mitsui and Taguchi, 1977; JNOC, 1995). Borehole investigations in the Hokushin area of northern Horonobe have shown a phase transition from smectite to illite at depth below the Masuporo Formation (JNOC, 1995).
The Discussion section compares porewater chemistry from deep boreholes in the Horonobe area (Fig. 1) with numerical analyses. Boreholes HDB1, HDB2, HDB3, HDB4, HDB5, HDB6, HDB8, HDB9, HDB10, HDB11, HFB1, and SAB2 in the Horonobe area are those where fossil seawater is found in the Koetoi and Wakkanai Formations (Figs. 1 and S1), and for which analyses of compressed extracted water have been summarized by Amano et al. (2012) except for HFB1. Information on HFB1 was not published but is outlined here. HFB1 is a 500-m-deep borehole drilled from the surface at a site adjacent to the Horonobe Underground Research Center (N45°2'33.8'', E141°51'40.6'') during 2021–2022. It includes the formation boundary between the Koetoi and Wakkanai Formations at a depth of ~310 m. Porewater was extracted from cores and analyzed in the same manner as other boreholes as follows. The freshly drilled core was vacuum-packed after lifting to prevent drying and oxidization of the sample. A dry cutter trimmed ~1 cm from the core surface to remove drilling fluid contamination. The trimmed core was placed in a cylindrical vessel and compressed to 300 MPa; porewater was extracted by maintaining the pressure until shrinkage stopped. Cl– concentrations were determined by ion chromatography (Compact Professional IC881; Metrohm, Switzerland). δ18O determination employed an equilibrium pretreatment device for solution (isoFLOW for solution; Elementar, Germany) and isotope-ratio mass spectrometry (isoprime precisION, Elementar, Germany). δ2H values were determined by direct vapor equilibration and laser spectrometry (Wassenaar et al., 2008; Nakata et al., 2018b) using a 45EP Isotopic Water Analyzer (Los Gatos Research, USA). Analytical precision was ±0.1‰ for δ18O and ±0.5‰ for δ2H.
A numerical model was developed to take into account the effects of dehydration associated with a phase transformation from biogenic silica, dehydration of interlayer water in clay minerals, and mixing owing to upward migration of porewater associated with burial diagenesis. Vertical one-dimensional modeling simulated changes in porosity due to burial compaction.
Modeling of geothermal gradient and porosity changeThe geothermal gradient in the area of Neogene strata in northern Hokkaido has been reported as 0.03–0.045°C m–1 (Tanaka, 2004; Tanaka et al., 2004). Based on underground temperatures obtained in a deep-drilling survey on the northern edge and southwestern side of Horonobe, the paleotemperature gradient in the study area is estimated to have been ~0.035°C m–1 (Ota et al., 2011). The temperature at the seafloor below 1000 m depth ranges from ca. 0°C to 4°C (Davies and Guinotte, 2011; Gamo et al., 2014), so the temperature at the top of the model was set to 4°C and the geothermal gradient was set to 0.035°C m–1 (Fig. 2a). The porosity near the seafloor (obtained by deep-sea drilling) is as high as 90% but decreases through mechanical consolidation to 40–60% at the depth of the opal-A/CT phase transition (Compton, 1991). As burial progresses and the opal-A/CT phase transition temperature (depth) is reached, dissolved opal-A is deposited as nanoparticle opal-CT, and porosity decreases as the diatom shell dissolves (Tada and Iijima, 1983; Kai and Maekawa, 2009).

(a) Conceptual diagram of the numerical model and (b) diagram of the structural elements in the unit. The conceptual diagram shows depth profiles of temperature and porosity. Depths and temperatures (red, °C) of phase transition of biogenic silica and clay minerals are shown in (a). Dashed lines indicate the depth (temperature) where phase changes start or end. The phase transition of clay mineral starts at either 40°C or 104°C. Abbreviations: Opl-A, opal-A; Opl-CT, opal-CT; Qz, quartz; Sme, smectite; Ilt, illite. The unit comprised P and R; R comprised M1–M3; M1 comprised W1 and S1; M2 comprised W2 and S2.
Here, as in Kai and Maekawa (2009), the depth profile of porosity was assumed to be described by Eqs. 1 and 2 down to the opal-A/CT transition zone, based on the results of borehole investigations:
| (1) |
| (2) |
and Eq. 3 for greater depths, using the relationship of Magara (1978):
| (3) |
where ϕ is porosity (%) and z is depth (m). The starting temperature of the opal-A/CT transition was set to 45°C (Aoyagi and Kazama, 1980), and the depth at which the opal-A/CT transition is initiated to 1170 m by combining with the geothermal gradient with 4°C at the surface, consistent with estimated past erosion depths of the opal-A/CT transition in the area of 860–1250 m (Ota et al., 2011).
Modeling of sediment compositionDepth dependences of porosity, temperature, and mineral phase transitions are shown in Fig. 2a, and a diagram of the structural elements in the unit is shown in Fig. 2b. Each variable-volume unit comprised a pore (P) and rock (R) section with a 1 m of initial length (Fig. 2b). The rock section comprised minerals 1–3, of which minerals 1 (M1) and 2 (M2) comprise water and silica frames, respectively (Fig. 2b). The pore section was filled with porewater, and the initial porewater had the composition of seawater. Mineral 1 simulated biogenic silica and was assumed to represent the phase change from opal-A to opal-CT and quartz as temperature increased with burial, and silica water (W1) was released into the pore section during the phase change. Mineral 2 simulated smectite as a clay mineral, and interlayer water (W2) was assumed to be released into the pore section during the phase transition to illite (the Smectite/Illite (S–I) transition). Mineral 3 (M3) was a virtual aggregate of other minerals, including detrital illite, quartz, and plagioclase.
The density of the rock section (ρR) was set to 2500 kg m–3 as in Kai and Maekawa (2009). The densities of porewater, silica water, and smectite interlayer water (ρW) were 1000 kg m–3. The density of quartz (ρs1), 2650 kg m–3, was used as the density of the silica framework, S1, of mineral 1 (M1). The Koetoi Formation of diatomaceous mudstone—a Neogene marine deposit in Horonobe—contains 40–50 wt.% opal-A, ≤11 wt.% smectite, 9–17 wt.% illite, 7–10 wt.% quartz, and 3–7 wt.% plagioclase (e.g., Ishii and Furusawa, 2017). The mass ratio of mineral 1 (M1) to the rock section (γM1/R) was therefore set to 40 wt.%. The water content of smectite deep underground is unknown. A fully hydrated smectite contains >9 H2O molecules which correspond to >27 wt.% of water content (Colten-Bradley, 1987), but values of ~45 wt.% have been reported for Na smectite at 97% relative humidity in laboratory tests, which includes interlayer and external water (Fleury et al., 2013). Because mineral 2 (M2) hypothetically contains mineral 3 (M3) in this model, the input parameter of water content for M2 takes the range from about 2.7 to 4.4 times larger than the input values based on the mineral composition of the Koetoi Formation described above. To meet the water content of fully saturated smectite, the water content ratio of smectite (mass ratio of W2 to M2, γW2/M2) was set to either of two values, 10 or 15 wt.%, which values correspond to about 27–44 wt.% and 41–66 wt.%, respectively.
The water contents of opal-A and opal-CT in hydrothermal sinters have been reported (Day and Jones, 2008) as being in the ranges of 2.1–12.1 wt.% total water (average 7.3 wt.%) and 1.0–8.9 wt.% total water (average 5.5 wt.%), respectively. Based on micro–Fourier transform infrared analyses, opal-A contains 1.2–9.8 wt.% (average 6.8 wt.%) molecular water and 0.4–2.4 wt.% (average 1.0 wt.%) silanols, and opal-CT contains 3.8–8.2 wt.% (average 6.7 wt.%) molecular water and 0.1–0.7 wt.% (average 0.2 wt.%) silanols (Day and Jones, 2008). While the range of water content in opal-A overlaps with that of opal-CT among 58 samples with 1689 analyses from 4 locations, each average of total water, molecular water, and silanols in opal-A exceeds each average of opal-CT respectively (Day and Jones, 2008). Because the opal-A/CT phase change is a dissolution-reprecipitation reaction (Stein and Kirkpatrick, 1976; Jones and Renaut, 2007), total water, including molecular water and silanols, is assumed to be involved in the phase transition reaction in this study. The water content of quartz after undergoing diagenesis is ~1 wt.% (Knauth and Epstein, 1975), so the total water contents of silica water in opal-A, opal-CT, and quartz were assumed to be 6.3 (γW1/M1), 4.5, and 0 wt.%, respectively, by subtracting the 1 wt.% water content of quartz. As the initial value of porosity was 80% (Pini), the initial value of the length of mineral 1 (M1) (M1,ini) and the length of mineral 2 (M2, which hypothetically contains mineral 3) (M2,ini) were respectively 0.083 and 0.117 by using Eqs. 4–9.
| (4) |
| (5) |
| (6) |
| (7) |
| (8) |
| (9) |
where Si and Wi,ini are the initial values of the length of the silica framework and water in Mi,ini, respectively. ρMi,ini and ρsi are the initial values of the density of mineral Mi and silica framework Si, respectively. From Eqs. 4–9, the ratio of the length of silica water (W1) to the length of opal-A (M1) was 0.15. A 10 wt.% water content of smectite yielded a ratio of the length of interlayer water (W2) to the length of smectite (M2) of 0.26; with a 15wt.% water content, the ratio of the length of W2 to M2 was 0.39.
Modeling of dehydration of biogenic silicaThe temperature of the phase change of biogenic silica was determined with reference to Aoyagi and Kazama (1980), with the phase change from opal-A to opal-CT beginning at 45°C and that from opal-CT to quartz at 69°C. The transition zone from opal-A to opal-CT in the shallower part of the Wakkanai Formation is 1000–1200 m (Ishii et al., 2011), so a depth range of 200 m from beginning to completion of the opal-A/CT transition was assumed. The decrease in opal-CT and continuous increase in quartz in core samples from boreholes in the area ranges from ~400 m (Mitsui and Taguchi, 1977), so a 400 m range was assumed for the phase change from opal-CT to quartz. The temperature at the end of the opal-A/CT phase change was set to 52°C, and the temperature at the end of the opal-CT/quartz phase change to 83°C. Reaction rates of these mineral transitions were assumed to be constant, and the ratio of the temperature change in each analysis step to the overall reaction temperature range was used as the degree of reaction progress in each step.
Silica particles, such as diatom skeletons including opal-A and opal-CT, have nano-microporosity (e.g., Lynne et al., 2005, 2007), and water is retained on their surfaces as physically adsorbed water, hydrogen-bonded water, or silanol groups (e.g., Iler, 1979; Kim and Lee, 2013). These microstructures have a closed cavity (i.e., a closed environment in which the interior of the void is isolated from the exterior) and mass transfer does not occur (Kondo et al., 1976). Siliceous mudstones in the Horonobe area similarly have closed pores where fossil seawater is retained (Nakata et al., 2018b). Therefore, silica water (W1) was assumed not to mix with surrounding porewater except during the opal-A/CT or opal-CT/quartz phase changes. The opal-A/CT phase change is a dissolution–reprecipitation reaction (Stein and Kirkpatrick, 1976; Jones and Renaut, 2007), and all silica water was released into the pore section during the phase change for each calculation step of the reaction and mixed with surrounding pore water. It was then assumed that an amount of porewater equivalent to the water content of opal-CT would be incorporated into opal-CT as silica water. In the opal-CT/quartz phase change, silica water was released into the pore section and mixed with the surrounding porewater, at a rate depending on reaction progress.
In the model, silica water (W1) was isotopically exchanged with the silica frame (S1) for O, resulting in fractionation according to temperature. The O isotopic fractionation equation reported by Kita et al. (1985) for amorphous silica and water at 34–93°C was used to calculate the fractionation factor. In core samples from seafloor drilling in the Japan Sea (ODP 795; Tamaki et al., 1990), the δ18O values of diatom skeleton opal-A did not vary significantly with depth, with values of 34–38‰; similarly, opal-CT has values of ~25‰ (Yanchilina et al., 2020). Following Yanchilina et al. (2020), we fixed the δ18O value of the silica frame (S1) of opal-A at +36‰ and that of the silica frame (S1) of opal-CT at +25‰. This results in the O isotopic ratios of silica water having values in isotopic-exchange equilibrium with the silica frames.
The silica skeleton comprises Si–O with no H atoms, so the model assumed silica water does not exchange H isotopes with the silica frame or porewater in the pore section. No isotopic fractionation occurred when silica water was released into the pore section during the phase change, and the silica water was dehydrated evenly without distinction between physisorbed water, hydrogen-bonded water, and silanol groups. There are few reports on H isotopic ratios of marine biogenic silica. Knauth and Epstein (1975) heated opal-CTs from submarine drilling core samples in steps and reported dehydration of 0.141 μg water with a δ2H value of –13.1‰ with heating of 1 mg SiO2 from 25°C to 126°C. In the same manner, from 126°C to 228°C, 0.109 μg of water was dehydrated with a δ2H value of –36.4‰; from 228°C to 308°C, 0.077 μg of water was dehydrated with a δ2H value of –60.8‰; and from 308°C to 416°C, 0.113 μg of water was dehydrated with a δ2H value of –74.3‰. In the model, the weighted average of these values, –42.94‰, was used as the δ2H value of silica water in opal.
Modeling of dehydration of clay mineralsIt is documented that Na-montmorillonite dehydration starts as early as 40–81°C (e.g., Koster van Groos and Guggenheim, 1984). Wu et al. (1997) also reported that smectites with dominantly Na and K interlayer cations dehydrated at ~80°C, whereas Ca and Mg cation-dominated smectites dehydrated at >100°C. Ijiri et al. (2018) analyzed core samples from ~800 m depth from IODP Expedition 323 in the Bering Sea, concluding that the main cause of the decrease in Cl– concentration in porewater with increasing depth is the dehydration of interlayer water associated with the S–I transition, which begins at temperatures of ~40°C. The S–I transition is promoted by microbial activity in sediment underlying high-productivity surface seawater but is not promoted when microbial activity is low (Ijiri et al., 2018). Therefore, in the modeling here, the starting temperature of the S–I transition was set to different values for each case. Where the transition started at a low temperature, the initiation temperature was set to 40°C. Temperature is considered to be the main factor controlling the mineral phase change during diagenesis and, based on the average relationship between burial depth, temperature, and mineral phase change in Neogene sedimentary formations in Japan (Aoyagi and Shimoda, 1991), the starting temperature of the S–I transition is considered to be 104°C. Therefore, the starting temperature of the phase change was set to 104°C where the S–I transition does not start at a low temperature. The termination temperature of the S–I transition was set to 137°C, at which the smectite/illite mixed layer dissipated (Aoyagi and Shimoda, 1991).
Interlayer water (W2) in smectite is released not only during the phase transformation to illite but also by increasing effective stress (e.g., Colten-Bradley, 1987), and a decrease in water content from 27 to 20 wt.% has been reported at pressures up to 70 MPa (Hüpers and Kopf, 2012). The dehydration of interlayer water due to increased effective stress was not explicitly considered in the model but was simplified to dehydration owing only to the phase change to illite. Interlayer water was assumed not to dehydrate or to mix with surrounding porewater until the temperature at which the phase change began was reached. After the phase change began, it was assumed that an amount of interlayer water corresponding to the reaction progress was released into the pore section and mixed with porewater.
Where water flow velocities are sufficiently lower than 1 × 10⁻³ m yr–1, an O–H isotopic-exchange equilibrium between smectite and interlayer water is thought to be established (Capuano, 1992). Yeh and Savin (1977) reported δ18O values of 18–22‰ for clay minerals at depths of 1300–5600 m in Neogene marine sediments on the Gulf Coast of Mexico. Therefore, in this model, the δ18O value of the silica frame (S2) of smectite was fixed at +20‰. For the δ18O value of interlayer water in smectite, a δ18O value for water in isotopic-exchange equilibrium with S2 was calculated using the temperature-dependent equation for the isotopic fractionation coefficient between smectite and water at 0–350°C (Sheppard and Gilg, 1996). The H isotopic ratio of S2 was fixed at –55‰ because the δ2H value of smectite was –55‰ at depths shallower than ~1500 m in Neogene sedimentary rocks on the Gulf of Mexico coast (Yeh, 1980). The δ2H value of interlayer water in smectite was calculated for water in isotopic-exchange equilibrium with S2 using the temperature-dependent equation for the isotopic fractionation coefficient at 0–150°C (Capuano, 1992).
Modeling of upwelling owing to burial compactionThe volume of a unit was calculated as the volume per constant unit area, with a resulting unit of m. The length of a unit (L) had an initial value of 1 m, increasing in depth each time a unit was added (Fig. 3a). The analysis sequentially built up the units with variable lengths at each time step, terminating when the depth reached 4000 m (Fig. 3a). Within a single unit, depth was constant, and the value at the top of the unit is the unit depth value. As depth increased, the ratio of pore (P) to unit (L) (P/L ratio) followed the depth function of porosity (Eqs. 1–3). Porewater overflowing from a unit owing to porosity reduction moved upward by one. Porewater overflowing from the topmost unit was discharged from the model system. The relationship between the length (L) of the kth unit and each component at the time step t(j) was determined according to Eqs. 10–15:

(a) Depth increase with unit addition and (b) sequence of water mixing calculations for each unit. In (a), Lk,t(j) is the length of the kth unit at the time step t(j). As the time step proceeds, the unit is added on top. The unit has an initial length of 1 m, decreasing according to the depth function of porosity (Fig. 2a). In (b), at each time step, the length of water is separated according to the water-mixing condition, which may have three possible classifications. Regarding water remaining and upwelling, the mixing of portions of water was calculated respectively as a weighted average.
| (10) |
| (11) |
| (12) |
| (13) |
| (14) |
| (15) |
where Lk,t(j) is the length of unit k at t(j) (m), Pk,t(j) is the length of the pore section of unit k at t(j) (m), and Rk,t(j) is the length of the rock section of unit k at t(j) (m); M1k,t(j) is the length of mineral 1 (M1) in unit k at t(j) (m), and M2k,t(j) is the length of mineral 2 (M2) in unit k at t(j) (m); W1k,t(j) is the length of silica water (W1) in mineral 1 (M1) in unit k at t(j) (m), and W2k,t(j) is the length of interlayer water (W2) in mineral 2 (M2) in unit k at t(j) (m); S1k,t(j) is the length of the silica frame (S1) of mineral 1 (M1) of unit k at t(j) (m), and S2k,t(j) is the length of the silica frame (S2) of mineral 2 (M2) of unit k at t(j) (m).
The length of the pore section of unit k was obtained from the porosity (ϕk,t(j)) function of unit k (Eq. 16).
| (16) |
The depth zk,t(j) of unit k was the sum of the units to be placed above, as determined by Eq. 17:
| (17) |
The porosity of unit k followed the depth profile of porosity ϕ(z), as per Eqs. 1–3:
| (18) |
The condition for completing the analysis was that the thickness of the sedimentary layer reached 4 km (Eq. 19):
| (19) |
The mass balance of porewater was determined as follows. The amount of excess water ΔPk,t(j) overflowing from k owing to the change in length of the pore section through burial is expressed as follows:
| (20) |
The length (volume) of water flowing from unit k – 1 to unit k, Uk,t(j), is the sum of excess water from unit 1 to unit k – 1. Considering only the volume change in the pore section as the source of excess water, Eq. 21 was obtained:
| (21) |
From Eqs. 20 and 21, Eq. 22 was obtained:
| (22) |
Similarly, by adding the release of silica water from opal and interlayer water from smectite, Eq. 22 becomes Eq. 23:
| (23) |
Water mixing was performed unit-by-unit and calculated sequentially from the lowest to highest unit at each time step. At a given time step, in a given unit, the water discharged from the mineral phase owing to phase change or inflow from a subordinate unit mixed with porewater inside the unit as shown in Fig. 3b. Because dehydration of silica water and interlayer water are nano-scale reactions, the extent of mixing with surrounding porewater was limited rather than mixing with all the porewater in a unit. Water released from the phase change and inflow water from the lower unit pushed the porewater to the upper unit. The portion of water remaining in the pore section and that which became inflow water to the upper unit were separated, and their respective mixing was calculated as a weighted average. There were three possible classifications for water-mixing conditions (Fig. 3b) and, in most cases, the sum of water released by the phase change and the inflow from the lower unit was less than the length of the pore space (Fig. 3b), under classification 3. Classification 1 is the condition where the length of dehydration water from minerals exceeded the length of the pore space; in classification 2, the total of water released by the phase change and inflow from the lower unit was larger than the length of the pore space.
Parameter summaryParameters for water chemistry are summarized as follows. The Cl– concentration in seawater initially filling the pore section was set to 545.9 mM (ca. 19400 mg L–1), and both δ18O and δ2H values were set to 0‰. The Cl– concentration in silica water was set to 0 mM, and δ18O and δ2H values were those for isotopic-exchange equilibrium with S1 (according to temperature). The water contents of opal-A and opal-CT were set to 6.3 and 4.5 wt %, respectively. The Cl– concentration in smectite interlayer water was 0 mM, and δ18O and δ2H values were those for isotopic-exchange equilibrium with S2. The water content of smectite was set to either 10 or 15 wt.% for cases 1 and 2, respectively (Table 1). Cases 1 and 2 are based on a situation in which active microbial activity causes a smectite phase change in a low-temperature environment, whereas Case 3 assumes microbial inactivity with the smectite phase change occurring at a deeper level. Sensitivity analyses in Supplementary material showed that when the S-I transition occurs only deeper depth below the opal-A/CT/quartz transition, the water content of M2 showed relatively small sensitivity on Cl– concentration and water isotopes in depth from 1–2 km, where most of the observation data are located, which will be discussed in Subsection “comparison with porewater chemistry” in Section “Discussion”. Accordingly, the case for the smectite phase change occurring at a deeper level was set in just one case, Case 3. In cases 1 and 2, the S–I transition begins at 40°C, whereas it begins at 104°C in Case 3. The water content of smectite was 10 wt.% in Case 1, 15 wt.% in Case 2, and 10 wt.% in Case 3.
Analytical cases
| Case No. | Differences between cases |
|---|---|
| 1 | S–I transition starts from 40°C. Water content of smectite is set as 10 wt.%. |
| 2 | S–I transition starts from 40°C. Water content of smectite is set as 15 wt.%. |
| 3 | S–I transition starts from 104°C. Water content of smectite is set as 10 wt.%. |
Analytical results for Cl– concentration and δ18O and δ2H values of porewater extracted from HFB1 cores by compression are shown in Table 2. The Cl– concentration and water isotope ratios continuously changed with depth except for about 100 m. The changes in Cl– concentration and water isotope ratios were well correlated, increasing from the surface to about 100 m depth, decreasing slightly from about 180 m depth to about 310 m depth, and increasing again to about 500 m depth. The depth at which these concentrations change from decreasing to increasing is near the formation boundary between the Koetoi and Wakkanai Formations (ca. 310 m). The δ18O values greater than 0‰ indicate that the depth of distribution of the fossil seawater is from about 400 m depth and deeper. The corresponding δ2H values range from –30‰ to –20‰, which is consistent with the δ2H values of fossil seawater found in the Koetoi and Wakkanai Formations in this area (Ishii, 2018).
Analytical results for Cl– concentration δ18O and δ2H of porewater from HFB1 cores
| Sample name | Depth (mbgl) | Cl (mg L–1) | δ18O (‰) | δ2H (‰) |
|---|---|---|---|---|
| HFB-1_25m | 24.45–24.85 | 510 | –9.0 | –64 |
| HFB-1_37m | 36.35–36.75 | 1800 | –6.4 | –58 |
| HFB-1_50m | 49.60–50.00 | 2600 | –4.3 | –51 |
| HFB-1_57m | 56.60–57.00 | 2900 | –3.7 | –49 |
| HFB-1_69m | 69.18–69.58 | 3000 | –3.0 | –46 |
| HFB-1_77m | 77.00–77.40 | 3200 | –2.7 | –44 |
| HFB-1_84m | 83.70–84.00 | 3000 | –3.1 | –47 |
| HFB-1_95m | 95.28–95.68 | 3400 | –2.7 | –45 |
| HFB-1_110m | 109.60–110.00 | 5000 | –1.1 | –37 |
| HFB-1_123m | 123.05–123.35 | 4600 | –1.2 | –39 |
| HFB-1_131m | 130.40–130.80 | 4400 | –1.3 | –40 |
| HFB-1_141m | 141.00–141.37 | 3900 | –1.5 | –40 |
| HFB-1_147m | 146.30–146.70 | 3600 | –2.1 | –42 |
| HFB-1_156m | 156.28–156.68 | 3700 | –1.8 | –42 |
| HFB-1_169m | 168.60–168.97 | 3700 | –1.8 | –42 |
| HFB-1_176m | 176.05–176.43 | 4100 | –1.4 | –41 |
| HFB-1_184m | 184.25–184.65 | 3700 | –1.5 | –41 |
| HFB-1_198m | 198.10–198.50 | 3900 | –1.8 | –42 |
| HFB-1_208m | 208.11–208.51 | 3700 | –1.9 | –42 |
| HFB-1_219m | 219.00–219.40 | 3800 | –2.2 | –42 |
| HFB-1_230m | 230.50–230.84 | 3600 | –2.4 | –42 |
| HFB-1_239m | 239.16–239.46 | 3700 | –2.3 | –43 |
| HFB-1_250m | 250.25–250.70 | 3700 | –2.4 | –43 |
| HFB-1_259m | 259.60–260.00 | 3500 | –2.8 | –44 |
| HFB-1_271m | 271.25–271.65 | 3200 | –3.0 | –45 |
| HFB-1_280m | 280.60–281.00 | 3500 | –2.8 | –45 |
| HFB-1_288m | 288.25–288.91 | 3300 | –2.9 | –45 |
| HFB-1_298m | 298.34–298.74 | 3400 | –3.1 | –44 |
| HFB-1_310m | 310.10–310.50 | 3200 | –3.2 | –46 |
| HFB-1_317m | 317.45–317.85 | 3500 | –2.9 | –44 |
| HFB-1_330m | 330.00–330.35 | 3800 | –2.5 | –42 |
| HFB-1_339m | 339.42–339.82 | 3800 | –2.7 | –43 |
| HFB-1_350m | 350.20–350.60 | 4400 | –1.9 | –39 |
| HFB-1_359m | 359.30–359.70 | 4200 | –1.6 | –38 |
| HFB-1_369m | 369.55–370.00 | 5100 | –1.2 | –37 |
| HFB-1_381m | 381.17–381.57 | 5700 | –0.8 | –35 |
| HFB-1_387m | 387.17–387.54 | 5200 | –0.6 | –33 |
| HFB-1_399m | 399.60–400.00 | 6000 | –0.1 | –33 |
| HFB-1_411m | 411.00–411.33 | 7400 | +1.2 | –29 |
| HFB-1_421m | 421.06–421.45 | 7400 | +0.9 | –28 |
| HFB-1_429m | 429.30–429.74 | 8100 | +1.5 | –26 |
| HFB-1_440m | 440.20–440.60 | 8700 | +2.0 | –24 |
| HFB-1_450m | 450.30–450.79 | 8800 | +1.8 | –25 |
| HFB-1_459m | 459.00–459.49 | 8900 | +1.7 | –24 |
| HFB-1_472m | 472.00–472.40 | 9000 | +1.9 | –24 |
| HFB-1_479m | 479.60–480.00 | 9600 | +2.4 | –22 |
| HFB-1_488m | 488.60–489.00 | 9400 | +2.1 | –22 |
| HFB-1_499m | 499.20–499.60 | 10100 | +2.5 | –22 |
The number of time steps at the end of the analysis for cases 1, 2, and 3 were 15875, 16761, and 15093, respectively. The depth profiles of unit length (L), rock length (R), and pore length (P) at the time of completion are shown in Fig. 4. Depth profiles of pore length are the same among cases 1–3. Decreases in rock lengths for cases 1 (Fig. 4a) and 2 (Fig. 4b) started at a depth of 1028 m according to the S–I transition, and that for Case 3 (Fig. 4c) started at 1170 m owing to the dehydration of opal-A. Depth profiles of Cl– concentration and δ18O and δ2H values for cases 1–3 are shown in Fig. 5. In the model, the phase change from opal-A to opal-CT began at 1170 m depth and continued to 1370 m depth (Fig. 2a). The phase change from opal-CT to quartz began at 1857 m depth and continued to 2257 m depth. In cases 1 and 2, the S–I transition began at 1028 m depth and continued to 3800 m depth. In Case 3, the transition began at 2857 m depth and continued to 3800 m.

Depth profiles for unit length (L), rock length (R), and pore length (P) for cases 1–3. Profiles correspond to those at the time of analysis completion.

Calculated depth profiles of Cl– concentration and δ18O and δ2H values of porewater for cases 1–3 at the time of analysis completion.
In Case 1, the Cl– concentration decreased from ~920 m depth owing to the dehydration of interlayer water in smectite. A further decrease was observed from ~1070 m depth because of the dehydration of interlayer water from smectite and silica water associated with the phase change from opal-A to opal-CT. This effect peaked at about 1230 m and continued to a depth of ~1370 m. Because the amount of dehydration associated with mineral phase changes at each time step was often small compared to the amount of porewater, the effect of dehydration on the units one above reached at the next time step (Fig. 3b). Porosity changes per time step were also often small compared to porewater volume, so these effects spread upward slowly. As a result, the Cl– concentration continued to decrease gradually in the temperature range where the dehydration reaction occurred, and the affected depth was limited. In the units below the temperature range of the dehydration reaction, the Cl– concentration gradually increased due to the mixing with the upward flow with relatively high Cl– concentration from the below units where the dehydration reaction did not occur. From ~1650 m depth, the effect of silica water dehydration due to the opal-CT/quartz phase transition peaked at ~2160 m depth and continued to ~2260 m. The effect of dehydration of interlayer water from smectite peaked at ~3800 m depth. The Cl– concentration was ~4370 mg L–1 at a depth of ~1230 m, where the influence of dehydration of opal-A was greatest, and δ18O and δ2H values were +4.3‰ and –29‰, respectively. At a depth of ~2160 m, where the influence of dehydration of the opal-CT was greatest, the Cl– concentration was ~5630 mg L–1, and δ18O and δ2H values were +1.4‰ and –26‰, respectively. At a depth of ~3800 m, where Cl– was most diluted by the dehydration of smectite, the Cl– concentration was ~4740 mg L–1, with δ18O and δ2H values of +5.2‰ and –26‰, respectively.
For Case 2, the Cl– concentration decreased from ~800 m depth owing to dehydration of interlayer water in smectite. A further decrease occurred from ~950 m depth owing to dehydration of silica water associated with the phase change from opal-A to opal-CT, in addition to dehydration of interlayer water from smectite. This effect peaked at ~1110 m depth and continued to ~1370 m. From ~1420 m depth, the effect of silica water dehydration on the opal-CT/quartz phase change peaked at ~1900 m depth and continued to ~2260 m depth. The effect of dewatering interlayer water from smectite peaked at ~3800 m depth. The Cl– concentration at ~1110 m depth, where the influence of dehydration of opal-A was greatest, was ~4000 mg L–1, with δ18O and δ2H values of +3.7‰ and –27‰, respectively. At a depth of ~1900 m, where the influence of dehydration of opal-CT was greatest, the Cl– concentration was ~3570 mg L–1, with δ18O and δ2H values of +1.5‰ and –28‰, respectively. At 3800 m, where the Cl– concentration was most reduced by dehydration of smectite, the Cl– concentration was ~2140 mg L–1, with δ18O and δ2H values of +6.6‰ and –31‰, respectively.
For Case 3, the Cl– concentration decreased from ~1030 m depth owing to dehydration of silica water associated with the phase change from opal-A to opal-CT. This effect peaked at ~1200 m depth and continued to 1370 m. From ~1590 m depth, the effect of silica water dehydration on the opal-CT/quartz phase change peaked at ~1960 m depth and continued to ~2260 m depth. The effect of dehydration of interlayer water from smectite was observed from ~2440 m depth, peaking at ~3800 m. The Cl– concentration at ~1200 m depth, where the influence of dehydration of opal-A was greatest, was ~7640 mg L–1, with δ18O and δ2H values of +4.0‰ and –26‰, respectively. At a depth of ~1960 m, where the influence of dehydration of opal-CT was greatest, the Cl– concentration was ~11770 mg L–1, with δ18O and δ2H values of +0.7‰ and –17‰, respectively. At 3800 m, where the Cl– concentration was most reduced by dehydration of smectite, the Cl– concentration was ~1430 mg L–1, with δ18O and δ2H values of +7.7‰ and –35‰, respectively.
For Case 1, dehydration of smectite interlayer water at ~920 m depth was due to the dehydration reaction at 1028 m. The depth difference between 920 and 4000 m can be considered as the distance that dehydration water moved upward by the end of the analysis. The sedimentation rates of 10–5–10–3 m yr–1 on continental shelves such as the Japan Sea and the Nankai Trough (Oba et al., 1991; Moore and Vrolijk, 1992; Tromp et al., 1995) were reported. Especially on ODP site 795 in the Japan Sea, the sedimentation rates of 2.9–7.7 × 10⁻⁵ m yr–1 (average rate of 5.3 × 10⁻⁵ m yr–1) were reported (Tamaki et al., 1990). Based on the average rate of 5.3 × 10⁻⁵ m yr–1, the sedimentation rate applied would require a depositional period of ca. 5.6 × 10⁷ yr from 1028 to 4000 m depth. Porewater traveling a distance of 3080 m during this time would have an average velocity of 5.5 × 10⁻⁵ m yr–1. This velocity is comparable to the upwelling velocity estimated from analysis of δ18O depth profiles from DSDP site 576 in the western Pacific (~10–4 m yr–1; Schrag and DePaolo, 1993). Similarly, the average velocity of upwelling estimated from the dehydration of silica water associated with the opal-CT/quartz phase change at a depth of ~1650 m was 5.9 × 10⁻⁵ m yr–1, slightly higher than the velocity of upwelling from a depth of ~1000 m. These upwelling velocities are sufficiently low, relative to the migration velocity (10–3 m yr–1) for O–H isotopic-exchange equilibrium between smectite and interlayer water to be established (Capuano, 1992; O’Neil and Kharaka, 1976). Assuming that upwelling flows are less than a millimeter per year, porewater in sediments would be maintained at nearly constant temperature for thousands of years (Capuano, 1992). Capuano (1992) suggests that the residence time of the pore fluid in sediments may be adequate for isotopic and chemical equilibrium to be achieved between the fluid and sediments based on experiments on isotope exchange between clay minerals and water (O’Neil and Kharaka, 1976). Modeled upwelling owing to drainage from burial compaction and phase changes of silica minerals is thus slow enough to allow O–H isotopic exchange between clay minerals and interlayer water to reach equilibrium.
Similarly, in Case 2, the average upwelling velocity estimated from the dehydration of interlayer water in smectite at ~800 m depth was 5.7 × 10⁻⁵ m yr–1, whereas that estimated from silica water dehydration associated with the opal-CT/quartz phase change at ~1420 m was 6.5 × 10⁻⁵ m yr–1; slightly higher than that of Case 1 but still low compared with the migration velocity (10–3 m yr–1; Capuano, 1992) at which O–H isotope-exchange equilibrium between smectite and interlayer water is established.
In Case 3, the average upwelling velocity estimated from the dehydration of silica water associated with the phase change of opal-A/CT at ~1030 m depth was 5.6 × 10⁻⁵ m yr–1, and that estimated from silica water dehydration associated with the opal-CT/quartz phase change at ~1590 m was 6.0 × 10⁻⁵ m yr–1. The velocity estimated from the dewatering of interlayer water in smectite at ~2440 m depth was 7.1 × 10⁻⁵ m yr–1. The upwelling velocity in Case 3 is also sufficiently low compared with the migration rate at which isotopic-exchange equilibrium is established. The smaller influence of upwelling in shallower areas is likely due to the higher porosity there (Figs. 2 and 4).
Comparison with porewater chemistryIn the Koetoi and Wakkanai Formations, fossil seawater was reported to have δ2H values of –30‰ to –20‰ (Ishii, 2018). Long-term water–rock interactions with silicate minerals could shift the δ18O value in the positive direction (e.g., Mazurek, 2000). In this study, fossil seawater data considered less affected by meteoric water infiltration was extracted from each dataset using a δ18O value of ≥0‰ as an index, yielding data almost identical to those of Ishii (2018). Stratigraphic columns of boreholes are summarized in Fig. S1 with δ18O distributions. Fossil seawater in HDB1 was distributed over a depth range of –380 to –56 m relative to the boundary between the Koetoi and Wakkanai Formations (relative depth 0 m). Similarly, HDB2 data were distributed over a relative depth range of –654 to –164 m; HDB3 data from –75 to +321 m; HDB4 data from –374 to –326 m; HDB5 data from –374 to –327 m; HDB6 data from –338 to –178 m; HDB8 data from –363 to –181 m; HDB9 data from –517 to –222 m; HDB10 data at –257 m; HDB11 data from –534 to +289 m; HFB1 data from –189 to –101 m; and SAB2 data from –702 to –481 m relative depth. These relative depths are associated with uplift and fold structures owing to the compressive E–W neotectonic stress, and formation dip must be considered in obtaining information for the time of maximum formation burial, which was the modeling target.
The dip angle of the Koetoi and Wakkanai Formations in HDB1 is 40°; HDB2 is 10°, HDB3 is 45°, HDB4 is 35°, HDB5 is 35°, HDB6 is 35°, HDB8 is 20°, HDB9 is 40°, HDB10 is 40°, and HDB11 is 40° (Ota et al., 2011; Sakai and Matsuoka, 2015). The dip angle of the formations in SAB2 was set to 40° (Suko et al., 2014). Borehole HFB1 is in the middle area between HDB3 and HDB6 (Fig. 1), so the dip angle of the formations was set at 40°. The distance perpendicular to the boundary between the Koetoi and Wakkanai Formations (i.e., the relative maximum burial depth) was calculated by accounting for these formation dips (Miyakawa et al., 2017). The distribution depth of fossil seawater in HDB1 was –291 to –43 m relative depth, HDB2 was –644 to –161 m, HDB3 was –52 to +226 m, HDB4 was –307 to –267 m, HDB5 was –306 to –267 m, HDB6 was –276 to –145 m, HDB8 was –341 to –171 m, HDB9 was –396 to –170 m, HDB10 was –193 m, HDB11 was –409 to +221 m, SAB2 was –538 to –368 m, and HFB1 was –144 to –77 m.
The modeling shows a starting depth of 1170 m for the opal-A/CT phase change, so the depths of the analytical model corresponding to the above distribution depths are 1213–1461 m for HDB1, 1331–1814 m for HDB2, 943–122 m for HDB3, 1437–1477 m for HDB4, 1437–1476 m for HDB5, 1315–1446 m for HDB6, 1341–1511 m for HDB8, 1340–1566 m for HDB9, 1362 m for HDB10, 949–1579 m for HDB11, 1538–1708 m for SAB2, and 1247–1314 m for HFB1.
Depth-distribution data of fossil seawater for these boreholes are shown in Fig. 6, together with the results of the analysis (Fig. 5). Differences between observed and estimated Cl– concentrations and δ18O values are smaller than those of δ2H values. HDB1, HDB6, and HFB1 fossil seawater data plot near the Case 1 line (Fig. 6), suggesting that they are affected by dehydration of interlayer water in smectite and dehydration associated with the phase change from opal-A to opal-CT. Data for HDB2, HDB4, HDB5, HDB8, HDB10, and SAB2 plot near Case 2 and are influenced by the dehydration of interlayer water in smectite and phase transformation from opal-CT to quartz. HDB3 and HDB11 fossil seawater data overlap cases 1 and 2, suggesting an influence by dehydration of interlayer water in smectite and dehydration associated with the phase change from opal-A to opal-CT. HDB9 is intermediate between cases 1 and 2 and influenced by dehydration of interlayer water in smectite and phase transformation from opal-CT to quartz.
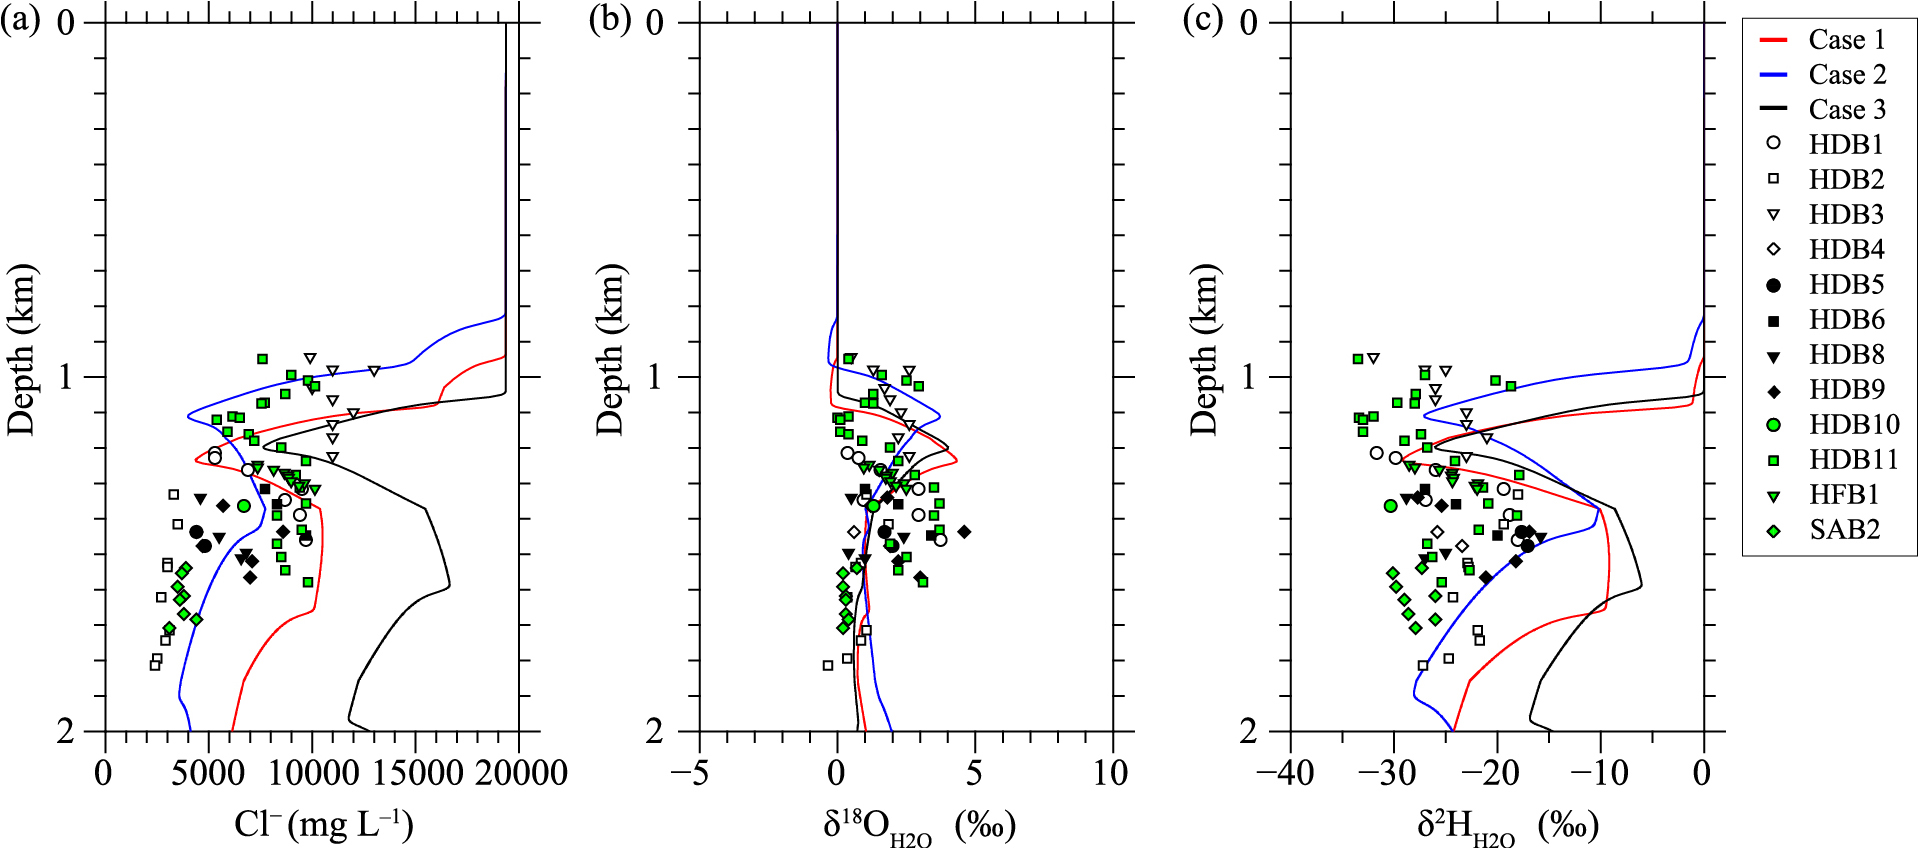
Comparison of calculated and observed depth profiles of porewater. Observations are from boring surveys (Amano et al., 2012). For HFB1, data are provided in Table 2. Borehole locations are shown in Fig. 1.
Mineral compositions of the HDB core samples (Hiraga and Ishii, 2008) show no clear depth dependence of the smectite/illite abundance ratio, indicating that the sedimentary environment of the Koetoi and Wakkanai Formations, where HDB is located, did not necessarily undergo a phase change of smectite in a low-temperature environment. The quartz index (ratio of strongest X-ray intensity of smectite to that of pure quartz) of smectite in core samples from 150–450 m depth in SAB2, determined by XRD analysis, had values of 1.71–3.38, whereas that of smectite from 500–700 m depth had values of 0.93–1.10 (p.2-374 in JAEA, 2011). The half-valence width of the [101] plane of illite decreases with increasing depth from 0.826 to 0.335, as the crystallinity of illite increases with depth (p.2-376 in JAEA, 2011). These observations are consistent with fossil seawater in SAB2 plotting near Case 2 (Fig. 6), where the phase transformation from smectite to illite progresses at low temperatures.
The relationship between Cl– concentration and δ18O and δ2H values for 940–1820 m depth corresponding to the distribution of fossil seawater in each borehole is shown in Fig. 7. The model incorporated the dehydration of clay minerals and upwelling owing to burial compaction, in addition to dehydration of biogenic silica, as previously modeled by Kai and Maekawa (2009). Starting from seawater, δ18O values shifted to positive values and δ2H to negative values while Cl– concentration decreased, indicating that porewater with δ18O values of >0‰, δ2H values of –20‰ to –30‰, and Cl– concentrations of ≤80% lower than seawater was formed. Although all the borehole data shown in Fig. 7 are assumed to be of seawater origin judging from δ18O >0‰, there is a linear trend in δ18O–δ2H plot (Fig. 7a). The linear trend seems to be consistent with the mixing line between fossil seawater and paleo-meteoric water (Teramoto et al., 2006). However, it is difficult to distinguish a linear trend of diffusive solute transport from fossil seawater to paleo-meteoric water (Arthur et al., 2023) from that of diffusive mixing between fossil seawater affected by opal-A/CT transition and fossil seawater affected by opal-CT/quartz. Therefore, a possibility of some data affected by paleo-meteoric water may remain even in the data of δ18O with positive values.

Cross-plot for numerical modeling of Cl– concentration and δ18O and δ2H values of porewater at depths of 940–1820 m, together with observation data from boring surveys (Amano et al., 2012, Table 2). Borehole locations are shown in Fig. 1. The depth range corresponds to the fossil seawater distribution in observation data (Fig. 6). Abbreviations: Opl-A, opal-A; Opl-CT, opal-CT; Qz, quartz; Sme, smectite; Ilt, illite; LMWL, local meteoric water line (Teramoto et al., 2006). Notations with analytical results in each figure indicate the main factor involved in porewater evolution.
Most of the borehole data was located near simulation lines (Fig. 7). It is likely that the fossil seawater from the boreholes was formed mainly by dehydration of interlayer water from smectite associated with the S–I transition, dehydration of silica water from biogenic silica, and upward migration of porewater owing to burial compaction. However, modeled δ2H values were often lower than analytical results, especially at depths of <1170 m in the Koetoi Formation (Figs. 6 and 7b). The total-organic-carbon content of HDB core samples decreased from ~2 to 1 wt.% with decreasing relative maximum burial depth down to approximately –200 m before stabilizing (Miyakawa et al., 2017). Kerogen δ18O and δ2H values in core samples from the Koetoi and Wakkanai Formations obtained from HDB11 at depths (mbgl, meters below ground level) of 44–942 m were in the ranges of +18.7‰ to +20.9‰ and –183‰ to –171‰, respectively (Table S2). Dehydration reactions of organic matter proceed even at relatively low temperatures (Shock, 1993), and anaerobic microbial decomposition of humic substances has been reported for the HDB core samples (Ueno et al., 2016). The much lower δ2H value of organic matter than porewater suggests that dehydration associated with decomposition of organic matter may have affected porewater composition. A maximum smectite water content of ~66% (Case 2) was assumed as the effective water content of smectite, possibly causing overestimation of the dilution of Cl–. On the other hand, the fact that Case 2 calculations are nevertheless consistent with observations from boreholes suggests that mechanisms not considered in this study, such as dehydration from organic matter and ion filtration due to the semipermeability of clay minerals, may have contributed significantly to the evolution of the fossil seawater in this area.
Evolution of deep groundwater in the Horonobe areaThe previous hydrochemical studies indicated that two basic groundwater types are present in the Horonobe area: (1) relatively shallow Na-HCO3 type groundwaters and (2) deeper Na-Cl type groundwaters (Hama et al., 2007). These solutions appear to be at equilibrium, or to closely approach equilibrium, to several authigenic carbonate and sulfide minerals in the Wakkanai Formation (Hama et al., 2007; Iwatsuki et al., 2009; Sasamoto et al., 2011). Equilibrium constraints on pH (neutral to slightly alkaline buffered by carbonate minerals) and redox potentials (reducing conditions buffered by sulfide minerals) appear to be preserved for long periods following initial deposition and subsequent diagenesis (Iwatsuki et al., 2009). General controls on groundwater chemistry include diagenetic reaction, diffusional and/or advective mixing of meteoric waters with deep groundwaters whose compositions have evolved, possibly from connate seawater, by water-rock interactions, and other mineral-water reactions induced by mixing (Hama et al., 2007).
The Na+, Cl–, K+, Mg2+, and SO42– concentrations in fossil seawater were greatly reduced compared to seawater, while the concentrations of dissolved inorganic and organic carbon, Br–, I–, B, and NH4+ increased significantly relative to seawater (Iwatsuki et al., 2009). Since biogenic silica is the primary constituent mineral of the Koetoi and Wakkanai Formations (e.g., Hiraga and Ishii, 2008), geochemical processes involved in groundwater evolution include phase change from opal-A to opal-CT associated with burial diagenesis, biochemical reactions associated with microbial activity, organic matter maturation, and others (Iwatsuki et al., 2009). However, it has been reported that the dilution of the salinity of fossil seawater in the Koetoi and Wakkanai Formations cannot be explained only by the dilution process of the dehydration reaction from biogenic silica because the dilution effect is only about 10% at most if only the decrease in porosity due to burial compaction and dehydration from opal-A are considered (Iwatsuki et al., 2009). Therefore, the dilution by infiltration of meteoric water after uplift was considered as one possibility (Iwatsuki et al., 2009). The dilution factor of salinity was examined by Kai and Maekawa (2009) using numerical modeling simulating dehydration due to phase changes in opal-A, opal-CT, and quartz during burial diagenesis, but could only explain concentration reduction to about 70% of seawater at a burial depth of 2000 m. A burial depth of approximately 4000 m was required to reduce the salinity to about 30% of seawater (Kai and Maekawa, 2009), which is inconsistent with the geological history and suggested the need to consider other factors such as dehydration from clay minerals and upward migration of porewater due to compaction.
Figures 6 and 7 show that diluted fossil seawater can be evolved from the original seawater during burial diagenesis, even without mixing with meteoric water. Figure 8 shows the Cl– concentration–δ18O plots of porewater data, including those affected by meteoric water, together with chemical analysis data for deep groundwater in areas other than Horonobe, where the distribution of fossil seawater in Neogene sedimentary formations has been reported, including Tomamae, Enbetsu, Teshio, and Toyotomi in Dohoku Hokkaido area (Ueda et al., 2010); the Moritake, Sarukawa, Hashimoto, Nishiohgata, Yuri, and Yabase oil fields in Akita Prefecture (Sakai and Matsubaya, 1974; Kato et al., 2000, 2011; Kato, 2020); the Amarume oil field in Yamagata Prefecture (Kato et al., 2000); the Shin-tainai, Higashi-Niigata, Mitsuke, Fujikawa, Yoshii, Yasuda, and Katagai gas fields in Niigata Prefecture (Kato and Kajiwara, 1986; Kato, 2018); the Minami-Kanto gas field in Chiba Prefecture (Maekawa et al., 2006); and the Miyazaki and Sadowara gas fields in Miyazaki Prefecture (Fig. 1) (Kato et al., 2011). Fossil seawaters in the Miocene strata of similar age to the Koetoi and Wakkanai Formations (open symbols in Fig. 8) are also considered to be affected by dehydration owing to phase changes of biogenic silica and clay minerals, condensate due to the formation of gas layers, smectite formation owing to alteration of volcanic ash, and organic matter dehydration (e.g., Ueda et al., 2010; Kato, 2018, 2020). Most of these data lie along with the simulated evolution lines (Fig. 8), suggesting a possibility that phase changes of biogenic silica and clay minerals may have been the major mechanisms in the dilution of Cl– and positive shift of δ18O in diagenetic groundwater evolution. However, outlying data points of the Akita area showing negative δ18O values suggest that formation mechanisms not considered in this model, such as organic matter dehydration, may also have been contributing factors in the Akita area. On the other hand, data for younger Pliocene strata (light blue circles and triangles in Fig. 8) are considered to be affected by the dehydration of organic matter and the formation of smectite owing to the alteration of tephra and mixed with meteoric water (Maekawa et al., 2006; Kato et al., 2011), which processes were not considered in this model. These data plot beyond modeling results (Fig. 8), possibly because strata where these groundwaters are distributed do not reach depths strongly affected by silica mineral diagenesis. These comparisons possibly support our results in the Horonobe area.

Relationship between Cl– concentration and δ18O values of porewater from boreholes, together with analysis results. Green shading indicates the possible range of fossil seawater formation; gray shading indicates the area of mixing with fresh meteoric water.
The deeper parts of the Koetoi and Wakkanai Formations have low fracture connectivity, and fossil seawater with little evidence of seepage of meteoric water is often found there (Ishii, 2018). There were very few secondary mineral-filled fractures in the deeper part of the Wakkanai Formation, suggesting that groundwater flow rates were low after fracture formation (Iwatsuki et al., 2009). 36Cl/Cl isotopic ratios and dissolved He in groundwater in the deeper part of the formation indicate groundwater ages much greater than the half-life of 36Cl (3.01 × 10⁵ yr; Phillips, 2013), suggesting that such groundwater has moved little since uplift occurred (Nakata et al., 2018a). The results of this study support this by also suggesting that groundwater formed during burial diagenesis has been preserved since uplift, while also implying that mixing of meteoric water and fossil seawater occurred primarily after uplift of the strata. Therefore, we conclude that the dilution of Cl– in fossil seawater was not caused by mixing with surface water in the present geological environment but occurred over a period of the order of one million years, supporting the low-flow distribution of fossil seawater in the Horonobe region.
Based on O–H isotopic ratios, groundwater found inland in the region has four endmembers: fossil seawater, present-day seawater, modern meteoric water, and glacial-period meteoric water (Teramoto et al., 2006). The intrusion of meteoric water occurred during and after the uplift and denudation and is considered to have been accelerated during glacial periods owing to a temporary increase in the hydraulic gradient by marine regression (Miyakawa et al., 2017; Teramoto et al., 2006). The mixing line between fossil seawater and glacial-period meteoric water is relatively linear, with little evidence of mixing between present-day seawater and meteoric water (Fig. 9). This suggests that the formation of fossil seawater by diagenesis and mixing with meteoric water by infiltration did not coincide. Furthermore, mixing of modern meteoric water was observed with the mixing line between fossil seawater and glacial-period meteoric water (Fig. 9), suggesting that groundwater found in the Koetoi and Wakkanai Formations formed in the following order: formation of fossil seawater by diagenesis during burial before 1.0 Ma; mixing of fossil seawater and meteoric water during a glacial period after 1.0 Ma; and mixing with modern meteoric water.

Relationship between δ18O and δ2H values of groundwater in the Horonobe area. LMWL = local meteoric water line (Teramoto et al., 2006). Lines behind the data points are regression lines for data for HDB1 and HDB3 (Teramoto et al., 2006). Black closed circles are observation data from boring surveys (Amano et al., 2012). Red circles are endmembers of seawater, fossil seawater, past meteoric water, and present meteoric water. Arrows indicate processes of porewater evolution and mixing.
Modeling results indicate that the increase in δ18O values with decreasing Cl– concentration relative to seawater is a useful indicator of the existence of fossil seawater in deep groundwater Neogene marine deposits containing large amounts of biogenic silica and clay minerals, as in the Horonobe area. This may be useful in preliminarily investigations of the extent of low-flow areas in HLW disposal studies. In such investigations, the distribution of groundwater salinity is estimated by electrical resistivity and electromagnetic surveys, allowing estimation of the extent of infiltration of meteoric water (NUMO, 2021). Our results indicate that in strata where there is a decrease in salinity relative to seawater, this may not be due to infiltration of meteoric water but rather to a low-flow area, as confirmed by the presence of fossil seawater. The results should thus contribute to the selection of suitable sites for geological disposal of HLW.
Numerical modeling of the effects of silica water dehydration associated with phase transitions of biogenic silica, smectite interlayer water dehydration, and drainage and upwelling owing to porosity reduction has shown that fossil seawater in the Horonobe area was formed during burial diagenesis. Groundwater with δ18O values of >0‰, δ2H values of –30‰ to –20‰, and Cl– concentrations of ≤80% lower than that of seawater can be formed during burial without mixing with meteoric water. Groundwater in the deeper parts of the Wakkanai Formation may have been preserved since uplift, with low fracture connectivity (Ishii, 2018), and has barely moved since uplift occurred (Nakata et al., 2018a). Trends observed in borehole investigations indicate that mixing of meteoric water with fossil seawater occurred mainly after uplift. The reduction of Cl– concentration in fossil seawater was thus not caused by mixing with meteoric water in the present geological environment but occurred over a period of the order of one million years, confirming the low-flow nature of the fossil-seawater area.
The results are from a one-dimensional model dealing with only upward groundwater flow. However, it may be the case that the water flow may occur in the lateral direction parallel to the layer in a bedding slope (e.g., Bethke, 1985). As mentioned in Introduction, diagenetic processes that modify the fluid composition, including degradation of organic matter, alteration of volcanic ash, carbonate precipitation, and ion filtration due to the semipermeability of clay minerals, may have played an important role in the groundwater evolution in Horonobe area. In order to attain a comprehensive understanding, these mechanisms should be considered in combination with the dehydration of biogenic silica and clay minerals and upward flow owing to burial compaction.
Comparison of model outputs with saline groundwater data from the future HLW disposal investigation area where Neogene sedimentary formations are distributed is expected to improve our understanding of the formation of groundwater. Depth data from borehole investigations should make it possible to study the low mobility of groundwater, as shown by the example here of fossil seawater in the Horonobe area. However, different geological environments such as depositional environments and different depositional ages will require updated or supplemental interpretations of the model on a case-by-case basis.
We thank Hisashi Imai and Hirokazu Nagasawa (Hazama Ando Co.) for help with program coding and Stallard Scientific Editing (www.stallardediting.com) for manuscript improvement. Three anonymous reviewers and Tsubasa Otake (associate editor) are gratefully acknowledged for improving the manuscript. This study was undertaken as part of an R&D supporting program titled “Research and development on Groundwater Flow Evaluation Technology in Bedrock” under contract to the Ministry of Economy, Trade and Industry (2020, 2021 FY, Grant Number: JPJ007597).