ARTICLE
REE geochemistry of conodont fossils from pelagic deep-sea sedimentary rocks

2023 年 57 巻 6 号 p. 184-196

詳細
2023 年 57 巻 6 号 p. 184-196
Conodonts are tooth-like apparatuses of extinct marine animals and their geochemical composition is a key tool in reconstructions of paleo-marine environmental conditions. Previous geochemical studies focused on conodont fossils with weak thermal maturation from shallow-marine sedimentary rocks. However, the geochemical features of conodont fossils in pelagic deep-sea sedimentary rocks, which are suitable for reconstructions of paleo-environmental conditions of pelagic Panthalassa, are poorly understood. This study presents geochemical data of conodont fossils from the Triassic deep-sea pelagic sedimentary rocks from the Inuyama area, central Japan and examines their potential as a paleo-environmental indicator. The examined conodonts were composed of fluorapatite and possessed almost the same major elemental fractions as conodonts from Early Triassic limestone. Concentrations of REEs in conodonts in the pelagic deep-sea sedimentary rocks (~1000 ppm in average) are much higher than that of the conodonts from limestone (~89 ppm in average). Cathodoluminescence images and elemental mapping of conodont cross-sections reveal that conodonts in pelagic deep-sea sedimentary rocks have a few μm-thick REEs-rich layers composed of diagenetically precipitated euhedral apatite at the surfaces of the denticles and along cracks. Furthermore, Y/Ho ratios and Ce anomalies of the conodont fossils are different from those of modern seawater and, instead, are similar to those of the surrounding siliceous sedimentary matrix. These results suggest that their REE signatures were acquired from the surrounding siliceous material during diagenesis. The Ce anomalies of conodonts could reflect the presence of Fe-Mn oxides at the paleo-sea floor and indirectly record the redox condition of paleo-ocean floor.
Conodont elements (hereafter conodonts) are the tooth-like feeding apparatuses of extinct marine chordates (Aldridge et al., 1986, 1993). They are composed of hydroxyfluorapatite and ubiquitous in various sedimentary rocks, such as shallow-water limestone and deep-sea cherts of the Paleozoic to early Mesozoic (Triassic). Previous studies have attempted to reconstruct the geochemical composition of paleo-seawater using oxygen isotope (δ18O), strontium isotope (87Sr/86Sr), and rare earth element (REE) data of conodont (e.g., Joachimski and Buggisch, 2002; Trotter and Eggins, 2006; Bright et al., 2009; Joachimski et al., 2009; Zhao et al., 2013; Chen et al., 2015; Song et al., 2015; Trotter et al., 2016; Li et al., 2017; Zhang et al., 2017). The δ18O and 87Sr/86Sr values of conodonts are considered to reflect the composition of the seawater in which the animal formed the feeding apparatus. On the other hand, the REE composition of conodonts is considered to be obtained during early to late diagenesis (e.g., Li et al., 2017). If uptake of REEs occurred near the sediment-seawater surface, it can record the hydrogenous information of REEs (e.g., Li et al., 2017). However, if uptake of REEs occurred during late diagenesis, conodonts record the REE-information of porewater and tend to show extremely high ΣREE concentrations (~1000 ppm) (Trotter and Eggins, 2006; Zhao et al., 2013; Chen et al., 2015; Trotter et al., 2016; Li et al., 2017).
Most previous studies on conodont geochemistry have been conducted on conodonts extracted from carbonates deposited in shallow-marine environments close to continents. On the other hand, geochemical compositions of conodonts from pelagic deep-sea sedimentary rocks, such as chert and siliceous claystone, have been poorly understood. Given their deposition far from land and unrestricted oceanic settings, conodonts from such rocks have the potential as a proxy for reliable paleo-seawater conditions of pelagic Panthalassa. However, conodonts are usually extracted from these pelagic rocks by dilute hydrofluoric acid (e.g., Hayashi, 1968; Conodont Research Group, 1972; Isozaki and Matsuda, 1980; Ishida, 1981), which causes chemical damage to phosphatic materials, making the fossils unfit for geochemical analysis. Therefore, the effect of post-depositional chemical alteration on such conodonts is poorly understood. This study presents the chemical compositions of conodonts recovered from pelagic deep-sea sedimentary rocks (chert and siliceous claystone) without chemical extraction and compares them with those of conodonts from coeval shallow-marine carbonate rocks deposited on a seamount in pelagic Panthalassa. Our study sheds light on the changes in conodont REE chemistry in deep-sea sedimentary rocks during diagenesis and highlights the potential for and limitations of geochemical reconstructions of the contemporaneous environment using these bioapatite fossils.
The studied section is part of the Mino–Tamba Belt, a Jurassic accretionary complex in Japan (e.g., Yao et al., 1980; Kimura and Hori, 1993; Wakita, 1988). Coherent sequences belonging to the Mino–Tamba Belt comprising pelagic deep-sea sedimentary rocks and overlying clastic rocks crop out in the Inuyama area, central Japan (Fig. 1). The rocks in the area are divided by thrusts into four thrust sheets, each containing a sequence of deep-sea sedimentary rocks and clastic rocks (sheets 1–4 in Kimura and Hori, 1993; Fig. 1b). Paleomagnetic data indicate that the deep-sea sedimentary rocks were initially deposited in the equatorial Panthalassic Ocean (Shibuya and Sasajima, 1986; Oda and Suzuki, 2000; Ando et al., 2001). Micropaleontological studies have demonstrated that the deep-sea sedimentary sequence spans the Lower Triassic to Lower Jurassic (Yao et al., 1980; Isozaki and Matsuda, 1982, 1983; Sugiyama, 1997; Yao and Kuwahara, 1997; Takahashi, S. et al., 2009; Yamashita et al., 2018; Muto et al., 2019; Du et al., 2020, 2023; Tomimatsu et al., 2021). The Lower Triassic and overlying lower Middle Triassic strata mainly consist of black, gray, and greenish-gray pyrite-bearing siliceous claystone and bedded chert, which were deposited under reducing depositional and diagenetic conditions (Nakao and Isozaki, 1994; Takahashi, S. et al., 2009, 2015). The lithology of the upper Middle to Upper Triassic parts consist of hematite-rich red chert, which was subjected to oxic conditions during deposition and diagenesis (Kubo et al., 1996; Sato et al., 2011; Nakada et al., 2014; Ikeda et al., 2015). Sampling for geochemical analysis was conducted in six sections from two areas (Fig. 1b): the Momotaro-jinja (Mt) section (Yao and Kuwahara, 1997), Section C (Sugiyama, 1997), and Section R (Sugiyama, 1997) in the Momotaro-jinja area in the southern part of sheet 2, and sections M, N, and O of Sugiyama (1997) in the Sakahogi area in the northern part of sheets 2 and 3. We collected 38 rock samples (~2 kg each) from Lower to Upper Triassic strata (Fig. 2): 20 samples from the Mt section, which is Olenekian (Lower Triassic) in age (Yao and Kuwahara, 1997; Takahashi, S. et al., 2009; Yamakita et al., 2010, 2016); 11 samples from sections M, C, and O, which are Anisian and Ladinian (Middle Triassic) in age; and 7 samples from sections R and N, which are Carnian to Norian (Upper Triassic) in age (Sugiyama, 1997; Nakada et al., 2014).

(a) Map showing the location of Inuyama, central Japan. (b) Geological map of the Inuyama area. Sampling areas are located in the northern and southern parts of Sheet 3 (CH-3) and the northern part of sheet 2 (CH-2). The geological map of the Inuyama area is simplified from Kimura and Hori (1993).

Stratigraphic profile of Y/Ho ratios and Ce/Ce* from conodont specimens and host rocks measured in this study. Black dots represent the data from conodont interiors and white dots represent data from REE-rich surface layers. Gray squares represent the Y/Ho ratios and Ce/Ce* values of host rocks. The gray vertical bar in the Y/Ho ratio graph shows the value of terrigenous sediment and the blue bar shows the value of modern seawater (Nozaki, 2001). The brownish vertical bar in the Ce/Ce* graph indicates the Ce values for terrigenous sediments. Lithology is based on Sugiyama (1997), Nakada et al. (2014), and this study. Radiolarian biozone is based on Sugiyama (1997) and Yao and Kuwahara (1997). The correlation of the Lower to Middle Triassic radiolarian zone with stages is based on Muto et al. (2018, 2019).
We also extracted conodont specimens from the Taho Limestone in the Jurassic accretionary complex of the Chichibu Belt distributed in Taho, Seiyo City, Ehime Prefecture, Southwest Japan (Fig. 1), to compare with our conodonts in the deep-sea sedimentary rocks. The Taho Limestone is upper Permian to Upper Triassic in age, based on conodont biostratigraphy, and was deposited on a pelagic seamount in the Panthalassic Ocean (Koike, 1979; Maekawa et al., 2018). We processed a limestone sample from the Olenekian strata (upper Lower Triassic).
Sample preparationThe chert and siliceous claystone samples from the Inuyama area were split parallel to bedding planes to identify conodont fossils on the chipped surface under a stereomicroscope (Muto et al., 2019) (Fig. 3a). The recovered conodont specimens are gray to dark-gray in color and contain many cracks. This black color is different from the original color of conodont elements (e.g., honey-brownish-colored Devonian conodonts from USA; Pietzner et al., 1968) and instead correspond to the conodont color alteration index (CAI) 2–4 of Epstein et al. (1977). Although CAI is designed to estimate maximum burial temperatures, its applicability on conodonts that experienced diagenesis and/or low-grade metamorphism within abyssal plain deposits or at subduction zone is yet to be tested. The chipped rock pieces containing conodont fossils were trimmed and embedded in epoxy resin (Petropoxy 154, Palouse Petro Products, USA and Technovit 4071, Kulzer, Germany). In this way, we avoid any alteration of the fossils that may be caused by extraction of conodonts by chemical dissolution of the host rock.
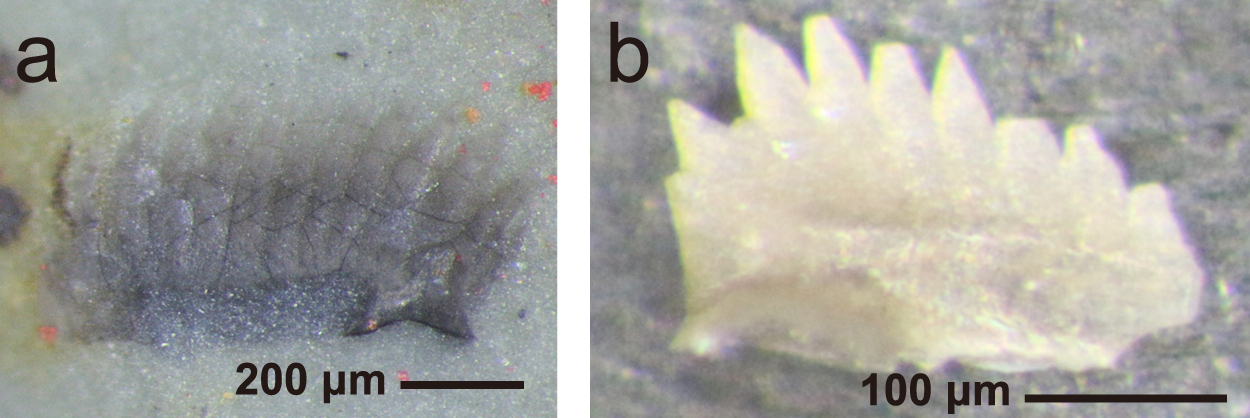
Examples of conodont fossils recovered from (a) Triassic deep-sea sedimentary rocks from the Inuyama area (Mt section) and (b) the Taho Limestone which were observed under a stereoscopic microscope.
The limestone sample from the Taho Limestone was broken into small pieces and immersed in 10% acetic acid for one week. The resulting residue was collected using a 63 μm-mesh sieve. This procedure was repeated until the sample was completely dissolved. Individual conodont specimens were picked from the residue under a stereomicroscope. Conodonts in the Taho Limestone are light to dark brown in color corresponding to CAI of 2–4 (Epstein et al., 1977) in agreement with Maekawa et al. (2018) (Fig. 3b). The conodonts were then embedded in resin (Petropoxy 154, Palouse Petro Products, USA).
Conodonts from the Taho Limestone and Inuyama area that were mounted in resin were polished using carborundum powders of 3000 grit and 6000 grit, then with diamond paste (1 μm in diameter) to generate smooth cross-sectional surfaces of the conodonts for in situ geochemical analysis.
Electron probe microanalyzerQuantitative analyses and elemental mapping of conodonts were performed using a field emission-electron probe microanalyzer (FE–EPMA; JEOL JXA-8530F) at the Department of Earth and Planetary Science, University of Tokyo, Japan. Quantitative spot analyses were conducted on the conodont samples from the Mt, M, C, R, and N sections and the Taho Limestone (112 points in total from 20 conodont samples). The contents of F, Na, Mg, Al, Si, P, Cl, S, K, Ca, Ti, Mn, Fe, Sr, Y, La, Ce, Pr, Nd, Pb, Th, and U in the conodonts were determined using a probe diameter of 10 μm, current of 12 nA, and accelerating voltage of 15 kV. Detailed methods, including information on standard materials, characteristic X-ray, and wavelength dispersive X-ray spectrometer (WDS) are described in the Supplementary Table S1.
Element mapping was performed for Ca, P, F, Sr, Si, Na, Nd, and Y contents on conodont cross-sections. Calcium, P, and F measurements were performed using a probe diameter of 1 μm, specimen current of 80 nA, and accelerating voltage of 15 kV. Strontium, Si, Na, Nd, and Y measurements were performed using a probe diameter of 1 μm, current of 80 nA, and accelerating voltage of 25 kV. Detailed elemental mapping analyses of smaller areas were performed using a probe diameter of 0.1 μm, probe current of 80 nA, and accelerating voltage of 25 kV. Cathodoluminescence (CL) images were obtained using an accelerating voltage of 15 kV and an emission current of 200 nA.
Laser ablation–inductively coupled plasma–mass spectrometryCalcium, Rb, and REEs (Y, La, Ce, Pr, Nd, Sm, Eu, Gd, Tb, Dy, Ho, Er, Tm, Yb, and Lu) were measured at selected spots on the polished surfaces of conodonts using an inductively coupled plasma–mass spectrometer (ICP-MS; iCAP Qc, Thermo Fisher Scientific) coupled to laser ablation (LA) system (CETAC LSX-213 G2+ Nd: YAG LA) at the Department of Earth and Planetary Science, the University of Tokyo, Japan. We distinguished ablations that penetrated the conodonts into its host rocks by Rb intensity, since the host rocks in the Inuyama area have high Rb contents (50–250 ppm; Fujisaki et al., 2016) relative to the conodont specimens (below detection limit). The laser diameter was 30 μm and the frequency was 10 Hz. We used synthetic silicate glass (NIST 611, National Institute of Standard and Technology) as an external standard. For analyses of conodonts from the deep-sea sedimentary rocks and the Taho Limestone, average Ca concentrations, determined by FE–EPMA, were used as internal standards for elemental concentration measurements since Ca is distributed homogeneously in the conodont specimens (see Sections “Results” and “Discussion”). The other elemental concentrations were determined using their sensitivity factors relative to Ca, as determined for the NIST SRM 611 standard. For a detailed explanation of this methodology, see Itano et al. (2016).
We calculated the Ce anomaly (Ce/Ce*) from our measured data using the following equation:
| (1) |
where Cesample, Lasample, and Prsample represent the concentrations of Ce, La, and Pr measured in this study and CePAAS, LaPAAS, and PrPAAS represent the concentration of Ce, La, and Pr in post-Archean Australian shale (PAAS; Taylor and McLennan, 1985). We also calculated the yttrium/holmium (Y/Ho) ratio and the sum of lanthanoid series elements (La–Lu) and Y as ΣREEs.
We also conducted LA-ICP-MS analysis on the siliceous sedimentary rocks that host the conodonts in the Inuyama area for Ce/Ce* and Y/Ho ratios. In this analysis, we calculated only Ce/Ce* and Y/Ho ratios from intensities of REEs and did not calculate the concentration of each REE using an internal standard. The analytical conditions were the same as those for the conodont samples.
Polished surfaces of conodont fossils from the siliceous sedimentary rocks in the Inuyama area show porous structures, and most of the conodont specimens have cracks. We observed euhedral crystals near the cracks and outer margins of the conodont denticles (the tooth-like spines of conodonts) (Fig. 4). Elemental maps of Ca, P, and F show homogeneous distributions in the cross-sections of conodonts from both siliceous sedimentary rocks and limestone (Figs. 5 and 6). Yttrium and Nd, which here we use to represent REEs, are enriched at the surfaces of the denticles, and in cracks within the conodonts preserved in siliceous sedimentary rocks. All of the conodont specimens from the siliceous rocks of the Inuyama area have thin (~a few μm) layers characterized by blue luminescence at the margins of denticles and cracks in CL images (Fig. 7a, b). Conversely, luminescence is not observed in the CL images of the conodonts from the Taho Limestone (Fig. 7c).

(a) Backscattered image of a conodont fossil from the Upper Triassic chert. (b) Enlarged image of a layer with high REE concentrations at the crack of a conodont (sample N3).

EPMA elemental maps of a conodont fossil from siliceous claystone in the Mt section (sample Mj7). All scale bars are 100 μm.
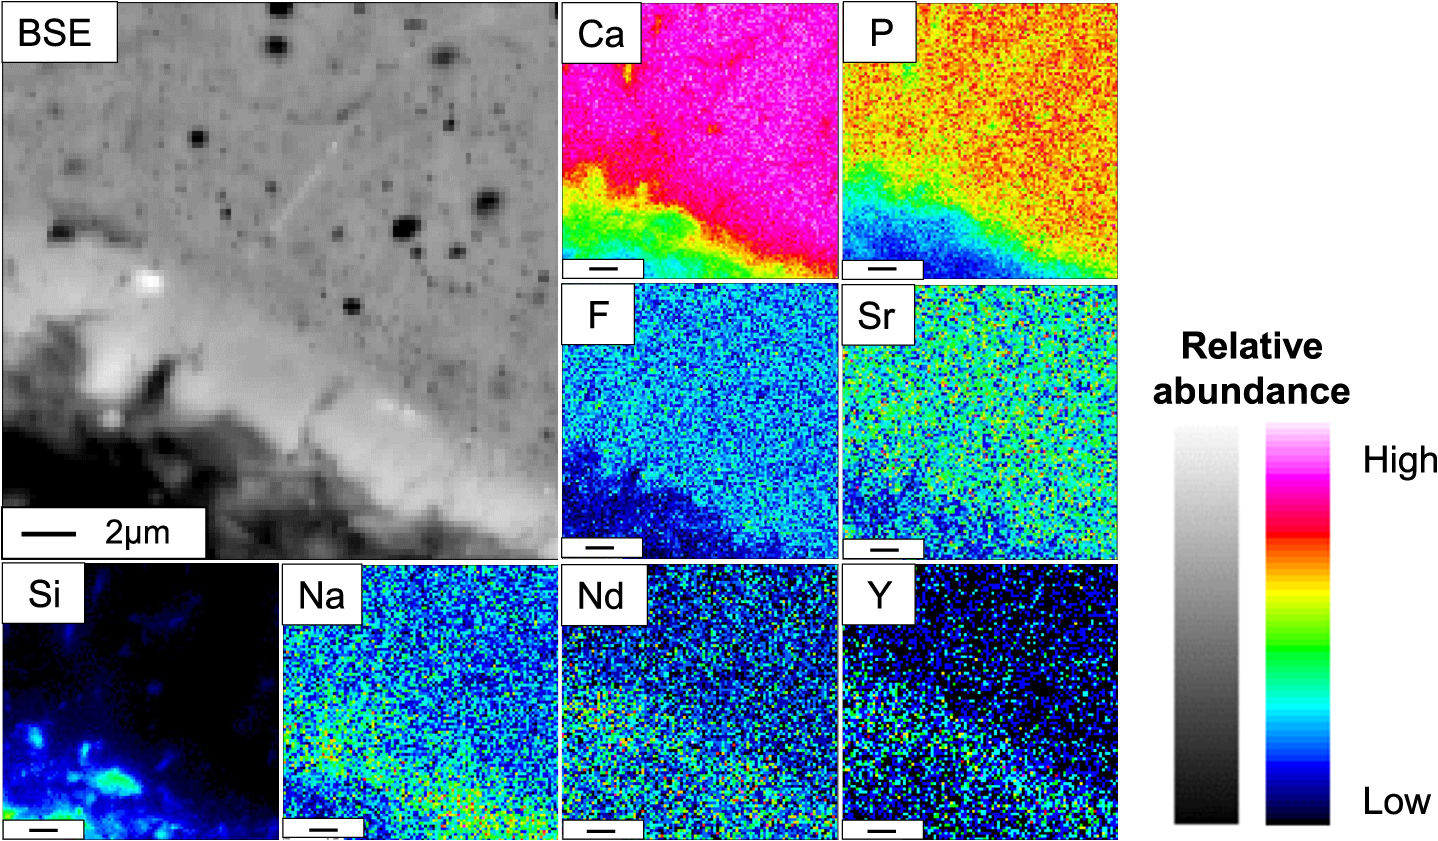
Close-up image of EPMA elemental maps of a REE-rich layer of a conodont fossil from the Mt section (Mj8). All scale bars are 2 μm

Cathodoluminescence images of polished conodont specimens from (a) siliceous claystone from the Mt section (sample Mj7), (b) greenish-gray chert from the Mt section (sample Mj8), and (c) Taho Limestone.
Quantitative spot analyses of 84 spots in 16 conodont specimens from the siliceous sedimentary rocks of the Inuyama area indicate that their major components are CaO (49.6–58.8 wt.%), P2O2 (36.5–42.3 wt.%), and F (3.2–4.6 wt.%) (Supplementary Table S2), with an average molar fraction of Ca : P : F = 10.0 : 6.0 : 2.0. In some spots we detected FeO, MgO, Al2O3, and SiO2 (<2.42 wt.%, <0.46 wt.%, <1.27 wt.%, <2.21wt.%, respectively), which are major components of the surrounding host rocks. This may be due to the probe sampling tiny cracks in the conodonts filled with siliceous and argillaceous material. Concentrations of other elements were below the detection limit. There are no major differences in major element compositions of conodonts among sections and ages.
Results of quantitative EPMA spot analyses of 28 spots in 4 conodont specimens from the Taho Limestone are listed in Supplementary Table S3. Concentrations of CaO, P2O5, and F are 52.9–54.8 wt%, 40.0–41.9 wt%, and 3.5–4.4 wt%, respectively, with an average molar fraction of Ca : P : F = 10.0 : 6.0 : 2.1. Contents of FeO, MgO, Al2O3, and SiO2 were mostly below detection limits.
Rare earth elements in conodontsThe ΣREEs values of the conodonts in siliceous claystone and chert range from 6.7 to 6600 ppm with a mean value of 1100 ppm and a median value of 559 ppm (Supplementary Tables S4 and S5). Although most of the analyses were performed on conodont material, in some cases the laser beam penetrated the conodont specimens and sampled the underlying host rock (Fig. 8). Some analyses using LA-ICP-MS on conodonts from the deep-sea rocks resulted in a gradual decrease in Ca intensity accompanied by a gradual increase in Rb intensity (Fig. 8). Here, Ca is a major component of conodonts while Rb is more abundant in the surrounding host rocks. Thus, the trend can be interpreted as an indication that the laser beam gradually shot through the conodonts and into the host rock during the analysis (Fig. 8b). In some cases, before Rb intensity increased, Y intensity increased sharply (Fig. 8a). This can be explained by the existence of REE-rich layers at the outer margins of the conodonts (Fig. 8a), evidenced by elemental mapping of REEs and CL imaging (Fig. 7). The elemental data including the rapid surges in REE intensities, are distinct from other data and are indicated as REE-rich layers.

(a) Temporal fluctuations in Ca, Rb, and Y intensity in a conodont sample from a Lower Triassic siliceous claystone (sample Mj3) measured by LA-ICP-MS. The intensity of each element is normalized to the peak value. (b) Schematic diagram showing laser beam penetration through a conodont specimen into the host rock underneath.
In contrast, the conodonts in the Taho Limestone have ΣREE contents of 28–240 ppm with a mean value of 89 ppm and a median value of 70 ppm (Supplementary Table S6), which is an order of magnitude lower than those of the siliceous rocks. Most of the Triassic conodont specimens in the siliceous claystone and chert from the Inuyama area show REE patterns with a bulge in MREEs (Fig. 9a–c), while the conodonts from the Taho Limestone exhibit flat REE patterns (Fig. 9d).
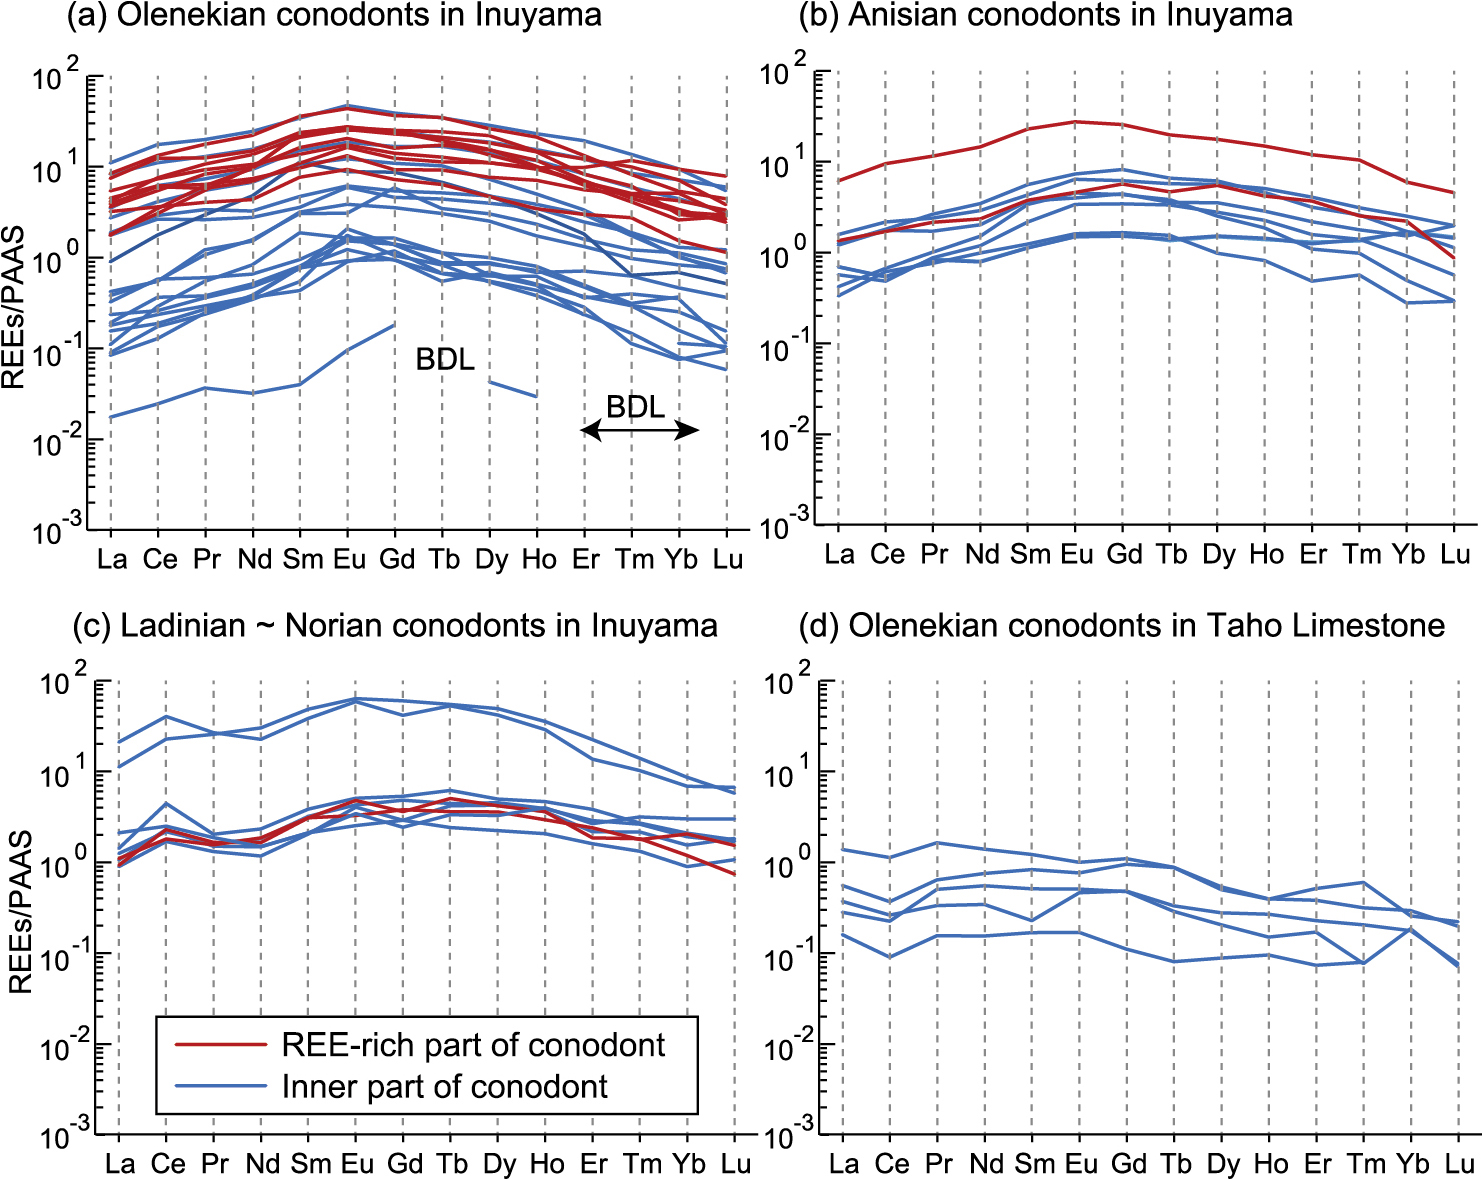
PAAS-normalized REE patterns of conodont fossils from siliceous sedimentary rocks in the Inuyama area and the Taho Limestone. Red and blue lines show data of the inner part of conodonts and REE-rich surface layers, respectively: (a) the Olenekian (upper Lower Triassic) Mt section, (b) the Anisian (lower Middle Triassic) M and C sections, (C) REE patterns of conodonts from the Ladinian (upper Middle Triassic) to Norian (upper Upper Triassic) O, R, and N sections, and (D) the Taho Limestone (Olenekian). BDL—below detection limit.
The conodonts in the Lower Triassic gray siliceous claystone and the overlying Anisian (Lower Middle Triassic) gray and red cherts yielded minor or no Ce/Ce* anomalies (Fig. 2), while the conodonts from the Ladinian (upper Middle Triassic) and Upper Triassic red chert yielded positive Ce/Ce* anomalies (1.25–2.61; Fig. 2). The Y/Ho ratios of conodonts in the Inuyama area range from 25 to 30. The Ce/Ce* and Y/Ho ratios of host rocks from the Inuyama area show a similar trend to the conodonts (Fig. 2; Supplementary Table S7). Conodonts from the Taho Limestone have negative Ce/Ce* anomalies (0.53–0.75; Supplementary Table S6a, b) and high Y/Ho ratios (45–94; Supplementary Table S6).
The molar fraction of major elements in the conodonts in the siliceous pelagic deep-sea sedimentary rocks in the Inuyama area is Ca : P : F = 10 : 6.0 : 2.1 (average from 84 total spots in 16 conodonts), which is consistent with the ratios from the conodonts of the Taho Limestone (10 : 6.0 : 2.0). Conodonts from the deep-sea sedimentary rocks lack the replacement by Si and Al, which are the major components of the surrounding rocks. Therefore, the conodont specimens in the deep-sea siliceous sediments preserve the primary major element compositions to the same degree as conodonts from the Taho Limestone (Figs. 5 and 6). The major element fractions of conodont specimens with minimal thermal maturation reported in previous studies from peri-continental sites are Ca : P : F = 10 : 6.0 : 1.5 (honey-brownish-colored Devonian conodonts from USA; Pietzner et al., 1968) and Ca : P : F = 10 : 6.2 : 1.6 (Devonian conodonts from Russia with CAI of 1.0–1.5; Frank-Kamenetskaya et al., 2014).
Although the Ca/P value is similar between our specimens and previous studies, molar ratios of F/Ca (or F/P) are slightly higher than those reported in previous studies. One possible explanation for the differences of molar ratios of F/Ca (or F/P) is the diagenetic replacement of OH– by F– over time (Kohn et al., 1999). The sedimentary rock samples in the accretionary complex are generally buried deeper than those of peri-continental sedimentary sequence. Thus, the different degrees of diagenesis between conodonts from the Japanese accretionary complex (both siliceous rocks from Inuyama aera and carbonate rocks from Taho) and previously reported Devonian conodont elements may have caused the differences in F/Ca (or F/P). However, given that Triassic conodonts from the Inuyama area and Taho Limestone, which experienced different diagenetic conditions (e.g., different lithologies of host rocks, presence of REEs-rich layer, and its color), have almost the same F/Ca (or F/P), the different degree of diagenetic alteration alone may not account for the difference in F contents between our samples and those of previous studies.
Another possibility for the high F contents is the influence of the electron beam during EPMA analysis. Stormer et al. (1993) and Goldoff et al. (2012) reported that the F intensity of synthetic anhydrite fluorapatite [Ca5(PO4)3F] gradually increased with time during EPMA measurement because of diffusion of F to the surface of the sample. The porous structure of conodont fossils may have resulted in high susceptibility to beam damage. Also, the possibility that the major elemental composition of conodont elements in living conodont animals had changed from Devonian to Triassic cannot be ruled out. In order to test these possibilities, further data accumulation will be required.
Distribution and concentrations of REEs in conodonts from the deep-sea siliceous sedimentsElemental maps show that REEs in conodont specimens from the deep-sea siliceous sedimentary rocks are concentrated at the surfaces of denticles, and cracks (represented by Nd and Y; Figs. 5 and 6). These high-REE layers are ~2–10 μm thick (Figs. 4 and 6). The areas with high REE concentrations correspond to the luminescent blue-colored layers in CL images (Figs. 4 and 7). However, such blue-luminescent layers were not observed in the conodont specimens from the Taho Limestone (Fig. 7c). Previous studies have revealed that REE ions serve as effective activators in apatite (Mariano et al., 1975; Mitchell et al., 1997; Kempe and Götze, 2002), and, in particular, apatite containing Eu2+ shows strong blue luminescence under CL (Mariano et al., 1975). Therefore, this blue fluorescence represents the high concentration of REEs in the cracks and outer rims of denticles. During LA-ICP-MS measurement of some samples from the Inuyama area, the intensity of Y increased sharply near the boundary between conodonts and the host rocks (Fig. 8a), suggesting the presence of thin REE-rich layers at the margins of conodonts from the pelagic deep-sea sedimentary rocks. The enlarged images of REE-rich layers in the cracks and margins of denticles revealed euhedral shapes, indicating growth of authigenic apatite (Fig. 4). If the cracks had formed when the conodonts were alive, the broken elements would have been healed and united again. The absence of healing structures in the fractured portions indicates that the authigenic apatite in the cracks within conodonts formed after their deposition and took up REEs from the porewater. In most spots, concentrations of REEs of conodonts from the pelagic deep-sea sedimentary rocks (6.7–6600 ppm, mean 1100 ppm) are higher than those of conodonts in the Taho Limestone (28–240 ppm, mean 108 ppm) (Supplementary Tables S3 and S4). These differences in REE concentrations could be partly ascribed to the existence of secondary apatite and its diagenetic uptake of REEs. Inner parts of some conodonts from the Inuyama area possess very high REEs comparable to the REEs-rich layer (Fig. 9a–c). These high REE concentrations could be ascribed to the inclusion of REEs-rich layers that formed in tiny cracks and pores within the conodonts.
REE patterns of conodonts from deep-sea siliceous sediments and their originThe REE patterns of most conodont fossils in the deep-sea sedimentary rocks show a bulge in MREEs (Fig. 9). These patterns differ from those of seawater (heavy-REE rich; Nozaki, 2001) and Triassic to Jurassic siliceous rocks in the Inuyama area (mainly flat to heavy-REE rich reported in Fujisaki et al., 2016). Typically, a bulge in MREEs is characteristic of the diagenetic uptake of REEs (Bright et al., 2009; Chen et al., 2015; Li et al., 2017) as a result of different partition coefficients among REEs when they precipitate (Koeppenkastrop and De Carlo, 1992; Reynard et al., 1999). These features are different from the representative REE patterns of modern seawater (De Baar et al., 1985) and are interpreted as a diagenetic overprint. These features are evident not only for the REEs-rich layers but also the inner part of conodonts (Fig. 9). Indeed, a conodont sample from the Mt section (Mj2) with extremely low REE concentrations also has a bulge in MREEs (sample with the lowest concentration of REEs in Fig. 9a). Since this sample is considered to have experienced the weakest diagenetic uptake of REEs, it is likely that REE information of the inner, non-recrystallized part are also diagenetically overprinted through the diffusion of REEs from the porewater.
In contrast, conodont fossils from the Taho Limestone show low REE concentrations and negative Ce/Ce*, closer to modern seawater. These data suggest that the post diagenetic uptake of REEs were far less significant for the conodont specimens from the Taho Limestone compared to the conodont specimens from the deep-sea rocks from Inuyama area. Although conodonts from the Taho Limestone show flat REE-patterns (Fig. 9), it is different from the heavy REE enriched pattern of modern seawater. This dissimilarity may be ascribed to the alteration of the porewater REE pattern (Haley et al., 2004) or minor fractionation during the uptake of REEs (Reynard et al., 1999). Besides, considering that REE patterns of the inner part of the conodonts from the Taho Limestone, which remain unaffected by the acid, are totally different from those of the Inuyama are (Fig. 9), it appears that the differences in the REEs do not stem from the differences in the extraction methods. Regarding the above, the difference in the REE patterns of conodonts from the deep-sea siliceous rocks and the Taho Limestone is explained by different diagenetic uptakes.
An important question is to what degree the original REE signature of paleo-seawater is preserved in the conodonts in the pelagic deep-sea sedimentary rocks. The Y/Ho ratio is often used as an indicator of the degree of post-depositional uptake of REEs from terrigenous material (Zhao et al., 2013; Chen et al., 2015). The Y/Ho ratios of clastic materials are typically 25–30, while those of seawater are ~65 (Zhao et al., 2013; Chen et al., 2015; Li et al., 2017). The conodont fossils and surrounding siliceous sedimentary rock in the Inuyama area exhibit low Y/Ho ratios (25–50; Fig. 2). This result indicates that >90% of the REEs were originally derived from the surrounding clastic sediments via porewater. The stratigraphic variation of Ce/Ce* of the conodont specimens from the deep-sea siliceous sediments is similar to that of the surrounding host rocks measured in this study (Figs. 2 and 10). On the other hand, conodont specimens from the Taho Limestone have negative Ce/Ce* and relatively high Y/Ho ratios (~65 in average of 5 points) (Fig. 9d), implying that the REEs information reflects that of hydrogenous values.
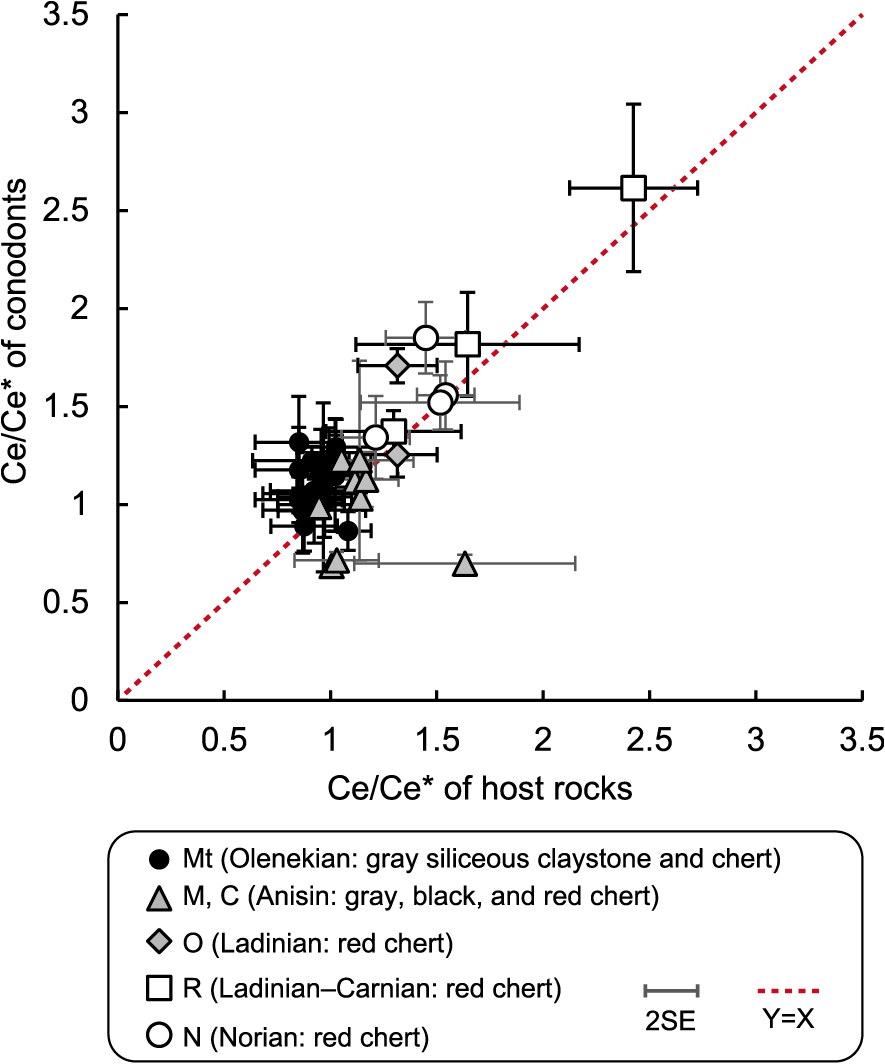
Cross-plot of Ce/Ce* values of conodont fossils and surrounding host rocks. The red line indicates Y = X (1 : 1).
These results suggest that REEs in the conodont fossils from the deep-sea siliceous sediments primarily reflect those of the surrounding host sedimentary material and does not hold the information of the seawater they were originally formed in.
Variation of Ce/Ce* in conodont fossilsAlthough we concluded that most of the REE information of the conodonts were originated from the surrounding silicate minerals, Ce/Ce* exceptionally showed distinctive stratigraphic patterns, which cannot be explained by the REEs solely from silicate minerals. The Olenekian (upper Lower Triassic) to Anisian (lower Middle Triassic) conodonts and their host siliceous rocks show no Ce/Ce*. In contrast, Ladinian (upper Middle Triassic) to Norian (upper Upper Triassic) conodonts and their host reddish siliceous rocks show positive Ce/Ce* (Fig. 2). Similar trends of Ce/Ce* have been observed in the Lower Triassic to Lower Jurassic chert in the Inuyama area and interpreted as the change in the redox conditions of paleo-seawater (Fujisaki et al., 2016). In the modern pelagic deep-sea environment, Mn-oxides oxidize Ce from Ce3+ to Ce4+ under oxic conditions (Takahashi, Y. et al., 2015). Since Ce4+ is insoluble and attaches to the surface of Mn-oxides, sediments on oxic seafloor tend to exhibit strong positive Ce/Ce*. As sediments are buried deeper and the diagenetic conditions become reducing, Mn-oxides dissolve and release REEs with positive Ce/Ce* into the porewater, but these REEs are scavenged by precipitated authigenic apatite, which preserves the positive Ce/Ce*. If this geochemical process also occurred at the Triassic seafloor, the positive Ce/Ce* of the Upper Triassic conodont specimens and surrounding red chert would reflect the existence of Mn oxides under oxic bottom water conditions (Fujisaki et al., 2016), and precipitation of apatite after deposition, given that vertical porewater migration is limited to some extent. Indeed, Fujisaki et al. (2016) reported high Mn concentration in the Upper Triassic chert in the Inuyama area. On the other hand, the conodonts and siliceous rocks of the Olenekian to Anisian do not show Ce anomalies. Since these rocks contain pyrite and have low Mn contents compared with the Upper Triassic red chert (Takahashi, S. et al., 2015; Fujisaki et al., 2016; Soda and Onoue, 2018), they could have been deposited under reducing conditions, with no Mn-oxides in the depositional environment to supply surplus Ce. Since Fe-Mn oxides can take low Y/Ho ratios (<~28: Bau et al., 1996), the presence of Fe-Mn oxides does not contradict with the constantly low Y/Ho ratios (~25–30) in the red chert interval of the Inuyama area. It is notable that some greenish-gray Anisian bedded chert in the Inuyama area have relatively high Mn concentrations, but lack Ce/Ce* variation (Fujisaki et al., 2016). This contradiction implies that Mn abundances in bedded chert were not determined solely by the presence of Mn-oxides but also influenced by other unknown factors.
The changes in Ce/Ce* are consistent with the changes in color of sedimentary rocks (Fig. 2). The strata of the Ladinian to Norian with positive Ce/Ce* show reddish color which was ascribed to the presence of hematite due to oxic bottom water conditions (Sato et al., 2011) (Fig. 2). On the other hand, most of the Olenekian to Anisian siliceous rocks with no Ce/Ce* are gray, greenish gray, and black colored and lack hematite, suggesting oxygen-depleted bottom water conditions (Fig. 2). Exceptions are hematite-bearing red chert during the Anisian which has no Ce/Ce*. Although one red-chert sample (C4) showed positive Ce/Ce*, other Anisian red chert and conodonts have no pronounced Ce/Ce* (Fig. 2). Fujisaki et al. (2016) also reported that Anisian red chert in the Inuyama area had no to slightly negative Ce/Ce*. The redox threshold for the formation of Fe-Mn oxides is more oxidizing than that for hematite. Therefore, bottom water during the Anisian could have been oxic enough to form hematite, but not fully oxic enough to produce Fe-Mn oxides with positive Ce/Ce*. Thus, we propose that the oceanic oxygen depletion event in central Panthalassa especially well-known for its culmination around the Permian–Triassic boundary (Algeo et al., 2011; Takahashi, S. et al., 2015; Onoue et al., 2021) persisted until the end of Anisian and the deep-sea floor became fully oxic from the Ladinian.
Our data revealed that REEs of conodonts in the siliceous sedimentary rocks in the accretionary complex of the Inuyama area are primarily derived from surrounding siliceous sediments via porewater and do not record hydrogenous information. However, Ce/Ce* of conodonts and surrounding sedimentary rock deposited under oxidized condition can be strongly influenced by the presence of Mn oxides, which indirectly records the paleo-redox condition of bottom water.
We investigated the preservation of chemical composition and elemental distribution of conodonts from deep-sea sedimentary rocks in the Inuyama area to evaluate their potential application in the reconstruction of pelagic paleo-environments of Panthalassa. The molar fractions of major elements in conodonts (Ca : P : F = 10.0 : 6.0 : 2.0) are close to conodonts in limestone, suggesting that the conodonts from the deep-sea sedimentary rocks did not experience pronounced alteration of their original major elemental compositions. Elemental mapping of REEs and CL images show the presence of REE-rich layers at the margins of denticles and in cracks within conodonts from the Inuyama area where euhedral crystals have formed, which suggests significant post-depositional uptake of REEs associated with authigenic apatite. The Ce/Ce* and low Y/Ho ratios of conodonts are similar to their host rocks, suggesting that most of the REEs in the conodonts were acquired during diagenesis from surrounding sediments. Our observations suggest that the REE signatures of the conodont fossils in the deep-sea siliceous sediments are strongly influenced by the surrounding sedimentary rocks. Among these REE information, Ce/Ce* of both conodonts and surrounding sedimentary rocks reflect the presence of Fe-Mn oxides at the paleo-seafloor and can indirectly reflect the paleo-redox condition of bottom waters.
We thank Koji Ichimura and Hideto Yoshida of The University of Tokyo for their technical assistance with the analyses. We are grateful to Prof. Rie S. Hori at the University of Ehime for providing the limestone sample. We also express gratitude to Profs. Junichiro Kuroda, Yoshio Takahashi, and Takanobu Tsuihiji for valuable advice and discussion that improved the manuscript. This study was supported in part by JSPS (#17K05689). We thank Prof. Manuel Rigo and an anonymous reviewer for their constructive comments.