ARTICLE
Hydrogen diffusion in apatite parallel to the c-axis under vapor flow

2024 年 58 巻 1 号 p. 1-8

詳細
2024 年 58 巻 1 号 p. 1-8
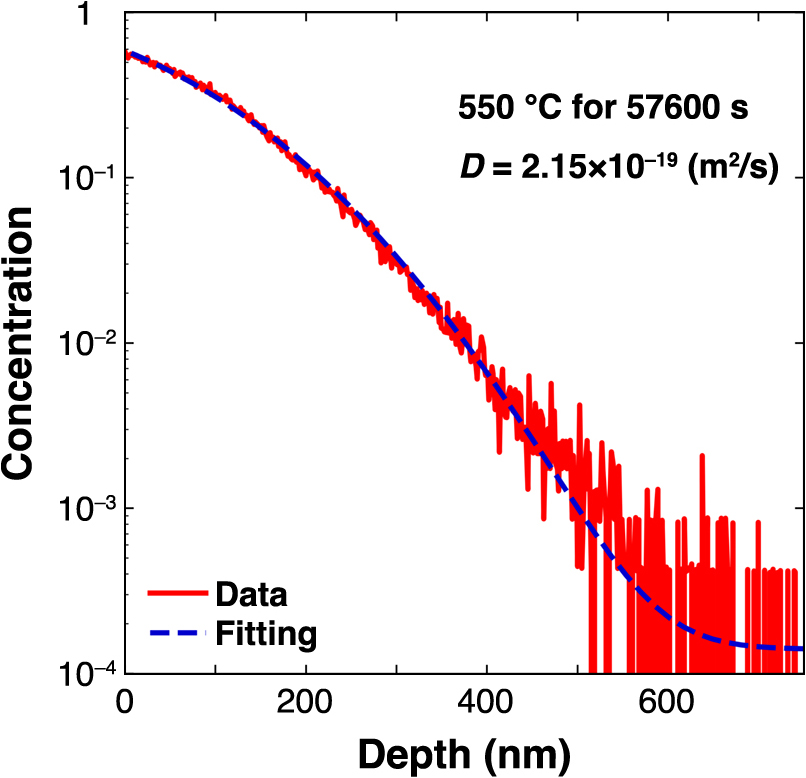
Apatite is ubiquitous in various planetary bodies in the Solar System. Because its structure contains a hydroxy group, researchers have performed extensive investigations to determine the hydrogen isotopic composition of apatite to reveal the origins and evolution of water in planetary bodies. The hydrogen isotopic composition in apatite can change owing to diffusion. Although there have been several diffusion studies related to hydrogen in apatite, they vary in experimental conditions, such as the diffusion source and pressure, making it difficult to estimate the change in hydrogen isotopic composition. Herein, we report hydrogen diffusion experiments under a 2H2O/O2 vapor flow at 550°C–700°C using apatite slices with better surface conditions by adapting new polishing methods. 2H concentration depth profiles were obtained via secondary ion mass spectrometry, and the diffusion coefficients were obtained by fitting the profiles using Fick’s second law. The temperature dependence of the diffusion coefficients at 550°C–700°C is represented as the following expression:
This indicates a reduction in the influence of fast diffusion paths, reported by Higashi et al. (2017). These diffusion coefficients would be the hydrogen self-diffusion coefficients in apatite by lattice diffusion and should be employed instead. In addition, the activation energy of diffusion was consistent with oxygen diffusion under wet conditions, thus suggesting that hydrogen diffuses via a mechanism similar to that of oxygen in apatite.
Apatite is ubiquitous in a wide range of the Solar System material samples from the Earth (e.g., Piccoli and Candela, 1994), the Moon (McCubbin et al., 2010; Greenwood et al., 2011; McCubbin et al., 2015; Ustunisik et al., 2015; Brounce et al., 2019; Wang et al., 2019), as well as in Martian meteorites (Greenwood et al., 2008; McCubbin and Nekvasil, 2008), chondrites (e.g., Ebihara and Honda, 1987; Göpel et al., 1994), achondrites (e.g., Steele and Smith, 1982), and Ryugu (e.g., Yokoyama et al., 2023). Apatite is typically composed of Ca5(PO4)3(F,Cl,OH) and exhibits a hexagonal crystal structure (a = 9.4–9.6 Å, c = 6.8–6.9 Å) with a P63/m space group symmetry and anion-bearing sites arranged along the c-axis (Hughes et al., 1989; Hughes and Rakovan, 2015). The anionic components of apatite, F, Cl, and OH, can interchange; thus, apatite is categorized as fluorapatite, chlorapatite, or hydroxyapatite, depending on the occupancy of these anion sites (Hughes et al., 1989). Owing to the presence of highly volatile elements, such as F, Cl, and OH, at the anion site, apatite serves as a useful medium for recording volatile components and water in fluids and magmas (e.g., Boyce and Hervig, 2008; Boyce and Hervig, 2009; Marks et al., 2012; Harlov, 2015; McCubbin and Jones, 2015; Webster and Piccoli, 2015; Kusebauch et al., 2015). Because apatite contains hydrogen, researchers have performed extensive investigations to determine its hydrogen isotopic composition to reveal the origins and evolution of water of Solar System materials (e.g., Greenwood et al., 2008, 2011; Yanai et al., 2012; Barnes et al., 2013; Tartèse et al., 2013; Jones et al., 2014; Usui et al., 2015). Without considering the potential hydrogen isotope variations during water-rock interactions, the isotopic composition of the observed isotopes after crystallization could have changed. Hence, understanding hydrogen diffusivity in apatite during water-rock interactions is crucial.
Several diffusion studies pertaining to volatile elements in apatite have been conducted (e.g., Brenan, 1993; Higashi et al., 2017; Li et al., 2020). These studies were performed using various experimental setups, such as closed, open, and flow systems. For example, Brenan (1993) conducted an experimental study using a closed system. In this study, the diffusion rate of F-Cl was estimated experimentally under hydrothermal and dry conditions at 1 GPa and 1 atm, respectively. By contrast, Li et al. (2020) performed an experiment using an open system. In particular, they performed F-Cl-OH inter-diffusion experiments at atmospheric pressure and obtained the diffusion coefficient of OH using mathematical methods. However, to estimate hydrogen isotope variations, the hydrogen concentration in the crystal must be constant and the depletion of F or Cl must not occur. Moreover, to estimate variations in the hydrogen isotopic composition, one must determine whether hydrogen self-diffusion or OH, F, or Cl interdiffusion is dominant. Recently, Higashi et al. (2017) reported hydrogen diffusion in apatite using a 2H2O/O2 vapor flow system. The total concentrations of hydrogen and deuterium obtained from secondary ion mass spectrometry (SIMS) measurements remained constant, thus indicating hydrogen self-diffusion. This suggests that 1H and 2H can be exchanged in flow-type diffusion experiments. Although there have been studies on the diffusion of various volatile components in apatite, experiments such as those by Higashi et al. (2017) that directly determine hydrogen diffusion using a 2H2O/O2 vapor flow system are the best for estimating the variations in the hydrogen isotopic composition. This is because estimating self-diffusion coefficients by inter-diffusion can lead to preferential use of F-Cl-OH sites.
In this study, we focus on flow-type experiments for 2H diffusion in apatite single crystals to account for the fact that the study by Higashi et al. (2017) featured a technical problem pertaining to surface treatment. This problem resulted in fast diffusion paths in the 2H diffusion profiles, which consequently altered the results, such as the diffusion coefficient and activation energy. We resolve this issue and present a new dataset for hydrogen diffusion parallel to the c-axis of apatite single crystals; subsequently, we propose a mechanism for hydrogen diffusion.
Transparent natural fluorapatite from Durango, Mexico was selected as the sample for this study. Durango apatite is large and of gem quality, and has been investigated extensively in terms of mineralogy and chemistry. According to Young et al. (1969), the chemical composition of Durango apatite is Ca9.83Na0.08Sr0.01RE0.09(PO4)5.87(SO4)0.05(SiO4)0.06(AsO4)0.01(CO3)0.01F1.90Cl0.12(OH)0.01. Meanwhile, the water content of Durango apatite is reported to be approximately 500–1000 ppm H2O (McCubbin et al., 2015).
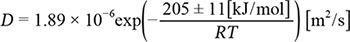
Two single crystals were cut perpendicular to the c-axis into slices measuring 1–2 mm thick and then adjusted to a size of approximately 0.5–1 cm using a low-speed diamond saw to obtain the hydrogen diffusivity of apatite parallel to the c-axis (Fig. 1a). The apatite slices were polished with 9, 1, and 0.5 μm diamond paste via rotation, and a final chemical polish was applied with colloidal silica via a vibratory method (Fig. 1b). Chemical polishing was employed to remove natural and/or polishing-induced dislocations and fine scratches (Fig. 1c). Yurimoto et al. (1989) reported that chemical treatments effectively removed the tail of a depth profile caused by dislocations. Subsequently, the polished samples were cleaned ultrasonically with detergent, pure water, and hot pure water.
(a) Durango apatite crystals cut vertically to c-axis into 1–2-mm-thick specimens. (b) Apatite slices polished using 9, 1, and 0.5 μm diamond paste via rotation. (c) Apatite slices chemically polished using colloidal silica with vibration. (d) Overview of diffusion reactor used in experiment. Furnace interior is shown in cross section, which shows the sample placed in the center of the tube. Wet course can be selected only when diffusion occurs. Partial pressure of heavy water vapor is controlled using mantle heater, and gas mixture with oxygen establishes contact with apatite sample.
Hydrogen diffusion experiments using apatite slices were conducted in a reactor at Kyoto University (Fig. 1d). This reactor was specifically optimized for flow-type diffusion experiments, thus enabling the surrounding temperature and the humidity of the gas flowing through the sample to be controlled. A K-type thermocouple (TC) was placed near the sample to control the temperature precisely. Because of the natural hydrogen isotopic composition of the samples, heavy water (2H2O > 99.75% 2H abundance) was used. The diffusion source comprised a mixture of oxygen (as a carrier gas) and heavy water vapor. The pressure of the diffusion source was maintained at approximately 0.57 atm (with saturated vapor at 85°C) using a mantle heater (as calculated by Tetens, 1930). The flow rate of the oxygen carrier gas was set to 600 sccm at 1 atm. A flow-type experiment was designed to maintain a constant concentration of 2H2O gas on the sample surface during annealing. The furnace was equipped with a valve to allow switching between dry and wet flows, and the experiment was conducted by switching to wet flow only when diffusion occurred. The temperature of the hydrogen diffusion treatment ranged from 550°C to 700°C. The annealing duration ranged from 3600 s (at 700°C) to 57600 s (at 550°C). Prior to each diffusion annealing experiment, a pre-annealing step at 150°C for 3600 s under dry flow was performed to eliminate adsorbed water on the sample surfaces.
SIMS analysisAfter the diffusion experiments, depth profiling was performed on all the apatite samples via SIMS (Cameca 4f-E7, Kyoto University). The post-experimental apatite slices were coated with Au (~50 nm) to prevent charge accumulation on the surface during SIMS analysis. A +14.5 kV accelerated 133Cs+ primary ion beam with currents of 3–5 nA and a spot size of ~15 μm was used for all measurements. The primary ion beam was rasterized to more than 100 μm × 100 μm at each analysis point to create flat-bottomed bore craters. To avoid contamination from residual hydrogen in the sample chamber, the vacuum was maintained below 5 × 10⁻⁸ Pa throughout the measurements using a large liquid nitrogen cold-trap system manufactured by Techno-IS Corporation. Sputtered secondary ions were acquired from the central area of ~30 μm diameter, which was cut off using a mechanical aperture to minimize artifacts arising from the border of the primary ion beam crater. A normal-incident electron gun (with an accelerating voltage of 4.5 kV) was used to flood electrons onto the surface to ensure charge compensation. Negative secondary ions 1H–, 2H–, and 18O– were acquired sequentially using an electron multiplier. Each secondary ion, i.e., 1H–, 2H–, and 18O–, were measured for 1 s per cycle. The depth of the SIMS craters were measured using a surface profiler (Surfcorder ET200; Kosaka Lab. Ltd., Osaka, Japan). The sputtering rates were 0.05–0.1 nm/s.
Diffusion analysisTo determine the lattice diffusion coefficient (Dl), the profile of C[2H] = 2H/(1H + 2H) was adjusted to fit the solution of the diffusion equation obtained by assuming a constant concentration of 2H at the sample surface and diffusion in a semi-infinite medium (Crank, 1975). The diffusion profiles were fitted to the following least-squares equation:
| (1) |
Here,
C(x,t) = isotopic concentration at depth x from the surface, also denoted as C[2H].
Cs = surface concentration.
C0 = background concentration.
Dl = lattice diffusion coefficient.
t = duration of diffusion experiment.
erfc = 1 – erf (where erf is the Gaussian error function).
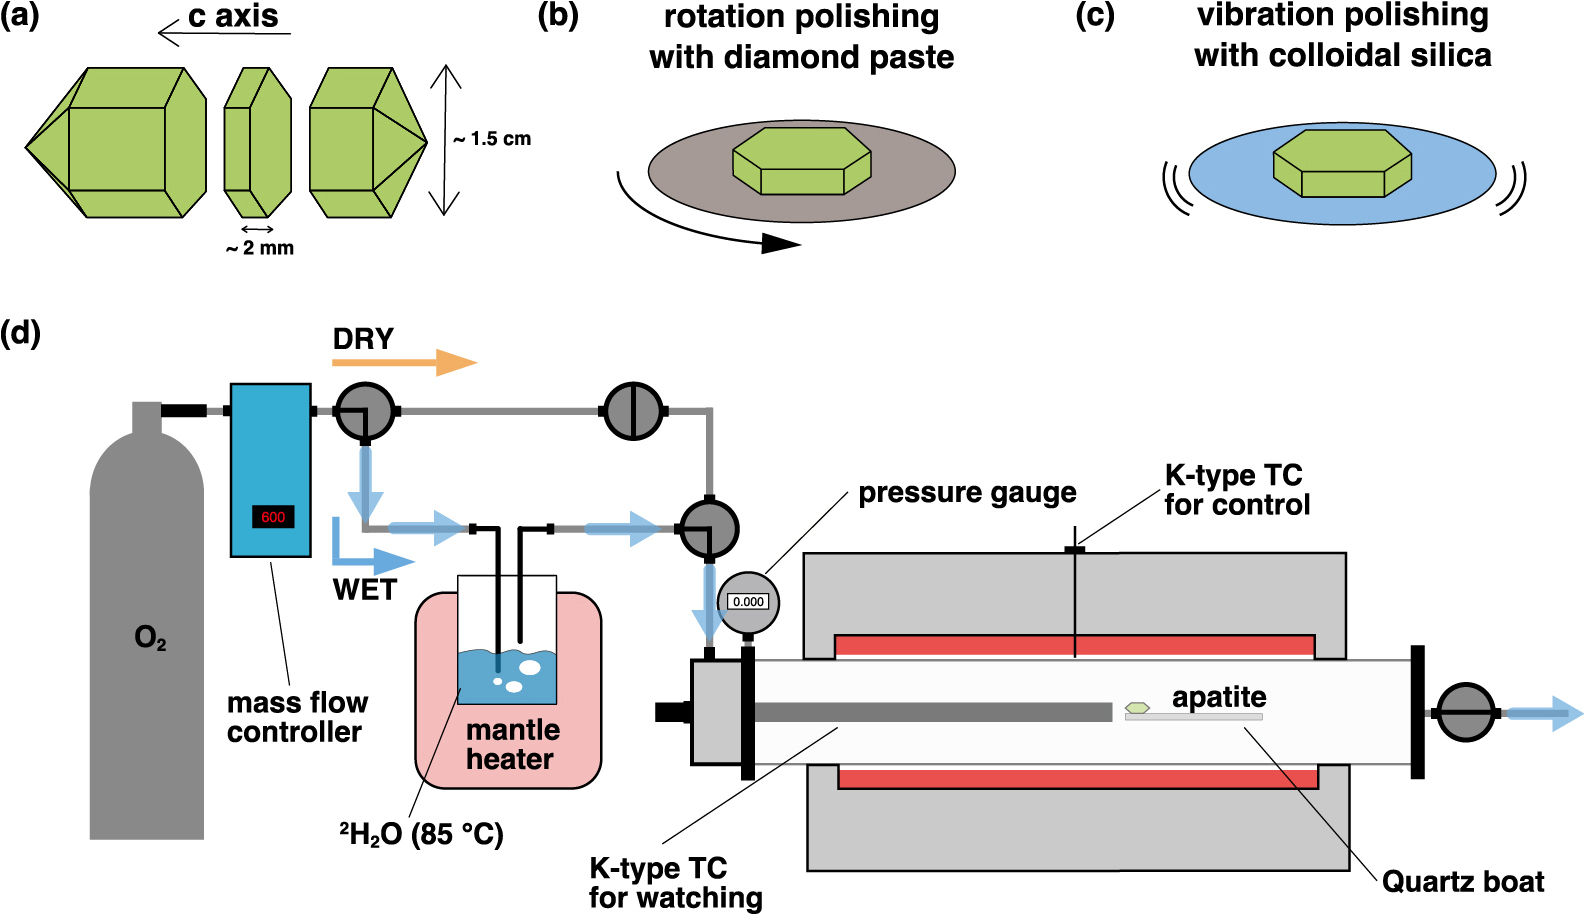
Figure 2 presents the 1H/18O, 2H/18O, and (1H + 2H)/18O values from the SIMS depth analysis of an apatite diffusion sample treated at 550°C. The value of 2H/18O decreased from approximately 1.4 × 10⁻² at the surface to approximately 4 × 10⁻⁴, whereas the 1H/18O value increased from approximately 1.1 × 10⁻² to 2.0 × 10⁻². The (1H + 2H)/18O values, which correspond to the total hydrogen concentration, remained constant at approximately 2 × 10⁻² within the apatite crystal. This shows that the experimental hydrogen diffusion was driven by an isotope-exchange reaction. Similar characteristics were observed in the diffusion profiles from experiments conducted at other temperatures.
Representative depth SIMS analysis data showing relative intensity values of 1H/18O, 1H/18O, and (1H + 2H)/18O in Durango apatite tested at 550°C for 57600 s.
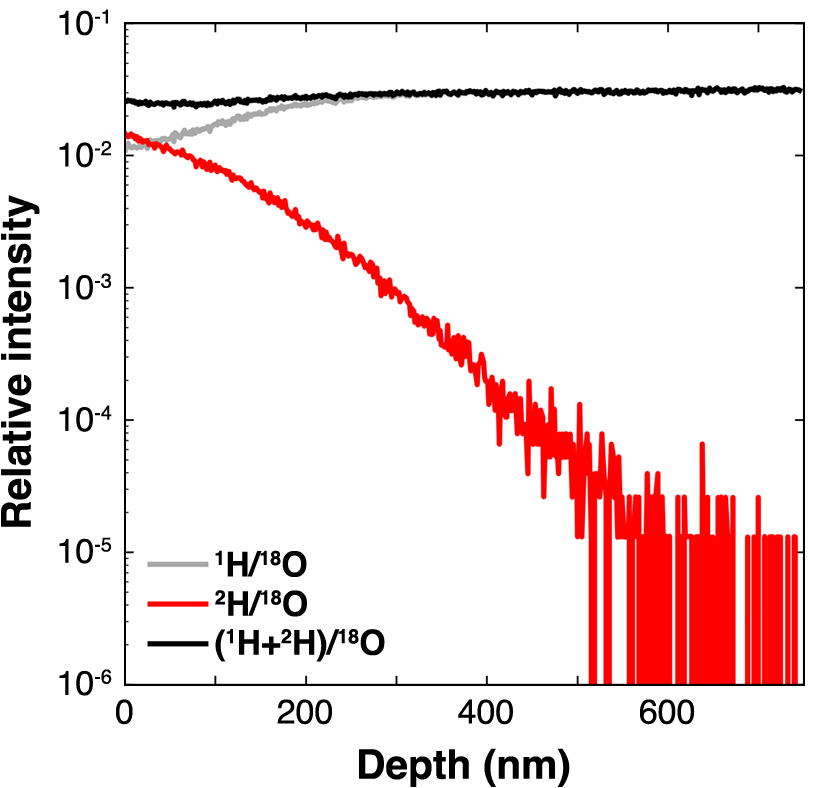
The concentration of 2H, represented as C[2H] (calculated as 2H/(1H + 2H)) for the 550°C experiment, is shown in Fig. 3 (see Fig. S1 in Supplemental Materials for fitting results from experiments at other temperatures). The C[2H] at the surface was approximately 0.6, which decreased to the background concentration at a depth of 600 nm. The C[2H] decreased monotonically, thus implying that 2H diffusion occurred via a single mechanism. The background concentration was approximately 1.4 × 10⁻⁴, which is almost equal to the natural deuterium isotopic concentration in apatite (Greenwood, 2018). Figure 3 shows the results fitted using Eq. (1), as indicated by dotted curves. The curve fitted well with the depth data from the surface to the background and yielded a diffusion coefficient (D) of 2.15 × 10⁻¹⁹ m2/s. The mean values and standard deviations of the diffusion coefficients for each temperature derived by fitting the diffusion data at other temperatures are listed in Table 1 (see Table S1 in Supplemental Materials for all results). The diffusion coefficients of hydrogen in apatite ranged from 2.11 × 10⁻¹⁹ m2/s at 550°C to 1.82 × 10⁻¹⁷ m2/s at 700°C.
Representative diffusion profile of the concentration (C[2H] = 2H/(1H + 2H)) with depth in apatite crystal, which was tested in hydrothermal condition for 57600 s at 550°C; least-squares linear regression was performed fit to the data points.
Hydrogen diffusion coefficients in two apatite crystals
| Sample | T (°C) | Time (s) | D (m2/s) |
|---|---|---|---|
| Ap_a*9 | 550 | 57600 | 2.11 ± 0.32 × 10⁻¹⁹ |
| Ap_a*6 | 600 | 14400 | 9.09 ± 1.00 × 10⁻¹⁹ |
| Ap_b*10 | 650 | 3600 | 5.21 ± 0.54 × 10⁻¹⁸ |
| Ap_a*8 | 700 | 3600 | 1.82 ± 0.42 × 10⁻¹⁷ |
*a and b: represent different crystals. The errors for D are the standard deviation calculated from the mean value for each analysis.
Dl generally exhibits temperature dependence, as expressed by the Arrhenius equation:
| (2) |
where D0 is a pre-exponential (frequency) factor, Ea the activation energy, and T the temperature. Figure 4 illustrates the Arrhenius relationship for hydrogen diffusion in Durango apatite parallel to the c-axis at 550°C–700°C, which is expressed as

Arrhenius plots of hydrogen self-diffusion results for apatite, showing diffusion coefficient results at each temperature and their least-squares fitting in two studies (this study and Higashi et al., 2017); modeled fit lines when dislocation areal density, d = 1 × 10¹³, 1 × 10¹⁴, and 2 × 10¹⁵ m–2. Temperature dependence of this study is D = 1.89 × 10⁻⁶ exp
The fitting results of Higashi et al. (2017) did not fit well with the concentration profile at locations deeper than 200 nm, where the C[2H] was approximately 40%. By contrast, our data demonstrated good fit with the profile and background. This indicates that improving the conditions of the apatite surface reduces the effect of fast diffusion, thus enabling the lattice diffusion coefficients to be estimated experimentally.
Fast diffusion is postulated to occur through dislocations. Hart (1957) indicated that the effective diffusion coefficient (apparent diffusion coefficient) Deff can be approximated as:
| (3) |
where f is the volume fraction of the material in the dislocations, Dd the dislocation diffusion coefficient, and Dl the lattice diffusion coefficient. If the dislocation diffusion follows the dislocation pipe model, then f can be expressed as follows:
| (4) |
where a is the pipe radius and d is the dislocation areal density. Yurimoto et al. (1989) provided empirical data pertaining to the Dd and Dl of melilite crystals. The temperature dependences of Deff for Dd/Dl = 1 × 10⁵, a = 0.5 nm, and d = 1 × 10¹³, 1 × 10¹⁴, 2 × 10¹⁵ (plausible values provided by Yurimoto et al., 1989), as well as Dl from this study are shown in Fig. 4. We note that the specific values are for melilite and may not be suitable for apatite. The modeled line for d = 1 × 10¹³ m–2 intersected the line from Higashi et al. (2017) at approximately 700°C, intersected it at approximately 600°C for d = 1 × 10¹⁴ m–2, and overlapped with the exterior line of the model line for d = 2 × 10¹⁵ m–2 at 500°C. The dislocation density at each temperature was estimated based on the position of each intersection. Because d (i.e., f) should be reduced due to the annealing of the crystals, the value of d for the intersecting lines decreased as the temperature increased, thereby resulting in Arrhenius plots with a gentle slope, as observed by Higashi et al. (2017). Moreover, dislocations minimally affect Deff for d values less than 1 × 10¹² m–2 (e.g., when d = 1 × 10¹² m–2, Deff/Dl = 1.08). The value of d in this study was likely less than 1 × 10¹² m–2. Consequently, the dislocations on the surfaces of the apatite single crystals polished with colloidal silica were likely eliminated, thus yielding lattice diffusion coefficients.
Diffusion mechanism of hydrogen in apatiteFigure 5 illustrates the temperature dependence of the diffusion coefficient for ions occupying the anion sites in apatite. Studies pertaining to O, OH, F-Cl, and H, including our study, used different experimental techniques. These varying techniques resulted in different diffusion coefficients and activation energies. In the following section, we discuss our hydrogen diffusion mechanism.
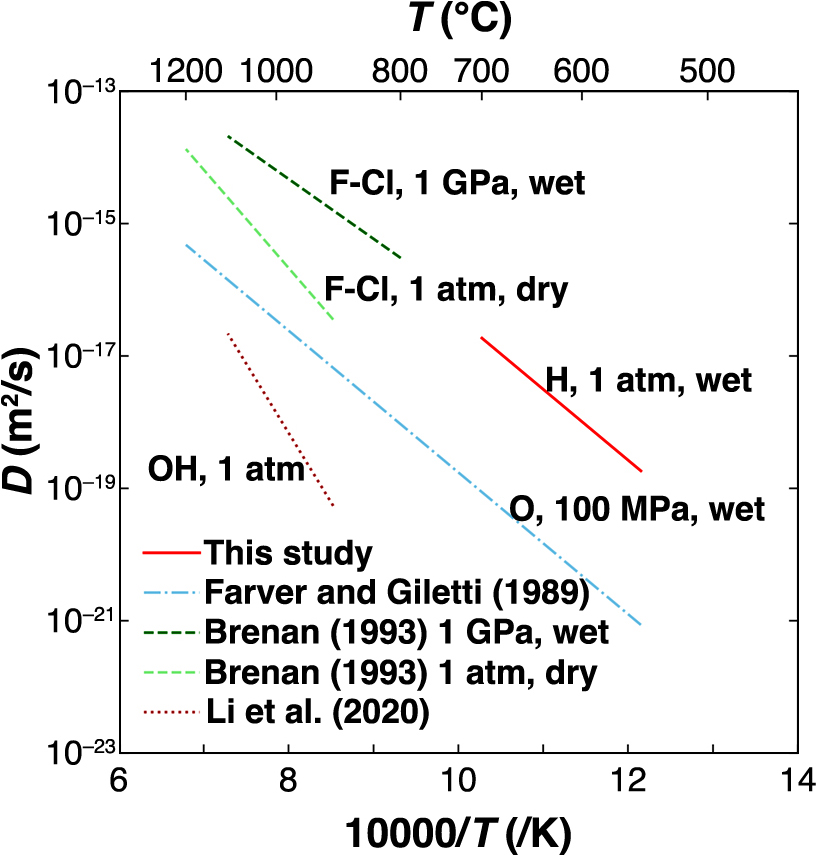
Arrhenius plot of diffusion in apatite in this study, compared with literature data for the diffusivities of ions occupying anion sites in apatite. Farver and Giletti (1989): oxygen, 100 MPa, wet; Brenan (1993): F-Cl, wet, 1 GPa, F-Cl, dry, 1 atm; Li et al. (2020): OH, 1 atm.
The self-diffusion coefficient for oxygen reported by Farver and Giletti (1989) was derived from the isotope doping method using water as the diffusion source and applying SIMS depth profiling. This method is similar to the method used in our diffusion experiment, except that different systems were used (a closed system with tubes vs. a flow-type system) because a pressure of 100 MPa was applied during oxygen diffusion. The activation energies for oxygen diffusion at 205 ± 12 kJ/mol reported by Farver and Giletti (1989) were consistent with ours at 205 ± 11 kJ/mol within the margin of error, and the diffusion mechanisms are expected to be similar. As oxygen diffusion is presumed to occur via oxygen vacancies, hydrogen diffusion may be associated with oxygen vacancies.
Brenan (1993) conducted diffusion experiments parallel to the c-axis in two closed systems, i.e., wet at 1 GPa and dry at 1 atm. The starting materials were fluorapatite from Durango and chlorapatite from Snarum, Sweden, and their interdiffusion coefficients were subsequently determined. Our data may appear as an extension of the Arrhenius plot for wet condition data from Brenan (1993). However, the diffusion coefficient for OH was not obtained directly from Brenan (1993) because of the limitation of spatial resolution, and the diffusion coefficient at 1 atm can potentially increase owing to the effect of the activation volume. Notably, the diffusion coefficient under dry conditions at 1 atm was lower than that under wet conditions at 1 GPa. Brenan (1993) explained that the OH contents affects diffusivity. F– and Cl– diffused faster than O2–, thus suggesting that the monovalent anion OH– can diffuse more rapidly than oxygen. Hydrogen diffused faster than oxygen, which is attributable to the diffusion of monovalent anions being faster than that of divalent anions. This is consistent with the finding that the diffusion coefficient of F-Cl from wet and dry experiments by Brenan (1993) was larger than that of oxygen by Farver and Giletti (1989).
OH is considered to be the diffusing species in this study, but the value is significantly different from the self-diffusion coefficient of OH obtained by Li et al. (2020), and the activation energy is also about half (Fig. 5). Note that the two results may not be directly comparable due to the difference in the temperature ranges. The OH self-diffusion coefficients in Li et al. (2020) were obtained analytically from the F-Cl-OH interdiffusion experiment, so the OH self-diffusion coefficients may be due to the mechanism using the F-Cl-OH site. In our experiment, on the other hand, the self-diffusion coefficient was obtained directly from flow experiments using heavy water vapor as the diffusion source. Since Durango fluorapatite has very low OH content (500–1000 ppm), it is difficult to consider that hydrogen diffused using only OH sites, which have longer distance from each other, and it is reasonable to consider our diffusion using oxygen sites. The difference in their self-diffusion coefficients should be due to this difference in diffusion mechanisms. Therefore, we conclude that OH– serves as a diffusing species for hydrogen diffusion under hydrothermal conditions.
The hydrogen-diffusion coefficient in apatite was determined experimentally using deuterium as a tracer. To minimize potential damage during polishing, colloidal silica was used to finish the polished apatite. The diffusion coefficients in apatite parallel to the c-axis at 550°C–700°C indicated temperature dependence, as follows:
This indicates a diminished effect of the fast diffusion pathways as compared with the results of Higashi et al. (2017). Furthermore, the activation energy for diffusion obtained in this study was consistent with that reported by Farver and Giletti (1989), thus implying that the diffusion mechanisms are likely related and that OH– serves as the diffusing species.
We are grateful for review and improving manuscript from Dr. Romain Tartese and the anonymous reviewer and the editor Dr. Conel M. O’D. Alexander. We would also like to thank Editage (www.editage.jp) for English language editing. This research was partly supported by JSPS KAKENHI (22K18280, 21H04519, 21H04511, 21H01177, 20H01994, 19H00716, 18H04367, 18H01296, 16H01118).