Introduction
Osmium isotopic compositions and precise concentration data for highly siderophile elements (HSE) and volatile chalcophile elements, demonstrating resolvable differences between different chondrite groups, are crucial for considering a range of formation and evolutionary processes. Although considerable effort has been devoted to understanding the processes that fractionate these elements in chondrites and their precursors, the detailed origin of these fractionations remains unclear (e.g., Brandon et al., 2005; Fischer-Gödde et al., 2010; Horan et al., 2003; Walker et al., 2002; Wang and Becker, 2013). Recent sample return missions such as the Hayabusa2 (Morota et al., 2020; Tachibana et al., 2022) and the OSIRIS-Rex (Lauretta et al., 2017) give an opportunity for obtaining detailed chemical information on extraterrestrial materials in the laboratory, which cannot be obtained by remote sensing or in-situ observations with instruments on board the spacecraft.
In the current state of the art, wet chemical analysis involving sample destruction presents the most reliable data on bulk elemental abundances and isotopic compositions. Therefore, for multi-element analyses on precious materials, a vital issue is to design an analytical strategy that maximizes the number of elemental and isotopic data from a limited amount of sample (Nakamura et al., 2022; Yokoyama et al., 2023). For example, Yokoyama et al. (2023) prepared about 25 mg of powdered samples from aggregates of Ryugu samples. The authors digested the samples in clean Teflon vials by sequentially adding mixed acids, including HF, HNO3, HCl, and H2O2. The abundances of 54 elements were successfully determined by ICP-MS analysis using <10% of aliquots of the dissolved sample solution, and the remaining aliquots were used for the respective isotopic analysis such as Cr, Ti, Fe, Ca, Cu, Zn, Nd, Sr, Pb, and Mo after multi-stage column separations. However, several chalcophile elements (S, Ge, Sn, Sb, Te, and Hg) and all highly siderophile elements (HSEs: Ru, Rh, Pd, Re, Os, Ir, Pt, and Au) were excluded from the ICP-MS analysis in Yokoyama et al. (2023) due to incomplete recovery or possible volatile loss during acid digestion.
This issue has been addressed by studies of the Re-Os isotopic system, which have shown that sample digestion in a sealed glass vessel is preferable for quantitative Os recovery, as a closed Teflon vial cannot prevent volatile loss of OsO4 (Shirey and Walker, 1995). Therefore, a different powder aliquot is required to obtain high-quality Re-Os isotope data than is required for most other isotopic systems. The current database on Re-Os isotopes in terrestrial/extraterrestrial samples is dominated by data from isotope dilution mass-spectrometry (ID-MS) coupled with inverse aqua regia digestion in closed glass vessels such as Carius tube (CT) or a high-pressure asher (HPA) at elevated temperatures and pressures (e.g., Meisel et al., 2003; Shirey and Walker, 1995; Walker et al., 2002). These techniques are now developed for obtaining a comprehensive dataset of other HSE abundances and 187Os/188Os on the same aliquot (Becker et al., 2006; Fischer-Gödde et al., 2010; Horan et al., 2003; Pearson and Woodland, 2000).
In this study, we evaluated the analytical capabilities of sealed glass tube digestion for the abundance determination of not only HSEs (Ru, Rh, Pd, Re, Os, Ir, Pt, and Au) but also VCEs (S, Ge, As, Se, Sn, Sb, and Te) and some other elements (Mg, Al, Ca, and Mo) on the same digestion aliquot for 187Os/188Os analysis. The Allende meteorite reference sample prepared and distributed by the Smithsonian Institution (Smithsonian Allende) was selected for method validation, and small aliquots of sample powder less than 20 mg were repeatedly analyzed along with total procedural blanks. The abundance of S, Ge, Se, Ru, Pd, Sn, Sb, Te, Re, Ir, and Pt was determined using the ID-MS. The isotope dilution-internal standardization (ID-IS) method (Makishima and Nakamura, 2006) was applied to quantify the abundance of Mg, Al, Ca, As, Mo, Rh, and Au. Since Au, Rh, and As are mono-isotopes, the ID-IS method is essential for accurately assaying these abundances. Fischer-Gödde et al. (2010) presented Rh and Au abundance data for 30 bulk chondrites, including the Smithsonian Allende from the same digestion aliquot for 187Os/188Os and other HSEs quantified with ID-MS. Although they employed a technique for quantifying Rh and Au relative to Ir after cation exchange chromatography (Meisel et al., 2003), we adopted a more simplified but robust technique by using ICP-MS/MS coupled with collision-reaction cell (CRC) without matrix separation procedure of sample solutions.
Although the glass vessel digestion techniques have a clear advantage in circumventing the volatile loss of target elements before achieving spike-sample equilibration, there are several potential drawbacks when combining 187Os/188Os analysis. The primary disadvantage of this technique is the more significant amounts of blanks presumably derived from the glass tube than from the cleaned Teflon vial. In addition to this, each spike solution needs to be clean and contain a negligible amount of Os and other elements. Thus, blank amounts and variations could be an important limiting factor for successful measurements. Another disadvantage is that the HF cannot be used with a glass tube in the initial digestion step. Several studies on geological reference materials claimed that HF desilicification elevates the extraction of Re, Ru, and some chalcophiles, at least from basaltic samples (Ishikawa et al., 2014; Zhou et al., 2019; Zou et al., 2020). Therefore, we employed HF desilicification after CCl4 solvent extraction of Os following the methods described in Ishikawa et al. (2014). This method requires insignificant loss of target elements during CCl4 solvent extraction of Os, particularly for elements quantified by ID-IS. We describe the potential problems in this paper by comparing data from the total procedural blank and the Smithsonian Allende before and after the column separation procedures.
Experimental Section
Reagents and apparatus
Pure water with a resistivity of 18.2 MΩ cm was obtained through the Milli-Q water purification system manufactured by Merck Millipore. For the sample digestion and chemical separation, the following highly purified chemicals were employed: HNO3, HCl, HF, HBr, and H2O2 from Tama Chemical Industry, ultrapure-grade H2SO4 from Kanto Chemical, CrO3 from Merck Millipore, UGR-grade CCl4 from Kanto Chemical for trace analysis purposes, infinity pure-grade CHCl3 from Wako Pure Chemical Industries, and N-benzoyl-N-phenylhydroxylamine (BPHA) from Tokyo Chemical Industry Co. Ltd. To mitigate any potential contamination of Os in HNO3, H2O2 was added to purge Os in the HNO3 utilized for sample digestion, following the approach described by Yang et al. (2015), which is called “purged HNO3” in the following section.
Unlike Carius tubes with a narrowed neck and thick body, we used straight quartz tubes made of high-purity quartz glass for sample digestion, primarily to reduce blanks. The quartz tube is 22 cm long, 1.0 cm internal diameter, and 2 mm thick, with sufficient internal volume to digest the relatively small sample sizes used. The approximate inner volume of the quartz tubes after closure is 10 cm3. The outer steel tube is 30 cm long and 3 cm internal diameter. The quartz tubes were pre-cleaned in sub-boiling aqua regia diluted with ultrapure water. Polypropylene pipette tips, test tubes, and columns were cleaned with ultrapure water and 1% solution of high-purity alkaline detergent TMSC (TAMA Chemical) prior to the use for the solution transfer, sample storage, and chemical separation. After the chemical separation, the used polypropylene columns were cleaned with ultrapure water and aqua regia for subsequent use. Anion (AG 1-X8) and cation (AG 50W-X8) exchange resins were manufactured by Muromachi Chemicals and BioRad and were freshly prepared for each separation. Anion exchange resins were pre-cleaned twice with 6 mol l–1 HCl and 6 mol l–1 HNO3 and rinsed with pure water. Cation exchange resins were pre-cleaned overnight with 6 mol l–1 HCl and pure water. Teflon vials were employed as containers for drying sample solutions and dissolving samples in acid. After each use, these vials were cleaned using fiber wipes and then subjected to boil in 1% solution of TMSC for at least 24 h, followed by sequential cleaning with electronic industry (EL)-grade 6 mol l–1 HCl (Kanto Chemical), EL grade 0.5 mol l–1 HNO3 (Kanto Chemical) and pure water. In addition, Teflon conical vials utilized for micro-distillation were washed with concentrated HBr. After each cleaning step, the vials were rinsed three times in pure water.
Calibration and spike solutions
For the instrumental mass discrimination and isobaric interference corrections, six mixed standard solutions of S-Mg-Al-Fe, Ge-Zr-Sn-Sb-Hf-Ta, Se-Te, Ru-Rh-Pd-Re-Ir-Pt-Au, Y-Tm-Yb-Lu, and Cd-Hg-Pb-U were prepared by gravitational dilution using the commercial standard solutions. The spike solutions of Re and platinum group elements (PGEs: Ru, Pd, Os, Ir, and Pt) were described in Ishikawa et al. (2014). For the S spike, elemental sulfur enriched in 34S was dissolved in HBr. Mixed spikes of 77Se -126Te and 73Ge -119Sn -121Sb were prepared and dissolved with 0.5 mol l–1 HNO3 - trace HCl and 0.4 mol l–1 HNO3 - 0.1 mol l–1 HF, respectively. All spike solutions were calibrated against the commercial standard solution by reverse isotope dilution.
Chemical procedure
Figure 1 illustrates the outline of the chemical procedure employed in this study. The Smithsonian Allende (USNM 3529, Split 20 Position 31), spike solutions for 34S, 73Ge, 77Se, 99Ru, 105Pd, 119Sn, 121Sb, 126Te, 185Re, 190Os, 191Ir, 196Pt, along with 0.25 ml of 9 mol l–1 HCl and 0.75 ml of the purged HNO3 were cooled with dry ice, sealed in the quartz-glass tube, and heated at 240°C for 72 h. We also prepared blank solutions by sealing spike solutions, along with 0.25 ml of 9 mol l–1 HCl, and 0.75 ml of the purged HNO3, in quartz tubes and heating them in an oven. Spike solutions identical to the sample were used but at a lower concentration, specifically for the HSE.
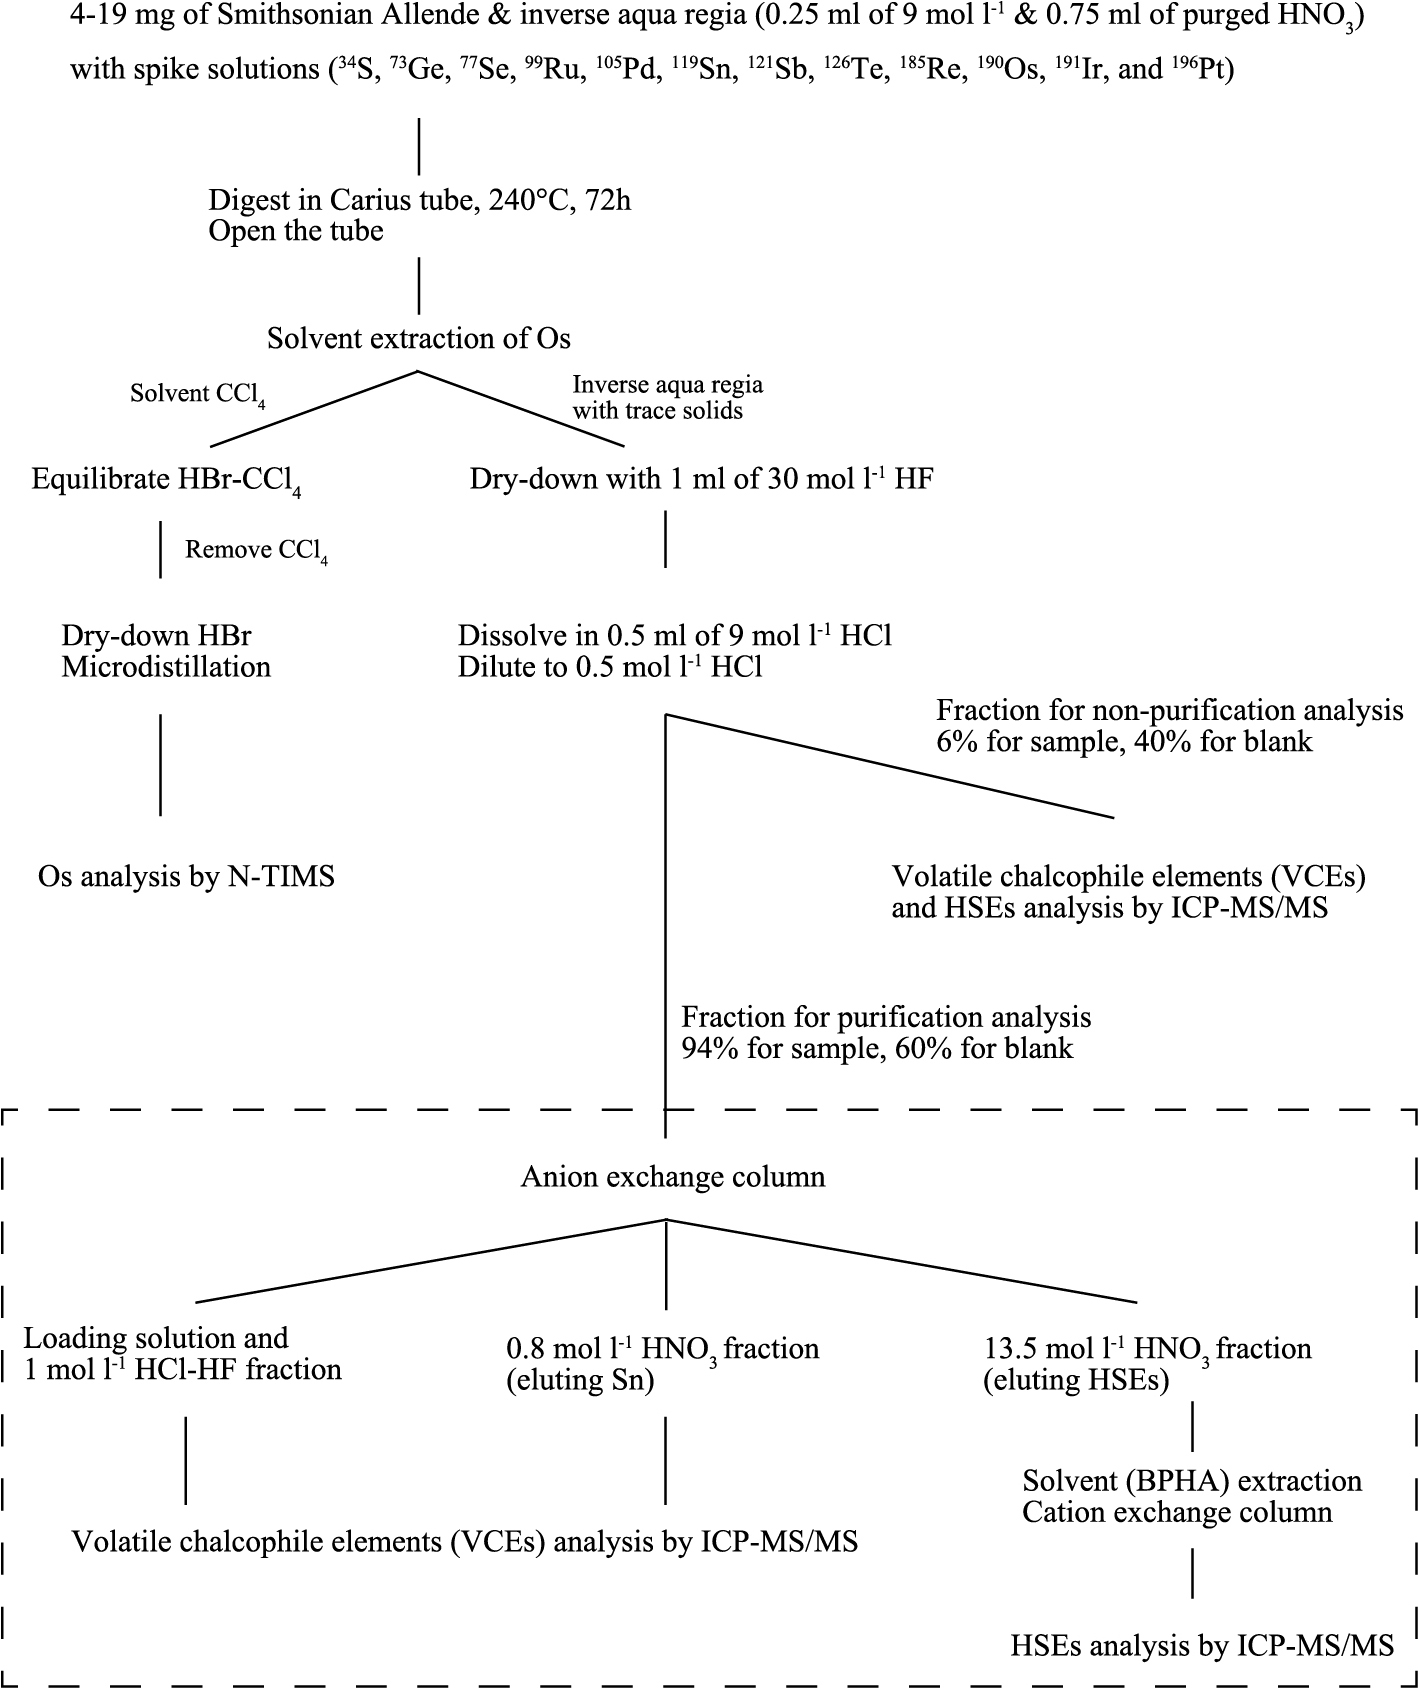
After digestion, the sample solution containing trace amounts of residual solids in the quartz glass tube was quantitatively transferred into a 15 ml polypropylene test tube by using 1.0 ml of Milli-Q water to rinse the inner wall of the quartz glass tube. Three solvent extractions with 0.5 ml of CCl4 extracted Os from the sample solution (Cohen and Waters, 1996), and only the Os-bearing CCl4 was transferred into a 15 ml Teflon vial. Subsequently, 0.5 ml of HBr was added to extract Os from 1.5 ml (total) of CCl4 containing Os.
For evaporation, we used the Analab EvapoClean, a V-shaped Teflon tube with Teflon vials attached at both ends. The unit can heat and dry one vial and store the evaporated substance in the other vial, allowing the evaporation process to occur in an enclosed space. After reducing the volume of Os-bearing HBr by using the closed vaporization device, the microdistillation technique with 15 μl of concentrated HBr and 10 μl of H2SO4–CrO3 (Birck et al., 1997; Nakanishi et al., 2019) was employed to purify Os ready for loading on the filament for negative thermal ionization mass spectrometry (N-TIMS) analysis (Creaser et al., 1991; Völkening et al., 1991).
The inverse aqua regia remaining after the Os extraction was desilicified by adding 1.0 ml of 30 mol l–1 HF and then gently dried at <80°C without using the closed vaporization device. After drying, 0.5 ml of 9 mol l–1 HCl was added to dissolve and diluted with pure water to 0.5 mol l–1 HCl. A fraction containing 6% (0.5 ml out of 9 ml) of the sample solution and 40% (4 ml out of 10 ml) of the blank solution was isolated and diluted with 0.5 mol l–1 HCl for elemental composition analysis by ICP-MS/MS. The sample solution was then divided into aliquots in test tubes to measure the concentrations of Ge, As, Se, Mo, Sn, Sb, Te, and HSEs by ICP-MS/MS using dilution factors (DF) of approximately 10,000. The sample solutions were diluted with 0.5 mol l–1 HCl at a DF of approximately 100,000 for the analysis of S, Mg, Al, and Ca.
The remaining 94% (8.5 ml out of 9 ml) of the sample solution and 60% (6 ml out of 10 ml) of the blank solution were purified by anion and cation exchange column chromatography and N-benzoyl-N-phenylhydroxylamine (BPHA) solvent extraction, following the method described by Ishikawa et al. (2014). In brief, 1 ml of anion exchange resin, AG1-X8, was loaded into a polypropylene column. The resin bed was cleaned with 2 ml of 13.5 mol l–1 HNO3 and 2 ml of 6 mol l–1 HCl and then conditioned with 10 ml of 0.5 mol l–1 HCl. Subsequently, the loading solution and the fractions eluted with 10 ml of 1 mol l–1 HCl + 1 mol l–1 HF in anion exchange column chromatography were collected and used to analyze Ge-Se-Sb-Te. Tin was eluted with 10 ml of 0.8 mol l–1 HNO3 before the elution of Ru, Re, Ir, and Pt with 10 ml of 13.5 mol l–1 HNO3. Palladium was then collected in 10 ml of 6 mol l–1 HCl. The HSE fractions collected post-anion exchange column were dried, dissolved in 0.5 ml of 0.5 mol l–1 HCl, and subjected to solvent extraction with a mixture of 0.5 ml of 0.025 mol l–1 BPHA in CHCl3 for further purification. Finally, 0.5 ml of cation exchange resin AG 50W-X8 was loaded into the polypropylene column, cleaned with 1 ml of 6 mol l–1 HCl, and conditioned with 1 ml of 0.5 mol l–1 HCl. The sample solutions were then passed through a cation exchange resin for HSE analysis, followed by ICP-MS/MS analysis.
Instruments
The abundance of Os and the 187Os/188Os ratio were measured as OsO3– ions by N-TIMS using a Triton Plus (Thermo Fisher Scientific, USA) at the Tokyo Institute of Technology (Tokyo Tech). The purified Os was loaded onto Pt wire filaments (Alfa Aesar) with 0.75 μl NaOH-Ba(OH)2 as an ionization activator. Seven masses of osmium trioxides (m/e = 232, 234, 235, 236, 237, 238, and 240) were measured in static mode using Faraday cup collectors. A 1013 Ω amplifier was equipped with the L1 cup for 187OsO3– measurement in static mode, while 1011 Ω amplifiers were connected to the other collectors. In cases where the signal was weak, several measurements were performed using a secondary electron multiplier (SEM) in peak jumping mode. Os isotopic fractionation in the TIMS analysis was corrected according to the exponential law, assuming 192Os/188Os = 3.08271 (Luck and Allègre, 1983), and Os abundance was quantified using the ID-MS with 190Os/188Os. The oxygen isotopic composition was assumed to be 17O/16O = 0.0003749 and 18O/16O = 0.0020439 (Nier, 1950). Interferences from rhenium-oxide ions were not corrected because the monitored mass 233 of 185ReO3– has a negligible low signal, resulting in its effect on the 187Os/188Os ratio being less than 550 ppm. Analysis of the UMd Os standard (load size 35 pg–18 ng) yielded the 187Os/188Os ratios of 0.11385 ± 12 (2s, n = 8) and 0.11379 ± 4 (2s, n = 4) using the SEM peak jumping and FC static modes, respectively, which are in good agreement with previously published data (Brandon et al., 2005).
Elemental abundances except for Os were determined by ID-IS-ICP-MS/MS analysis using iCAP TQ (Thermo Fisher Scientific, USA) installed at the Tokyo Institute of Technology (Tokyo Tech). This instrument has a collision-reaction cell (CRC) that can remove interferences in chemical analysis by pressurizing it with different gases. This process can selectively react with the analyte and/or interfere with a reactive gas or collide the ions with a non-reactive gas, combined with kinetic energy discrimination. This instrument also has an additional quadrupole mass filter in front of the collision reaction cell, called the MS/MS system. The first quadrupole filter (Q1) acts as a mass filter, allowing only ions with one m/z ratio to enter the cell, followed by the second quadrupole filter (Q2). This system offers better control of the reactions taking place in the cell. The abundances of S, Ge, Se, Ru, Pd, Sn, Sb, Te, Re, Ir, and Pt were determined using the ID-MS, while the abundances of Mg, Al, Ca, As, Mo, Rh, and Au were determined using the ID-IS method. Tables 1 and 2 show the ICP-MS/MS operating conditions, reaction gas, and scanning conditions for the individual analytes. MS/MS mass-shift mode with O2 reaction gas (O2 mode) was used for Mg, Al, S, Ca, Ge, As, and Se. Helium Collision and Kinetic Energy Discrimination mode (He-KED mode) was used to analyze Mo, Sn, Sb, Te, and HSE. All measurements were performed using an SEM pulse-counting mode.
Table 1.
ICP-MS/MS operation conditions
| Plasma power |
1550 W |
| Torch |
Quartz glass torch |
| Injector |
Quartz glass or sapphire injector |
| Plasma Ar gas flow rate |
14 l min–1 |
| Auxiliary Ar gas flow rate |
0.80 l min–1 |
| Nebulizer Ar gas flow rate |
1.03 l min–1 |
| Nebulizer |
Micro-flow PFA nebulizer |
| Spray chamber |
Quartz or PFA cyclonic spray chamber cooled by Peltier |
| Sampling cone |
Made of Ni |
| Skimmer cone |
Made of Ni |
| Background correction |
On-top background correction measured before each sample after 20 s wash |
Table 2.
Analytical mode, scanning conditions, and BEC in ICP-MS/MS
| Gas flow (ml min–1) |
Q1 scanned isotope |
Q2 scanned isotope |
Dwell time (ms) |
BEC |
Diluted CI concentration |
| O2 mode (mass-shift) |
|
|
|
|
|
| 0.36 |
26Mg |
26MgO |
0.01 |
0.6 ppb |
952 ppb |
|
27Al |
27AlO |
0.01 |
2 ppb |
84 ppb |
|
32S |
32SO |
0.01 |
5 ppb |
536 ppb |
|
34S |
34SO |
0.01 |
10 ppb |
536 ppb |
|
42Ca |
42CaO |
0.01 |
3 ppb |
88 ppb |
|
57Fe |
57FeO |
0.01 |
0.2 ppb |
186 ppb |
|
72Ge |
72GeO |
0.05 |
3 ppt |
3340 ppt |
|
73Ge |
73GeO |
0.05 |
4 ppt |
3340 ppt |
|
75As |
75AsO |
0.05 |
4 ppt |
1770 ppt |
|
77Se |
77SeO |
0.05 |
400 ppt |
2040 ppt |
|
80Se |
80SeO |
0.05 |
400 ppt |
2040 ppt |
| He-KED mode |
|
|
|
|
|
| 4.175 |
— |
89Y |
0.01 |
0.2 ppt |
150 ppt |
|
— |
90Zr |
0.01 |
4 ppt |
379 ppt |
|
— |
99Ru |
0.05 |
0.01 ppt |
67 ppt |
|
— |
101Ru |
0.05 |
n.d. |
67 ppt |
|
— |
103Rh |
0.05 |
0.01 ppt |
13 ppt |
|
— |
105Pd |
0.05 |
0.06 ppt |
56 ppt |
|
— |
108Pd |
0.05 |
0.1 ppt |
56 ppt |
|
— |
111Cd |
0.01 |
0.2 ppt |
69 ppt |
|
— |
118Sn |
0.05 |
4 ppt |
163 ppt |
|
— |
119Sn |
0.05 |
4 ppt |
163 ppt |
|
— |
121Sb |
0.05 |
6 ppt |
17 ppt |
|
— |
123Sb |
0.05 |
6 ppt |
17 ppt |
|
— |
126Te |
0.05 |
10 ppt |
231 ppt |
|
— |
128Te |
0.05 |
20 ppt |
231 ppt |
|
— |
169Tm |
0.01 |
n.d. |
2.6 ppt |
|
— |
171Yb |
0.01 |
n.d. |
17 ppt |
|
— |
175Lu |
0.01 |
n.d. |
2.5 ppt |
|
— |
178Hf |
0.01 |
0.1 ppt |
11 ppt |
|
— |
181Ta |
0.01 |
n.d. |
1.5 ppt |
|
— |
185Re |
0.05 |
0.03 ppt |
3.7 ppt |
|
— |
187Re |
0.05 |
0.03 ppt |
3.7 ppt |
|
— |
191Ir |
0.05 |
0.002 ppt |
47 ppt |
|
— |
193Ir |
0.05 |
0.007 ppt |
47 ppt |
|
— |
195Pt |
0.05 |
0.04 ppt |
93 ppt |
|
— |
196Pt |
0.05 |
0.05 ppt |
93 ppt |
|
— |
197Au |
0.05 |
0.2 ppt |
15 ppt |
|
— |
201Hg |
0.01 |
6 ppt |
29 ppt |
|
— |
206Pb |
0.01 |
3 ppt |
264 ppt |
|
— |
238U |
0.01 |
n.d. |
0.8 ppt |
BEC: Background equivalent concentration. n.d.: not detected. Diluted CI concentration: diluted CI chondrite (Lodders, 2021) concentration at DF = 100000 (Mg, Al, S, and Ca) and 10000 (others). Q1 and Q2 are the first and second quadrupole mass filter units equipped with the ICP-MS/MS. Dwell time is the time the analytical instrument accumulates the signal.
This study applied the ID-MS to determine the abundance of S, Ge, Se, Ru, Pd, Sn, Sb, Te, Re, Os, Ir, and Pt. The apparent concentration of the spike was calibrated by measurements of multiple mixtures of the spike and the standard solutions using ICP-MS. The applied isotope ratios are 34S/32S, 73Ge/72Ge, 77Se/80Se, 99Ru/101Ru, 105Pd/108Pd, 119Sn/118Sn, 121Sb/123Sb, 126Te/128Te, 185Re/187Re, 190Os/192Os, 191Ir/193Ir, and 196Pt/195Pt.
The ID-IS technique was applied to determine the abundances of Mg, Al, Ca, As, Mo, Rh, and Au. The ID-IS method is appropriate for determining As, Rh, and Au because these elements are mono-isotopic.
Details of ID-IS are described in Yokoyama et al. (2017). The concentration of analyte (X) in the sample is expressed by combining the ID and IS methods using the spiked internal standard element (Z) as follows:
|
CsmpX=Ismp(iX)Istd(iX)·Istd(kZ)Ismp(kZ)·CstdXCstdZ·CspkZ·MsmpZMspkZ·wspkwsmp·plak·Rspk-Rsmp1-Rsmp/Rmix,
| (1) |
where I is the measured signal intensity, C is the abundance of an analyte element, M is the atomic weight, w is the weight of the sample or spike, and R is the isotope ratio. Moreover, ak and al are the abundances of isotopes of an analyte element in the natural sample. pk and pl are those in the spike. Here, the isotope ratios in the sample and spike are expressed by Rsmp (=ak/al) and Rspk (=pk/pl), respectively. iX and kZ are the measured isotopes of analyte element and the internal standard element. The “smp”, “std”, and “spk” denote the sample, standard, and spike, respectively.
In the ID-IS method, the abundance of Mg (iX: 26Mg), Al (iX: 27Al) and Ca (iX: 42Ca) abundances were determined using S (R: 34S/32S) as an internal standard, while Se (R: 77Se/80Se) for As (iX: 75As), Ru (R: 99Ru/101Ru) for Mo (iX: 97Mo) and Rh (iX: 103Rh), and Pt (R: 196Pt/195Pt) for Au (iX: 197Au) were used as internal standards.
Results and Discussion
Evaluation of the performances of ICP-MS/MS with CRC
In ICP-MS analysis, the increase in background and isobaric interferences due to molecular ions can significantly affect analytical results. ICP-MS/MS with CRC has the potential to address these spectral interferences. This section assesses the performance of ICP-MS/MS with CRC in HSE and VCE analyses, particularly in terms of background equivalent concentration (BEC) and the interference formation ratio over the sample analysis period.
Table 2 displays the isotopes analyzed and their corresponding BEC, the magnitude of a signal in 0.5 mol l–1 expressed as the total element concentration calculated using each isotope. The BEC thus reflects the reagent blank of 0.5 mol l–1 HCl and the background due to molecular ion interferences. The BEC for all elements is significantly lower than the elemental concentration of the chondrite sample solution, which was diluted by factors ranging from 10000 to 100000. The background levels for 72GeO+, 75AsO+, and 77SeO+ were low (72GeO+ <10 cps, 75AsO+ <30 cps, 77SeO+ <100 cps), overcoming the challenges posed by polyatomic ions such as ClCl+ and ArCl+ in the analysis of Ge, As, and Se abundances in HCl matrices. It should be noted that the BECs for specific elements (Ge, Se, Sn, Sb, Re) remain consistent across their isotopes, meaning that the primary source of the BEC is mainly from the reagent blank in hydrochloric acid and that the contribution of unknown molecular interferences is minimal.
Table 3 summarizes the interference formation ratios and contribution rates in the Smithsonian Allende analysis using an ICP-MS/MS with CRC. Analysis in the He-KED mode adequately eliminated the formation of oxides, especially RbO+, SrO+, and CdO+, which were undetected. Even in the O2 mode analysis, few spectral interferences due to oxide ions were detected and successfully resolved. However, in the case of iron, non-negligible spectral interferences caused by oxide ions may still occur during MS/MS mass shift mode analysis when using O2 reaction gas. Thus, it is essential to evaluate these potential interferences when analyzing iron. This phenomenon occurs when FeO+ ions pass through the first mass filter before reacting with oxygen in the reaction cell to form FeO2+ ions, which then pass through the second mass filter. Although the spectral interferences generated by this process are typically insignificant and can often be disregarded, careful attention must be paid to monitoring the rate of oxide formation during analysis when analyzing chondrites with an exceptionally high Fe/Ge ratio.
Table 3.
Interference forming ratios and interference contribution rates
| Target ion |
Interference |
Interference formation ratio |
Interference contribution rate |
| O2 mode (mass-shift) |
|
|
|
|
| 72GeO+ |
56FeO2+ |
(FeO2+/FeO+)* |
0.001% |
12.4% |
| 73GeO+ |
57FeO2+ |
|
|
3.6% |
| 75AsO+ |
150Nd2+ |
Nd2+/Nd+ |
n.d. |
— |
| 75AsO+ |
150Sm2+ |
Sm2+/Sm+ |
n.d. |
— |
| 77SeO+ |
154Gd2+ |
Gd2+/Gd+ |
n.d. |
— |
| 80SeO+ |
160Gd2+ |
|
|
— |
| 80SeO+ |
160Dy2+ |
Dy2+/Dy+ |
n.d. |
— |
| He-KED mode |
|
|
|
|
| 101Ru+ |
85RbO+ |
RbO+/Rb+ |
n.d. |
— |
| 103Rh+ |
87RbO+ |
|
|
— |
| 103Rh+ |
87SrO+ |
SrO+/Sr+ |
n.d. |
— |
| 103Rh+ |
206Pb2+ |
Pb2+/Pb+ |
0.01% |
0.02% |
| 105Pd+ |
89YO+ |
YO+/Y+ |
0.2% |
0.9% |
| 108Pd+ |
92ZrO+ |
ZrO+/Zr+ |
0.3% |
2.8% |
| 119Sn+ |
238U2+ |
U2+/U+ |
0.6% |
1.9% |
| 126Te+ |
110CdO+ |
CdO+/Cd+ |
n.d. |
— |
| 128Te+ |
112CdO+ |
|
|
— |
| 185Re+ |
169TmO+ |
TmO+/Tm+ |
2.9% |
0.3% |
| 187Re+ |
171YbO+ |
YbO+/Yb+ |
0.2% |
0.2% |
| 191Ir+ |
175LuO+ |
LuO+/Lu+ |
0.7% |
0.06% |
| 193Ir+ |
177HfO+ |
HfO+/Hf+ |
1.9% |
0.2% |
| 195Pt+ |
179HfO+ |
|
|
0.3% |
| 196Pt+ |
180HfO+ |
|
|
0.4% |
| 197Au+ |
181TaO+ |
TaO+/Ta+ |
1.9% |
1.9% |
(FeO2+/FeO+)* represents the ratio of the signal of 57FeO2+ (m/z = 73 in Q1 and 89 in Q2) to that of 57FeO+ (m/z = 57 in Q1 and 73 in Q2) in MS/MS mass shift mode analysis using O2 reaction gas. n.d.: not detected.
The doubly charged ions of rare earth elements (REEs) have the potential to interfere with Ge, As, and Se, making robust elemental analysis with ICP-MS difficult. However, doubly charged REE ions were not detected by ICP-MS/MS using the O2 mass-shift mode (Table 3). On the other hand, the efficiency of the He-KED mode in eliminating doubly charged ions may be limited, as observed at slightly higher formation ratios of Pb2+ and U2+. As such, the ICP-MS/MS with CRC technology exhibited high performance in resolving spectral interferences, eliminating isobaric interferences to such an extent that correction was deemed unnecessary. Nevertheless, due to the elevated abundances of interfering elements in chondrites, correction for spectral interferences was necessary for FeO2+, Pb2+, YO+, ZrO+, U2+, TmO+, YbO+, LuO+, HfO+, and TaO+, as their interference contribution rates were not insignificant. To determine the formation rates of isobaric interferences used to correct spectral interferences, we used the results from the analysis of a multi-element standard solution before analyzing the samples.
In conclusion, the use of ICP-MS/MS with CRC resulted in a highly efficient removal of spectral interferences, suppressing background and isobaric interferences caused by molecular ions in the analysis of HSE and VCE. Spectral interference correction is necessary for certain elements, but the reduced interference contributions result in more accurate and precise analyses with high reliability.
Evaluation of the potential loss or addition of analytes during CCl4 solvent extraction
The method presented here involves Os isotope analysis using N-TIMS, which requires the isolation of Os from the sample solution by CCl4 solvent extraction. Thus, the potential loss of elements other than Os and the increase in blanks associated with CCl4 solvent extraction must be evaluated. In this study, the concentrations for multiple elements have been determined using ID-MS. As long as isotopic equilibrium is achieved between the spike solution and the sample, element losses during the subsequent CCl4 solvent extraction should not affect the concentration determination in the ID-MS method.
On the other hand, in the ID-IS method, selective loss of the internal standard or the target element during the chemical procedures affects the accuracy of the concentration determination. Fischer-Gödde et al. (2010) developed the abundance determination method for all HSEs using the ID-IS method, in which Os isotope analysis was performed in the same aliquot by the N-TIMS method. Their method involved Os extraction using CCl4 and element separation through cation-exchange columns. They analyzed the residual matrix elements eluted from the cation exchange resin after extraction of the HSE fraction. Their results depicted a recovery rate of 95% or greater for all HSE via the cation exchange column. However, it is worth noting that there has been no direct experimental verification of the potential loss of elements other than Os by CCl4 solvent extraction in previous studies.
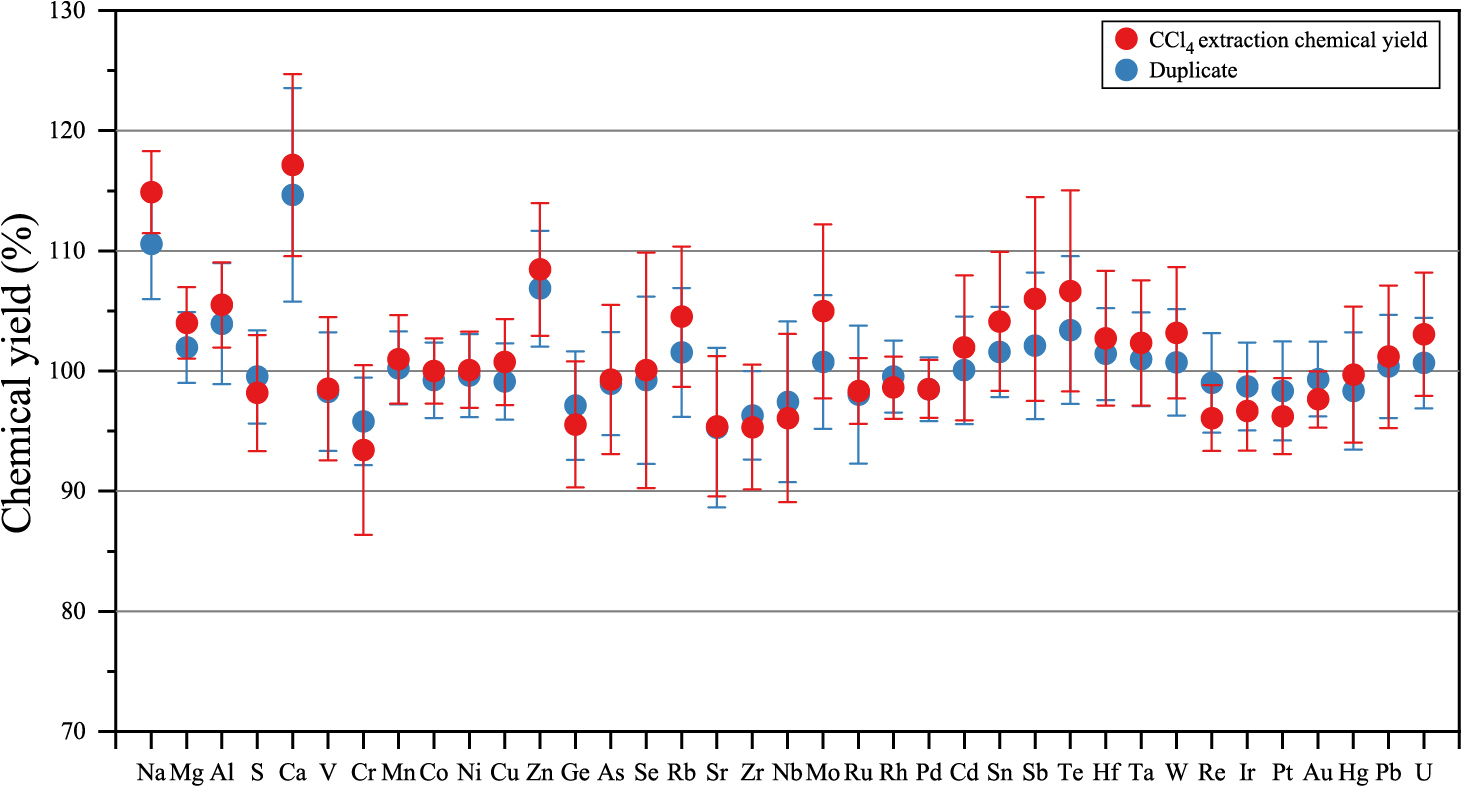
In order to assess potential losses and gains for HSEs, VCEs, and some lithophile elements during the CCl4 solvent extraction procedure, the experiment was repeated twice using multi-element standard solutions. Each iteration involved the addition of 1 ml of CCl4 to 7 ml of the prepared standard solution, followed by shaking for more than 3 minutes. The resulting solution was then analyzed using ICP-MS/MS. This method was used to detect any changes in the concentrations of the above elements during the solvent extraction process. The concentrations of the prepared standard solution are as follows: 450 ppb for Mg, 200 ppb for S, 40 ppb for Ca and Ni, 30 ppb for Al, 20 ppb for Na, 15 ppb for Ge, 10 ppb for Cr and Mn, 5 ppb for V, Co, Cu, Zn, As, Se, Rb, Sr, Zr, Sn, Cd, Te, Hg, Pb, and U, 1 ppb for Ru, Rh, Pd, Re, Ir, Pt, and Au, 0.5 ppb for Nb, Mo, Sb, Hf, Ta, W. The differences in elemental abundances before and after the CCl4 extraction process are graphically depicted in Fig. 2. The data demonstrates that, except for Na, Ca, and Zn, there is minimal change in the abundance of almost all other elements after CCl4 extraction, indicating nearly 100% of the chemical yields for all analytes. The recovery yields of Na, Ca, and Zn after the CCl4 extraction exceeded 100%, with calculated blanks of 14 ng Na, 43 ng Ca, and 3 ng Zn, indicating that this procedure may introduce elevated blanks for these specific elements. However, these blanks are sufficiently small (<0.06% for Na, <0.05% for Ca, <0.2% for Zn) compared to the content in the mg order chondrite meteorite. Consequently, while the CCl4 solvent extraction process may marginally affect blank values for specific elements, it has an insignificant effect on losing elements other than Os. Therefore, using CCl4 solvent extraction is an effective method for quantifying the multi-element abundances using the ID-IS method with Os isotope analysis.
After decomposing the sample powder using a quartz tube and extracting Os with a CCl4 solvent, part of the sample solution is analyzed by ID-IS-ICP-MS/MS. The remaining solution is subjected to element purification using an ion exchange column and BPHA solvent extraction, followed by ID-ICP-MS/MS. Consequently, the initial analysis is affected by procedural blanks originating from the quartz tube, reagents, and CCl4. At the same time, the latter introduces additional blanks derived from the ion exchange resin and BPHA solvent. Here, we evaluate the contribution of each blank source. Table 4 summarizes the procedural blanks in this experiment and in previous studies.
Table 4.
Summary of the procedural blank
|
Blank A |
Blank B |
Blank C |
M&N09 |
N23 |
FG10 |
G15 |
W&B14 |
Z20 |
| Vessel |
QG |
QG |
TV |
TV |
QG |
QG |
TV |
QG |
TV |
| Purged HNO3 |
○ |
○ |
× |
× |
○ |
× |
× |
○ |
× |
| Column separation |
× |
○ |
○ |
× |
○ |
○ |
× |
○ |
○ |
|
Mean |
|
SD |
Mean |
|
SD |
Mean |
|
SD |
Mean |
Mean |
Mean |
Mean |
Mean |
Mean |
| Mg (μg) |
0.05 |
± |
0.01 |
|
|
|
|
|
|
|
|
|
|
|
|
| Al (μg) |
3.5 |
± |
1.2 |
|
|
|
|
|
|
|
|
|
|
|
|
| S (ng) |
76 |
± |
19 |
|
|
|
|
|
|
15 |
|
|
|
4000 |
423 |
| Ca (μg) |
0.74 |
± |
0.13 |
|
|
|
|
|
|
|
|
|
|
|
|
| Ge (ng) |
3.5 |
± |
2.0 |
0.1 |
± |
1.8 |
|
|
|
0.028 |
|
|
0.75 |
|
|
| As (pg) |
44 |
± |
39 |
|
|
|
|
|
|
5 |
|
|
|
|
|
| Se (pg) |
95 |
± |
46 |
12 |
± |
46 |
|
|
|
11 |
|
|
|
1900 |
700 |
| Mo (pg) |
185 |
± |
120 |
|
|
|
|
|
|
41 |
|
|
1950 |
|
|
| Ru (pg) |
0.48 |
± |
0.58 |
0.34 |
± |
0.59 |
2.7 |
± |
1.0 |
|
2.1 |
3 |
|
0.4 |
32 |
| Rh (pg) |
0.13 |
± |
0.13 |
|
|
|
|
|
|
|
|
0.6 |
|
|
|
| Pd (pg) |
0.4 |
± |
0.4 |
2.9 |
± |
2.0 |
15.8 |
± |
2.8 |
|
8.6 |
12 |
|
20 |
35 |
| Sn (pg) |
442 |
± |
69 |
111 |
± |
107 |
|
|
|
150 |
|
|
1800 |
|
|
| Sb (pg) |
73 |
± |
28 |
29 |
± |
37 |
|
|
|
n.d. |
|
|
150 |
|
|
| Te (pg) |
15 |
± |
7 |
38 |
± |
10 |
|
|
|
2 |
|
|
|
19 |
8.6 |
| Re (pg) |
0.94 |
± |
0.89 |
0.09 |
± |
0.73 |
|
|
|
|
0.3 |
22 |
|
4.2 |
3.3 |
| Os (pg) |
0.030 |
± |
0.003 |
|
|
|
|
|
|
|
0.07 |
9 |
|
1 |
|
| Ir (pg) |
0.19 |
± |
0.24 |
0.75 |
± |
0.51 |
<0.3 |
|
|
|
0.49 |
0.5 |
|
0.7 |
2.0 |
| Pt (pg) |
1.5 |
± |
2.2 |
15.0 |
± |
9.2 |
15.7 |
± |
5.5 |
|
41 |
13 |
|
26 |
7.8 |
| Au (pg) |
3.4 |
± |
3.2 |
|
|
|
|
|
|
|
|
7 |
|
|
|
Blank A in Table 4 was estimated based on the analysis of blank solution through quartz tube digestion and CCl4 solvent extraction and represents the results of the procedural blanks along with their standard deviation (SD). For Os, a blank derived from the subsequent micro-distillation and filament loading is included. As discussed in the previous section, the primary source of these blanks would be quartz tubes and reagents since there is no significant addition of blanks associated with CCl4 extraction, except for Na, Ca, and Zn.
While most element values align with those reported in previous studies, the blank value for Ge is higher than those reported (Table 4). The elevated Ge blank can be attributed to the potential loss of the Ge spike, possibly due to the volatilization of GeCl4 during solution drying in sample preparation. Such loss during sample preparation may lead to overestimating of Ge blanks in subsequent procedures. An alternative explanation for the increased Ge blanks may be using quartz tubes in this study instead of the Teflon vials used in previous studies. It is conceivable that the elevated Ge blanks imply Ge contamination originating from quartz glass tubes, where Ge dissolves into the content solution during aqua regia digestion.
During our experiments, we obtained relatively constant Os procedural blanks as low as 0.030 ± 0.003 pg, much lower than the values recently reported from our laboratory (0.07 ± 0.01 pg; Netshidzivhe et al., 2023). Both experiments used almost identical analytical protocols for Os isotope analysis, except for the nitric acid cleaning procedure and the inclusion of additional spikes. In this study, we attempted to reduce the Os blank in nitric acid by adding H2O2, as demonstrated by Yang et al. (2015). These results confirm the substantial contribution of nitric acid as a prominent source of Os blanks, suggesting a negligible effect of adding other spike solutions.
The HSE blank amounts as Blank A exhibit variability with an RSD greater than 50%, mainly due to the low signal-to-noise ratio. In addition, high intensities of Zr and Hf, probably introduced from the quartz tubes during the sample digestion, were observed in the analysis of blank solutions. These elements interfered with the isotopic analysis of Pd, Ir, and Pt by forming isobaric polyatomic ions such as ZrO+ and HfO+. Consequently, the interference from Zr and Hf ions can lead to poor reproducibility of the results from Pd, Ir, and Pt blank measurements.
The HSE blank A values are either comparable to or lower than those reported in previous studies (Table 4), particularly for Ru, Pd, and Pt, where they were found to be lower than any other reported values. In addition, it is worth noting that the blank values for these elements obtained in this experiment are even lower than any other reported values, including those from our research group. Specifically, the variance is due to whether elemental purification was performed using an ion exchange column and BPHA or whether these steps were omitted during the analysis. Hence, it is highly plausible that the elemental purification process contributes significantly to the blank values for Ru, Pd, and Pt. However, it should be noted that its effect is less pronounced when the elemental concentrations in the sample are sufficiently high. The later section will discuss the blank contribution to the analysis of the Smithsonian Allende in this study.
Purification procedure
The purification procedure is another blank source for elements analyzed by ID-MS. We define the blanks added due to the chemical purification as “Blank B”. When the chemical yield and the fraction of the blank solution used for additional purification procedures (6 ml out of 10 ml in this study) are expressed as Y and P, respectively, the amount of blank present in the solution after the chemical separation is written in the form of (P·Y·Blank A + Blank B). Similarly, the amount of spike in the solution after chemical separation is reduced from wspk·Cspk to P·Y·wspk·Cspk. Then, the equation for the ID method expresses the amount of blank in the solution after chemical separation as follows;
|
P·Y·Blank A+Blank B=Rspk-RmixRmix-Rblank·pl·Mblankal·Mspk·P·Y·wspk·Cspk,
| (2) |
where Rspk, Rblank, and Rmix are the isotope ratios of an analyte element in the spike solution, the blank solution, and the mixed solution of the blank and spike. al and pl are the abundances of isotopes of an analyte element in the natural sample and spike solution. The “blank” and “spk” mean the blank and spike, M is the atomic weight, w is the weight of the sample or spike, and C is the concentration of an analyte element in the sample or spike, respectively. Here, we define the apparent blank (Blankap), which is a calculated blank without considering the chemical yield nor the aliquoted fraction;
| Blankap=Rspk-RmixRmix-Rsmp·pl·Msmpal·Mspk·wspk·Cspk. | (3) |
Combining Eq. (2), we can obtain the following equation by rearranging Eq. (1).
| Blank B=P·Y·(Blankap-Blank A) | (4) |
The Blank B in Table 4 is the value when the fraction of the blank measurement is 60% (P = 0.6) and the chemical yield is assumed to be 100% (Y = 1), which is the maximum estimate of the blank. By comparing the intensity of the analytical results for Smithsonian Allende solutions before and after elemental purification, we roughly estimate the chemical yields to be 10–30% for PGE, 40% for Sn, and over 90% for the other VCE and Re. In addition, we investigated the chemical yields of elemental purification process using the anion exchange column with a mixed standard solution. The results are in close agreement with the estimated chemical yields for the Smithsonian Allende solutions. Pearson and Woodland (2000) also reported similarly low chemical yields for PGEs using the anion exchange column. Despite these low yields, chemical yields have not been considered because they are generally sufficient for accurate measurements. This is because the ID method is relatively insensitive to yield and remains effective as long as there is sufficient signal intensity to achieve reliable counting statistics.
Blank B exceeds the value of Blank A more than four times for Pd, Ir, and Pt (Table 4), signifying that the elemental purification process leads to notably elevated PGE blanks. Previous studies have pointed to the primary source of these blanks as an anion exchange resin, with minimal impact from BPHA solvents or cation exchange resins (e.g., Pearson and Woodland, 2000; Ishikawa et al., 2014). Thus, we conducted additional experiments to evaluate the PGE blanks (Blank C in Table 4) from an anion exchange resin, where mixed spike solutions passed through the anion exchange column process were measured. The results showed 2.7 pg for Ru, 15.8 pg for Pd, <0.3 pg for Ir, and 15.7 pg for Pt, indicating that trace amounts of PGE persist in the resin and contaminate the PGE fraction even after pre-cleaning the ion exchange resin. Consequently, improving the cleaning method for anion exchange resins will be essential for robust abundance analysis of sub-mg chondritic samples.
Blank correction
The analytical results of aliquots not subjected to the purification procedure were corrected using Blank A values (Table 5). In contrast, the elements that need these processes are essential to correct the analytical results included in these blanks due to the elevated procedural blank after elemental purification processes. Note that a fraction of the pre-purified sample solution (0.5 ml out of 9 ml) was used for the ID-IS-ICP-MS analysis. We define the blank-uncorrected concentration as Cuncorrected, which is a calculated concentration without taking into account the chemical yield, aliquoted fraction, or blanks;
| Cuncorrected=Rspk-RmixRmix-Rsmp·pl·Msmpal·Mspk·wspkwsmp·Cspk. | (5) |
Table 5.
The abundance of Mg, Al, Ca, S, Ge, As, Se, Mo, Ru, Rh, Pd, Sn, Sb, Te, Re, Ir, Pt, and Au in the Smithsonian Allende using pre-purification solutions
| Sample weight (mg) |
run1 |
err |
run2 |
err |
run3 |
err |
run4 |
err |
run5 |
err |
run6 |
err |
run7 |
err |
run8 |
err |
run9 |
err |
run10 |
err |
Mean* |
RSD |
| 9.91 |
9.86 |
11.15 |
13.19 |
18.81 |
4.76 |
6.10 |
4.92 |
4.24 |
7.07 |
| (wt.%) |
|
|
|
|
|
|
|
|
|
|
|
|
|
|
|
|
|
|
|
|
|
|
| Mg |
15.4 |
0.1 |
15.2 |
0.2 |
15.0 |
0.1 |
16.3 |
0.2 |
15.5 |
0.2 |
14.3 |
0.1 |
13.9 |
0.2 |
15.6 |
0.1 |
15.0 |
0.2 |
14.1 |
0.1 |
15.2 |
4% |
| Al |
1.77 |
0.02 |
1.67 |
0.02 |
1.66 |
0.02 |
1.79 |
0.02 |
1.73 |
0.02 |
1.58 |
0.03 |
1.62 |
0.02 |
1.77 |
0.03 |
1.63 |
0.04 |
1.62 |
0.03 |
1.70 |
4% |
| Ca |
2.00 |
0.01 |
1.97 |
0.02 |
1.93 |
0.01 |
2.10 |
0.04 |
2.01 |
0.03 |
1.95 |
0.02 |
1.74 |
0.01 |
2.02 |
0.02 |
1.89 |
0.02 |
1.87 |
0.03 |
1.94 |
7% |
| S |
2.20 |
0.01 |
1.94 |
0.03 |
1.92 |
0.02 |
1.98 |
0.03 |
2.01 |
0.02 |
1.72 |
0.02 |
1.74 |
0.02 |
1.85 |
0.02 |
1.77 |
0.02 |
1.77 |
0.02 |
1.97 |
5% |
| (ppm) |
|
|
|
|
|
|
|
|
|
|
|
|
|
|
|
|
|
|
|
|
|
|
| Ge |
15.8 |
1.2 |
15.2 |
0.9 |
14.5 |
1.7 |
15.3 |
0.6 |
15.7 |
0.8 |
13.1 |
0.5 |
13.6 |
1.3 |
14.8 |
0.8 |
14.2 |
1.7 |
14.1 |
1.0 |
14.9 |
5% |
| As |
1.24 |
0.15 |
1.16 |
0.14 |
1.17 |
0.23 |
1.13 |
0.20 |
1.39 |
0.23 |
1.14 |
0.21 |
1.26 |
0.18 |
1.04 |
0.16 |
1.17 |
0.11 |
1.23 |
0.10 |
1.22 |
8% |
| Se |
8.14 |
1.19 |
7.88 |
0.77 |
7.33 |
1.20 |
7.48 |
0.94 |
8.83 |
1.31 |
7.81 |
1.32 |
8.24 |
1.15 |
7.53 |
1.16 |
7.69 |
0.65 |
7.95 |
0.90 |
7.98 |
6% |
| Mo |
1.64 |
0.04 |
1.62 |
0.07 |
1.52 |
0.10 |
1.40 |
0.10 |
1.18 |
0.12 |
1.26 |
0.07 |
1.32 |
0.06 |
1.60 |
0.06 |
1.78 |
0.08 |
1.54 |
0.06 |
1.45 |
13% |
| (ppb) |
|
|
|
|
|
|
|
|
|
|
|
|
|
|
|
|
|
|
|
|
|
|
| Ru |
955 |
69 |
907 |
45 |
996 |
64 |
973 |
49 |
928 |
46 |
904 |
63 |
824 |
46 |
925 |
41 |
875 |
35 |
894 |
72 |
930 |
5% |
| Rh |
184 |
13 |
183 |
8 |
181 |
10 |
191 |
10 |
181 |
4 |
168 |
4 |
161 |
4 |
185 |
6 |
169 |
7 |
169 |
10 |
180 |
5% |
| Pd |
649 |
46 |
626 |
18 |
637 |
42 |
725 |
83 |
737 |
60 |
610 |
28 |
690 |
36 |
705 |
31 |
694 |
32 |
634 |
41 |
679 |
7% |
| Sn |
552 |
26 |
735 |
50 |
536 |
38 |
548 |
32 |
567 |
21 |
557 |
33 |
484 |
27 |
522 |
41 |
454 |
31 |
465 |
43 |
555 |
13% |
| Sb |
87.7 |
56.5 |
75.7 |
22.1 |
72.1 |
15.2 |
69.3 |
26.5 |
80.6 |
16.0 |
91.4 |
32.7 |
62.0 |
26.5 |
67.0 |
23.6 |
114 |
59 |
58.2 |
13.0 |
76.5 |
16% |
| Te |
881 |
150 |
918 |
133 |
888 |
133 |
1229 |
484 |
1053 |
222 |
1006 |
255 |
1173 |
234 |
808 |
97 |
917 |
96 |
866 |
109 |
996 |
13% |
| Re |
58.7 |
6.5 |
56.2 |
7.1 |
65.0 |
11.9 |
63.3 |
11.9 |
50.9 |
9.4 |
62.8 |
7.3 |
73.5 |
6.2 |
56.0 |
4.0 |
61.2 |
6.1 |
62.6 |
5.5 |
59.8 |
10% |
| Ir |
736 |
10 |
656 |
22 |
703 |
16 |
743 |
16 |
666 |
26 |
657 |
25 |
635 |
15 |
651 |
22 |
783 |
18 |
616 |
13 |
687 |
7% |
| Pt |
1505 |
49 |
1433 |
51 |
1468 |
83 |
1367 |
35 |
1394 |
52 |
1239 |
54 |
1317 |
45 |
1398 |
37 |
1591 |
36 |
1235 |
44 |
1399 |
6% |
| Au |
121 |
6 |
131 |
7 |
130 |
10 |
131 |
6 |
138 |
10 |
113 |
5 |
139 |
9 |
147 |
8 |
126 |
12 |
121 |
7 |
131 |
6% |
err represents the uncertainty estimated by error propagation of 2 standard errors in the ICP-MS measurement and 1 standard deviation in the replicate blank measurement. Mean* and RSD represent the weighted mean and relative standard deviation of ten replicated analysis, respectively.
The equation for the ID method expresses the true concentration in the sample solution after chemical separation as follows;
|
P'·Y·(Ccorrected·wsmp+Blank A)+Blank B=Rspk-RmixRmix-Rsmp·pl·Msmpal·Mspk·P'·Y·wspk·Cspk,
| (6) |
where P' is the fraction of the sample solution used for the additional purification procedure (8.5 ml of 9 ml in this study). Then, assuming that the chemical yields between the blank and the sample solution are constant, we can obtain the following equation by combing Eq. (4), (5), and (6).
|
Ccorrected=Cuncorrected-1wsmp1-PP'·Blank A+PP'·Blankap,
| (7) |
where Ccorrected and Cuncorrected represent the elemental concentration with and without blank correction, respectively. Equation (7) means that the blank corrected results are independent of the chemical yields. While we recognize that chemical yields may vary depending on the solution matrix, practical considerations led us to adopt this equation for simplicity since it is unrealistic to determine chemical yields for each sample.
Elemental abundances and Os isotopes in the Smithsonian Allende
Tables 5 and 6 display the results of elemental abundances in the Smithsonian Allende for both cases with and without purification processes. All data have been corrected for blanks using the method described above, with uncertainties accounted for in each analysis and blank correction.
Table 6.
The abundance of Ge, Se, Ru, Pd, Sn, Sb, Te, Re, Ir, and Pt in the Smithsonian Allende using post-purification solutions
| Sample weight (mg) |
run1 |
err |
run2 |
err |
run3 |
err |
run4 |
err |
run5 |
err |
run6 |
err |
run7 |
err |
run8 |
err |
run9 |
err |
run10 |
err |
Mean* |
RSD |
| 9.91 |
9.86 |
11.15 |
13.19 |
18.81 |
4.76 |
6.10 |
4.92 |
4.24 |
7.07 |
| (ppm) |
|
|
|
|
|
|
|
|
|
|
|
|
|
|
|
|
|
|
|
|
|
|
| Ge |
14.2 |
0.2 |
14.0 |
0.4 |
13.7 |
0.3 |
14.8 |
0.3 |
14.3 |
0.1 |
12.4 |
0.4 |
12.8 |
0.3 |
14.5 |
0.5 |
12.9 |
0.6 |
13.3 |
0.3 |
13.9 |
5% |
| Se |
8.04 |
0.31 |
7.83 |
0.17 |
7.89 |
0.50 |
8.36 |
0.36 |
7.63 |
0.23 |
7.56 |
0.12 |
7.50 |
0.38 |
8.07 |
0.31 |
7.66 |
0.23 |
7.71 |
0.23 |
7.86 |
3% |
| (ppb) |
|
|
|
|
|
|
|
|
|
|
|
|
|
|
|
|
|
|
|
|
|
|
| Ru |
1035 |
25 |
948 |
17 |
992 |
42 |
1022 |
33 |
986 |
25 |
914 |
27 |
895 |
16 |
960 |
21 |
914 |
18 |
934 |
18 |
974 |
4% |
| Pd |
661 |
14 |
675 |
11 |
625 |
28 |
674 |
11 |
679 |
19 |
605 |
14 |
667 |
17 |
637 |
14 |
690 |
17 |
610 |
14 |
657 |
4% |
| Sn |
559 |
18 |
762 |
17 |
545 |
18 |
552 |
20 |
583 |
17 |
494 |
25 |
499 |
22 |
531 |
30 |
515 |
30 |
473 |
17 |
566 |
13% |
| Sb |
69.7 |
7.7 |
70.3 |
8.2 |
62.0 |
9.6 |
85.6 |
13.5 |
70.0 |
12.2 |
48.9 |
16.9 |
57.9 |
13.8 |
59.3 |
15.0 |
48.1 |
18.1 |
57.7 |
16.6 |
66.8 |
16% |
| Te |
898 |
53 |
826 |
55 |
844 |
29 |
940 |
96 |
934 |
32 |
789 |
81 |
814 |
43 |
892 |
52 |
859 |
37 |
842 |
58 |
879 |
6% |
| Re |
60.0 |
1.8 |
56.6 |
1.2 |
61.3 |
1.9 |
62.3 |
1.6 |
56.4 |
1.5 |
54.4 |
1.2 |
62.6 |
1.2 |
54.3 |
1.2 |
59.6 |
1.3 |
56.1 |
1.6 |
58.6 |
5% |
| Ir |
724 |
21 |
662 |
15 |
724 |
39 |
695 |
13 |
681 |
16 |
654 |
20 |
613 |
17 |
654 |
13 |
804 |
18 |
618 |
9 |
684 |
6% |
| Pt |
1487 |
32 |
1456 |
30 |
1431 |
48 |
1440 |
20 |
1400 |
30 |
1261 |
16 |
1323 |
22 |
1422 |
26 |
1626 |
57 |
1282 |
28 |
1415 |
6% |
err represents the uncertainty estimated by error propagation of 2 standard errors in the ICP-MS measurement and 1 standard deviation in the replicate blank measurement. Mean* and RSD represent the weighted mean and relative standard deviation of ten replicated analysis, respectively.
Advantages of non-purification analysis include eliminating the risk of potential losses of the target element during the purification process, which allows for more robust concentration quantification, especially for mono-isotopes where ID-MS is not applicable. In addition, this approach helps to avoid the increase in blanks for elements such as HSEs, Sn, and Sb derived from the purification process. On the other hand, the major disadvantage of non-purification analysis is the need for isobaric interferences caused by matrix elements. If interfering elements have significantly higher concentrations than the target element, the correction rate may become too high, making accurate concentration quantification difficult. In this section, we have assessed the measurement uncertainties associated with the blank correction, followed by an evaluation of the isobaric interference correction, particularly in the case of chondrite samples. This assessment was based on the results of elemental abundances in the Smithsonian Allende for cases with and without purification processes. We then discuss the chemical heterogeneity of the Smithsonian Allende based on elemental abundances and Re-Os isotope systematics.
Blank contribution and its effect on the measurement uncertainties
In the analysis of the Smithsonian Allende without any elemental purification, all elements except Sn and Sb presented a blank contribution rate below 10% (Table S1). Notably, the blank contribution rates for Mg, S. Ru, Rh, Pd, Os, Ir, Pt, and Au were negligible, below 0.1%. Conversely, for Sn and Sb, the blank contribution rates reached about 20% for the analysis of 4 mg of the Smithsonian Allende. The analysis with the purification procedure also resulted in a blank contribution of less than 10% for all elements except for Sn and Sb (Table S2). Indeed, for elements such as Ru, Pd, Ir, and Pt, where an increase in blank was observed during the element purification process, the blank contribution rates increased compared to cases without element purification. However, despite the increase in blanks, the blank contribution rates for Pd and Pt were less than 1%, and those for Ru and Ir were less than 0.1%. In contrast, the purification procedure significantly increased the blank contribution rates for Sn and Sb, reaching up to 26% for Sn and 51% for Sb.
Increasing blank values and their standard deviations leads to higher measurement uncertainties. The blank analysis of this experiment showed an increase in HSE, Sn, and Sb blanks. However, for all elements, the standard deviation of the repeated blank analytical results remained sufficiently small compared to the uncertainty of the repeatability of the measurements, whether or not elemental purification was performed. As a result, the effect of blank corrections on the measurement uncertainty is limited for all analyses.
Evaluation of the isobaric interference correction
The elemental purification process effectively removes matrix elements and prevents isobaric interferences on the analyte elements, thereby reducing the increase in analytical uncertainty. When samples were analyzed after elemental purification, the interferences per analyte ratio, including 89YO+/105Pd+ ratio (~0.0001%), (92ZrO+ + 108Cd+)/108Pd+ ratio (~0.2%), 238U2+/119Sn+ ratio (~0.02%), 177HfO+/193Ir+ ratio (~0.001%), 179HfO+/195Pt+ ratio (~0.0003%) and (180HfO+ + 196Hg+)/196Pt+ratio (~0.0005%), all of which were negligible. Consequently, the effect of isobaric interferences on the analysis within the context of elemental purification is negligible.
In contrast, non-purification analyses can introduce multiple isobaric interferences requiring corrections. Therefore, we have implemented ICP-MS/MS techniques to suppress the formation of isobaric interferences. Using the He-KED mode in the analysis effectively suppresses the formation of oxide ions, a significant source of isobaric interferences, significantly reducing interference contributions for the primary isobaric interferences (as shown in Table 3). While the formation rate of doubly charged ions remains consistent with the non-gas mode, the interference contribution rates for 206Pb2+/103Rh+ and 238U2+/119Sn+ are also sufficiently low to allow for correction, thanks to the low Pb/Rh and U/Sn ratios observed in chondrite samples. For elements analyzed in the O2 mode, most isobaric interferences are negligible. An exception is iron dioxide (FeO2), which contributes significantly to GeO due to the high Fe/Ge ratio in the sample.
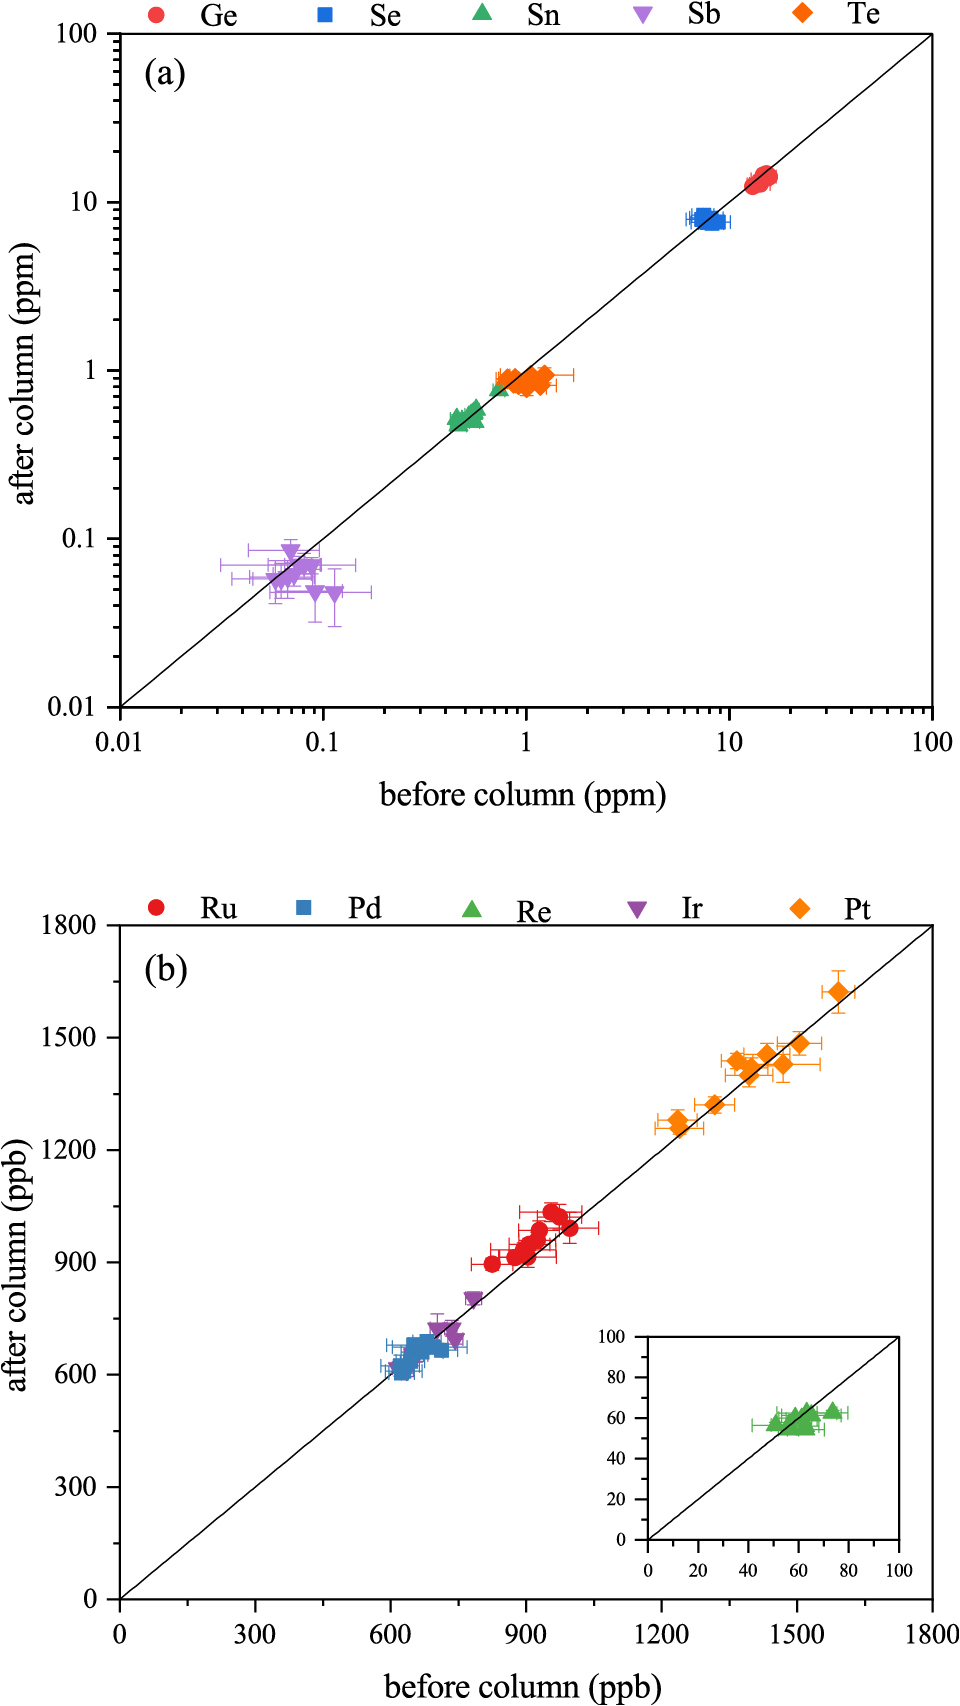
As illustrated in Fig. 3, a comparison of VCE and HSE concentrations in each aliquot between pre- and post-purification denotes that most aliquots and analytes exhibit consistent analytical values after applying the purification procedure. This consistency points to the successful correction of isobaric interferences. Therefore, it is possible to analyze the abundance of these elements in chondrite samples without elemental purification, provided appropriate isobaric interference corrections are applied.
Sample heterogeneity
Table 7 shows the Os abundance, 187Os/188Os ratio, and 187Re/188Os ratio of the Smithsonian Allende as determined in this study. The results of this experiment are in agreement with values from previous studies (Becker et al., 2006; Brandon et al., 2005; Fischer-Gödde et al., 2010; Walker et al., 2002), but the variability of these results could strongly reflect sample heterogeneity due to the small volume of sample analyzed.
Table 7.
Analytical results for Os abundance, 187Os/188Os, and 187Re/188Os ratios in the Smithsonian Allende
|
Sample weight (mg) |
Os (ppb) |
error |
187Os/188Os |
error |
187Re/188Os |
error |
| Run1 |
9.91 |
725.1 |
0.2 |
0.12583 |
0.00003 |
0.390 |
0.012 |
| Run2 |
9.86 |
666.2 |
0.1 |
0.12608 |
0.00002 |
0.401 |
0.008 |
| Run3 |
11.15 |
757.4 |
0.2 |
0.12623 |
0.00002 |
0.382 |
0.012 |
| Run4 |
13.19 |
747.3 |
0.2 |
0.12580 |
0.00002 |
0.393 |
0.010 |
| Run5 |
18.81 |
684.5 |
0.1 |
0.12626 |
0.00001 |
0.389 |
0.010 |
| Run6 |
4.76 |
651.7 |
1.3 |
0.12646 |
0.00017 |
0.394 |
0.009 |
| Run7 |
6.10 |
712.3 |
0.5 |
0.12707 |
0.00009 |
0.414 |
0.008 |
| Run8 |
4.92 |
658.2 |
0.3 |
0.12563 |
0.00007 |
0.388 |
0.008 |
| Run9 |
4.24 |
736.9 |
0.6 |
0.12467 |
0.00011 |
0.381 |
0.008 |
| Run10 |
7.07 |
645.7 |
0.2 |
0.12682 |
0.00003 |
0.410 |
0.012 |
| Sum |
90.01 |
|
|
|
|
|
|
| weighted mean |
|
703.3 |
|
0.12611 |
|
0.393 |
|
| RSD (%) |
|
5.5% |
|
0.40% |
|
7.3% |
|
Error represents the propagation of uncertainties for ICP-MS and N-TIMS measurements and blank correction.
A compilation of the Os abundances of the Smithsonian Allende and the corresponding sample sizes used in the analysis highlights that the sample heterogeneity in Os abundance becomes more pronounced when the sample volume is less than 100 mg (Fig. 4a). Specifically, the sample size employed in this study is less than 20 mg, smaller than that used in previous studies. This correlation between the analyzed sample size and the Os abundance heterogeneity indicates that the relatively poor reproducibility (RSD: 5.5%) of the Os abundance of the Smithsonian Allende in this study can be ascribed to sample heterogeneity. The weighted mean of Os abundance represents the averaged Os abundance in the total volume of the Smithsonian Allende used in the analysis. The total volume of the Smithsonian Allende used in this study is 90 mg. The weighted mean of the Os abundance of the Smithsonian Allende in this study is slightly lower (around 20–50 ppb) compared to previous studies (Becker et al., 2006; Brandon et al., 2005; Fischer-Gödde et al., 2010; Walker et al., 2002), but it falls within the range of variation observed in analyses of ~100 mg of the Smithsonian Allende. Therefore, sample heterogeneity can also explain the lower weighted mean of the Os abundance in this study.

Sample heterogeneity also creates variability in the 187Os/188Os and 187Re/188Os ratios. The 187Os/188Os and 187Re/188Os ratios in the present study show a relatively large range of 0.12467 to 0.12707 and 0.381 to 0.414, respectively, compared to previous studies (Becker et al., 2006; Brandon et al., 2005; Fischer-Gödde et al., 2010; Walker et al., 2002). Like the Os abundance, the 187Os/188Os ratio becomes more variable as the sample volume used for analysis decreases (Fig. 4b).
The Re-Os isochron diagram gives valuable insights, displaying that almost all analytical data for the Smithsonian Allende in this study are within the analytical uncertainty of the IIIA isochrons (Fig. 5). The IIIA iron is a group of iron meteorites that have been dated with low uncertainty using the Re-Os system, indicating that their crystallization and subsequent closed-system behavior could be within 150 Ma of the solar system’s origin (Smoliar et al., 1996). This consistency between the IIIA isochrons and the analytical data for the Smithsonian Allende indicates that the Re/Os variation was preserved in the early solar system. It is not uncommon to observe non-isochronous behavior in some aliquots of the Smithsonian Allende (Fischer-Gödde et al., 2010). This non-isochronous behavior could be caused by late-stage open system perturbations of the Re/Os system in the Allende meteorite (Walker et al., 2002).

The heterogeneous distribution of some accessory minerals, such as sulfides and alloys, and the affinity of sulfide/alloys for HSEs affect the intermediate precision of analytical results regarding HSE abundances. This phenomenon is known as the nugget effect (Meisel et al., 2001; Palme and Wlotzka, 1976; Schwander et al., 2015). Due to the varying proportions of refractory inclusions and metals in carbonaceous chondrites, reducing the sample volume leads to poor intermediate precision of the analytical result regarding HSE abundances (Walker et al., 2002).
Table 8 shows the comparison of the chemical composition of the Smithsonian Allende with literature values. For elements subjected to concentration analysis using the ID-MS, this study presents data from post-element purification aliquots (Table 6) because of lower uncertainty of each analysis. For most elements, the intermediate precision was below 10%. However, for certain elements such as Mo, Sb, and Sn, the intermediate precision exceeded 10%, which can be attributed to the high blank contribution of Sn and Sb (Sn ranging from 5% to 26%, Sb ranging from 8% to 51%), which likely negatively affected the intermediate precision. On the other hand, the heterogeneous distribution of Mo-bearing phases in the Smithsonian Allende has been proposed by previous studies (Makishima and Nakamura, 1999; Makishima and Nakamura, 2009). Particularly in this study, tiny amounts of powder (as low as 4 mg) could accentuate the sample heterogeneity. Therefore, the reproducibility within the range of 3% to 16% observed not only for Mo but also for other elements may be indicative of the inherent heterogeneity of the sample.
Table 8.
Comparison of the chemical composition of the Smithsonian Allende (USNM 3529) with literature values
|
|
This study |
(1) |
(2) |
(3) |
(4) |
(5) |
(6) |
(7) |
(8) |
| Mean* |
RSD |
| (wt.%) |
|
|
|
|
|
|
|
|
|
|
|
| Mg |
a |
15.2 |
4.5% |
14.8 |
15.0 |
16.1 |
|
|
|
|
|
| Al |
a |
1.70 |
4.0% |
1.73 |
1.67 |
1.82 |
|
|
|
|
|
| S |
a |
1.97 |
4.5% |
2.10 |
2.08 |
|
2.07 |
2.05 |
|
|
|
| Ca |
a |
1.94 |
7.0% |
1.84 |
1.78 |
2.02 |
|
|
|
|
|
| (ppm) |
|
|
|
|
|
|
|
|
|
|
|
| Ge |
b |
13.9 |
5.0% |
|
|
|
14.9 |
|
|
|
|
| As |
a |
1.22 |
8.3% |
|
1.57 |
|
1.40 |
|
|
|
|
| Se |
b |
7.86 |
3.4% |
|
|
|
7.94 |
8.69 |
|
|
|
| (ppb) |
|
|
|
|
|
|
|
|
|
|
|
| Mo |
a |
1446 |
13% |
|
|
|
1717 |
|
1420 |
|
|
| Ru |
b |
974 |
4.4% |
|
|
|
|
|
|
1007 |
1016 |
| Rh |
a |
180 |
4.6% |
|
203 |
|
|
|
|
174 |
|
| Pd |
b |
657 |
4.1% |
|
|
|
|
|
|
674 |
674 |
| Sn |
b |
566 |
13% |
|
670 |
|
639 |
|
|
|
|
| Sb |
b |
66.8 |
16% |
|
|
|
78.5 |
|
74.3 |
|
|
| Te |
b |
879 |
5.7% |
|
1040 |
|
859 |
1015 |
|
|
|
| Re |
b |
58.6 |
4.9% |
|
53.1 |
|
|
|
|
60.5 |
60.9 |
| Os |
a |
703 |
5.5% |
|
|
|
|
|
|
730 |
758 |
| Ir |
b |
684 |
6.4% |
739 |
674 |
|
|
|
|
684 |
712 |
| Pt |
b |
1415 |
5.6% |
|
1385 |
|
|
|
|
1357 |
1348 |
| Au |
a |
131 |
6.3% |
148 |
|
|
|
|
|
139 |
|
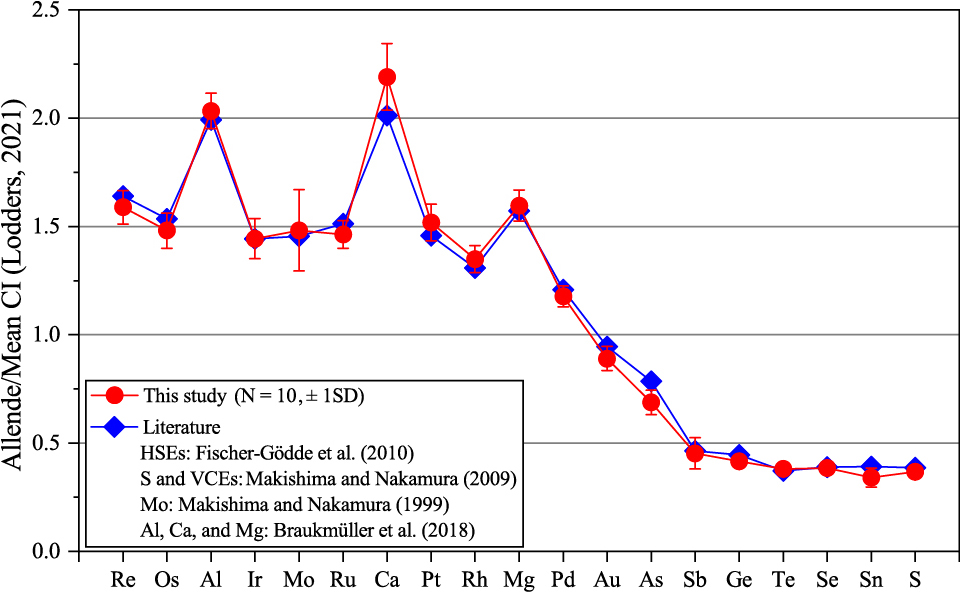
Figure 6 illustrates the depletion pattern of HSEs, VCEs, and some lithophile elements in the Smithsonian Allende normalized to CI chondrite values (Lodders, 2021). Chemical composition values for the Smithsonian Allende were obtained from various sources in the literature in Fig. 6. Specifically, the HSE values were taken from Fischer-Gödde et al. (2010), while the Mg, Al, and Ca values were taken from Braukmüller et al. (2018). In addition, the values for VCE and Mo were taken from Makishima and Nakamura (2009) and Makishima and Nakamura (1999), respectively. The data obtained from this study are within one standard deviation of the literature values (Braukmüller et al., 2018; Fischer-Gödde et al., 2010; Makishima and Nakamura, 1999; Makishima and Nakamura, 2009). The order of these elements is arranged with the decrease in the 50% condensation temperatures (Lodders, 2003). The elemental pattern of the Smithsonian Allende obtained in this study exhibits the volatile element depletion and some lithophile element (Ca and Al) enrichment features compared to CI chondrites, indicating the relatively high abundance of refractory inclusions such as the CAI (Ca, Al-rich inclusions).
Previous research (Fischer-Gödde et al., 2010; Walker et al., 2002) has focused on reducing the nugget effect and determining the representative composition of chondrites by increasing the sample powder. However, our present study employs a unique approach, targeting several milligram quantities of samples, which has not been attempted before. This method allows for both the determination of a representative composition and a direct assessment of the impacts of the nugget effect on chemical composition heterogeneity. In addition, our method enables the analysis of not only HSE abundances and Os isotope composition but also the concentrations of VCE and some lithophile elements in the same sample. Consequently, this method offers a more systematic discussion of chemical composition heterogeneity in chondrites, potentially providing new insights into their origins and genesis.