Abstract
Mangrove creeks have large carbonate chemistry parameters (partial pressure of carbon dioxide (pCO2), dissolved inorganic carbon (DIC), and total alkalinity (TA)) owing to the porewater export by tidal pumping. In this study, the relationship between tidal oscillations and carbonate chemistry parameters was clarified, and CO2 emissions from mangrove creeks and swamps were evaluated in a mangrove forest in Japan, where the duration of swamp inundation was longer during neap tides owing tidal asymmetry. The pCO2 values in the mangrove creek ranged between 307 and 6036 μatm, with maximum values recorded at 4583 μatm during the spring tide (symmetric tide) and 6036 μatm during the neap tide (asymmetric tide). Spatiotemporal water sampling over a spring-neap tidal cycle revealed that the increase in the mangrove-derived DIC and TA varied between the inundated and exposed periods of the swamps, with DIC being produced more than TA during the inundated period. This suggests that the increase in the DIC/TA ratio as the duration of the swamp inundation increases controls the CO2 variations over a spring-neap tidal cycle in this region. Although high pCO2 values were recorded in the mangrove creeks, water-air CO2 emissions (integrating flux by inundated area) were limited to approximately 3.3% of the fate of the sequestered carbon, suggesting that approximately 94.6% of the DIC outwelled to the ocean was stored therein.
Introduction
Blue carbon ecosystems, including mangroves, salt marshes, and seagrass meadows, act as carbon sinks and play essential roles in the biogeochemical cycles of coastal environments (Duarte et al., 2005; Howard et al., 2017). Mangrove ecosystems are the most effective areas of buried organic carbon in blue carbon ecosystems (Nellemann et al., 2009). Although mangrove habitats are limited to subtropical and tropical areas, they account for approximately 15% (26.1 Tg C y–1) of the annually buried carbon in the ocean (Breithaupt et al., 2012; Jennerjahn and Ittekkot, 2002); furthermore, mangrove soils are the most effective areas of buried organic carbon (2.6–10.4 Pg C globally) (Atwood et al., 2017; Donato et al., 2011; Duarte et al., 2013; Jardine and Siikamäki, 2014). Similarly, mangrove soils also contain abundant dissolved inorganic carbon (DIC) (Maher et al., 2013) with a high partial pressure of carbon dioxide (pCO2) (Call et al., 2015; Call et al., 2019) produced via the decomposition of organic matter. DIC is outwelled from mangrove soils into creeks through advective porewater exchange via tidal pumping. Mangrove creeks are a net source of CO2 emissions (Borges et al., 2003; Maher et al., 2013; Chielle et al., 2024), which are markedly higher compared to that of other blue carbon ecosystems (Akhand et al., 2016; Akhand et al., 2021a; Santos et al., 2019).
Organic matter deposited in mangrove soils is generally decomposed by sulfate reduction and aerobic respiration, although certain sites have demonstrated a higher contribution of denitrification and iron reduction(Alongi et al., 2005; Kristensen, 2007; Kristensen et al., 2008). In particular, sulfate reduction is the most important decomposition process, accounting for 70–90% of the decomposition of organic matter in soil (Alongi et al., 2005; Kristensen, 2007). Each mineralization process contributes to a different DIC to the total alkalinity (TA) ratio (Krumins et al., 2013). Based on this theoretical stoichiometric relationship, the main mineralization pathways in mangrove creeks were discussed using the slope of the mangrove-derived DIC (ΔDICM) and TA (ΔTAM), or salinity normalized DIC (nDIC) and TA (nTA) (Akhand et al., 2021b; Alongi, 2022; Borges et al., 2003; Bouillon et al., 2007a; Ho et al., 2017; Santos et al., 2019; Sippo et al., 2016; Volta et al., 2020; Chielle et al., 2024). However, because secondary redox reactions with oxygen in the water were not considered, whether these DIC-to-TA ratios represent the mineralization processes that contribute to the decomposition of organic matter in soils remains questionable (Krumins et al., 2013) (Table S1). For example, regarding sulfate reduction, DIC and TA increase at a 1:1 ratio in an anaerobic soil environment; when exported to creeks, the TA is removed because sulfate oxidation causes hydrogen sulfide (HS–) to convert into sulfate (SO4–) again. Hence, the changes in DIC and TA owing to sulfate reduction and oxidation should be biased toward DIC (Krumins et al., 2013; Reithmaier et al., 2021a) (Table S1). Although estimating the original mineralization process using the stoichiometric relationship of DIC and TA is difficult, the slope of ΔDICM and ΔTAM may represent the characteristics of the local mangrove environment because the mangrove-derived DIC and TA have different slopes in each mangrove ecosystem (Akhand et al., 2021b; Alongi, 2022; Borges et al., 2003; Bouillon et al., 2007a; Ho et al., 2017; Santos et al., 2019; Sippo et al., 2016; Volta et al., 2020; Chielle et al., 2024). However, whether the slopes of ΔDICM and ΔTAM represent regional characteristics is unknown, including differences in the climate and topography, or differences in the water sampling environment, such as inundation or the exposure of mangrove swamps.
The dynamics of pCO2 in mangrove creeks appears to be highly dependent on the characteristics of porewater exported from the soil (Call et al., 2015; Call et al., 2019; Taillardat et al., 2018). Call et al. (2015) demonstrated two patterns of pCO2 oscillations in a micro-tidal area in Australia: a semi-diurnal oscillation with a maximum at the low tide, and a semi-monthly oscillation with an increasing maximum from the spring to neap tides. Call et al. (2015) reported that the semi-diurnal oscillation of pCO2 was controlled by the flushing of crab burrows, and that the semi-monthly oscillation of pCO2 was owing to the export of aged porewater associated with a decrease in the hydrostatic head. Taillardad et al. (2018) demonstrated a sharp increase in pCO2 after an asymmetric tide with a small tidal amplitude, which was obtained within a lunar tidal cycle of approximately 28 days in a meso-tidal area in Vietnam. Taillardad et al. (2018) reported that this sharp increase in pCO2 was owing to the decreased porewater export via tidal pumping during the asymmetric tide, and increased porewater export during the subsequent tidal cycle. Call et al. (2019) demonstrated a sharp increase in pCO2 on the first day of the spring tide during the spring and neap tidal cycles in a macro-tidal area in Brazil. Call et al. (2019) reported that this was because mangrove swamps are only inundated on days when spring tides occur, allowing the export of aged porewater. These studies indicate the importance of the different mechanisms of porewater export within soils in response to tidal oscillations. However, pCO2 varies with the ratio of DIC to TA, in addition to the increase in DIC associated with the porewater export. For example, in an environment where TA is abundantly produced, the increase in pCO2 should be suppressed despite the increase in DIC owing to the export of porewater (Saderne et al., 2021). Regardless, discussions regarding semi-monthly pCO2 oscillations based on DIC and TA variations remain limited. In addition to the physical interactions between tidal oscillations and mangrove swamps, a better understanding of the variations in DIC and TA that contribute to pCO2 variations will provide further details regarding the complex dynamics of pCO2 in mangrove creeks.
The pCO2 values rapidly increase in mangrove creeks owing to the export of porewater via tidal pumping (Call et al., 2015; Call et al., 2019; Taillardat et al., 2018). However, water-air CO2 emissions appear to be slightly lower than those of the soil-atmosphere (Alongi, 2020; Alongi, 2022), which may be owing to most of the inorganic carbon exported from mangrove soils being transported to the ocean as DIC, and only a limited fraction being degassed into the atmosphere (Bouillon et al., 2008; Maher et al., 2018). The CO2 emissions were estimated by extrapolating the areas of mangrove forests multiplied by the average flux values measured in different mangrove forests (Alongi, 2020; Alongi, 2022). The CO2 flux from water to the atmosphere rapidly increases at low tides (Call et al., 2015; Call et al., 2019; Taillardat et al., 2018), and the area of mangroves inundated at a lower tide is significantly smaller than that inundated at a higher tide. Therefore, an estimation method that multiplies the average CO2 flux by the area of mangroves may overestimate the actual situation. The estimation of actual CO2 emissions from soil and water to the atmosphere in mangrove ecosystems requires calculations based on contemporaneous flux observations while considering the mangrove inundation conditions.
To determine the spatiotemporal variations in carbonate chemistry parameters (pCO2, DIC, and TA) in response to semi-monthly tidal oscillations and CO2 emissions to the atmosphere via the soil and water within a mangrove ecosystem, studying a relatively small mangrove forest where the influence of the terrestrial environment is limited would be ideal. In this context, the Fukido River estuary on the Ishigaki Island in Japan was analyzed, where there is a small amount of freshwater inflow from the land, and material exchange with the open ocean occurs through a single channel (Ohtsuka et al., 2020). In this study, a high-resolution spatiotemporal survey was conducted in the Fukido River estuary to elucidate the variations in carbonate chemistry parameters within the mangrove ecosystem and CO2 emissions to the atmosphere. This study aims to achieve the following three objectives:
(1) Determine the variation of mangrove-derived ΔDICM and ΔTAM during both swamp inundation and exposure periods, and redefine the indications of the slopes of ΔDICM to ΔTAM.
(2) Clarify the pCO2 variation over a spring-neap tidal cycle considering two perspectives: the physical interactions between tidal oscillations and mangrove swamps, and the variation in DIC and TA.
(3) Estimate the proportion of the following three fates of carbon sequestered in soil: burial in soil, CO2 emissions to the atmosphere, and outwelling to the ocean, while considering the variation in the inundated area of a mangrove forest.
We tested these objectives by combining water quality monitoring using a mooring system and spatiotemporal water sampling over three weeks.
Materials and Methods
Study area
This study was conducted in the Fukido River estuary on Ishigaki Island, Okinawa, Japan (Figs. 1 and S1), which is situated at the northern limit of the mangrove habitat in the Indo-Pacific region. The Fukido River estuary is a subtropical environment, where mangroves, tidal flats, seagrass, and coral ecosystems are continuously distributed. During spring tides, the mean tidal range is approximately 1.3 m, which is considered a micro-tidal are.

The study area has a subtropical monsoon climate. According to the Japan Meteorological Agency, the annual average temperature and precipitation from 1991 to 2020 were 24.5°C and 2095.5 mm, respectively. Rainfall is relatively abundant during the rainy season from May to June, and during the typhoon season from August to September (approximately 43% of the annual rainfall). A mangrove forest is dominated by Bruguiera gymnorrhiza and Rhizophora stylosa and is distributed over approximately 20.04 ha (Baloloy et al., 2021). The mangrove forest is considered mature; the maximum tree heights of B.gymnorrhiza and R.stylosa are 13.2 m and 11.6 m, respectively (Ohtsuka et al., 2019).
Sample collection and fieldwork
Field observations were conducted in August and September of 2021, as well as in August of 2022. In 2021, a temporary platform was built in front of the mangrove forest (Site M1) to continuously monitor the environmental variables in the creek (Fig. 1). A pCO2 analyzer and floating water sensors were attached to the platform to collect data regarding the surface water quality. The surface salinity, water temperature, DO, pH (total scale), and water level at Site M1 were measured at 5-min intervals during the study period. The pCO2 at the water surface was monitored each minute for one hour, with the first 50 min of measurement in the water and the remaining 10 min in air (because there was only one pCO2 analyzer) to calculate the water-air CO2 flux.
Water sampling at Site M1 for the DIC and TA analyses was conducted in triplicate at 1.5-hour intervals for 24 h from August 9 to 10 (spring tides), August 17 to 18 (neap tides), and August 23 to 24 (spring tides) in 2021. There was no rainfall on the previous day from August 9 to 10 (spring tides) or from August 17 to 18 (neap tides), whereas 43 mm of rainfall was recorded on August 22 (spring tides) at the Ibaruma Weather Station (AMeDAS, Japan Meteorological Agency), located approximately 10 km from the site. Surface water samples for the DIC, TA, salinity, temperature, DO, and pH measurements were collected from 12 sites (Sites M1–M12 in Fig. 1) in the mangrove creeks and at three sites (Sites T1, S1, and C1 in Fig. 1) adjacent to the mangrove forest during the ebb tide on August 9 and August 17. Additionally, surface water samples were collected at three stations (Sites L1–L3 in Fig. 1) upstream of the three streams in the land forest on August 9 and 17 to measure the DIC, TA, salinity, temperature, DO, and pH as the end members of the freshwater discharge into the mangrove forest.
Soil-air CO2 efflux was measured using the static closed-chamber technique at six sites in the mangrove forest covering the areas dominated by both R.syulosa and B.gymnorhiza (red star and dots in Fig. 1), and approximately half of these were measured at Site Sw. The chamber, which was composed of translucent white acrylic material with a volume of 12.7 L, covered a soil surface area of 0.058 m2. The edge of the chamber was inserted at a depth of 5 mm to minimize disturbances to the soil surface. The CO2 efflux from the soil was measured in the absence of aerial roots, fresh leaves, or litter. Each measurement was limited to a maximum of 10 min to minimize the pressure change and pCO2 gradient (see the Subsection “Analytical protocol”). In August 2022, soil-water DIC and TA fluxes were measured at Site Sw during the swamp inundation period using the same static closed chamber. The chamber was allowed to stand for approximately 1–2 h, and the DIC and TA fluxes were calculated from the slope between the initial and final values.
Analytical protocol
The pCO2 values in the water and air were measured using non-dispersive infrared (NDIR) sensors (CO2-09, Kimoto Electric Co., Ltd., Osaka, Japan) coupled with an equilibrator system fitted with a gas-permeable membrane. The precision and trueness of the pCO2 analyzer were ±5 and ±2 μatm, respectively (Kayanne et al., 2005; Saito et al., 1995). The analyzer was calibrated with pure nitrogen (0 μatm CO2) and a CO2 span gas of 475 μatm (Taiyo Nippon Sanso Co., Ltd., Tokyo, Japan) before starting the field survey. We conducted zero calibration daily using soda lime (Soda Lime No. 2, FUJIFILM Wako Pure Chemical Corporation, Osaka, Japan) and verified that the trueness did not change at the end of the fieldwork (within ±5 μatm).
Water samples for DIC and TA were collected in 250-mL Duran bottles (SCHOTT AG, Mainz, Germany) and poisoned with a saturated solution of mercuric chloride (10 g HgCl2 per 100 mL water, 200 μL per bottle) to avoid biological activity. The DIC and TA concentrations were determined by closed-cell titration using a batch-sample analyzer (ATT-05, Kimoto Electric Co., Ltd.), following the Gran plot method (Dickson, 2007). A pH meter equipped with a Radiometer Analytical PHC2401-8 Combination Red-Rod pH electrode (glass body, BNC, product no. E16M400; Hach, Colorado, USA) was used for all the analyses. The accuracies of DIC and TA were estimated to be ±2 μmol kg–1 and ±1 μmol kg–1, respectively, using triplicate measurements of the certified reference material (CRM) for DIC and TA (CRM Batch 196, Scripps Institution of Oceanography, UC San Diego, USA).
The on-site salinity (trueness ±0.01), water temperature (trueness ±0.01°C), and DO (trueness ±1%) at the platform were measured using a RINKO-Profiler (ASTD102, JFE Advantech, Nishinomiya, Japan). The pH (resolution and precision of 0.001 and ±0.003, respectively) and water level (trueness of 0.4 cm) of the platform were measured using SP-11 (Kimoto Electric) and HOBO U20L-04 (ONSET, Computer Corporation, Bourne, MA, USA) sensors, respectively. The pH sensor was calibrated using 2-Aminopyridine and 2-Amino-2-hydroxymethyl-1,3-propanediol (FUJIFILM Wako Pure Chemical Corporation) prior to the measurement. The salinity (trueness ±0.01), water temperature (trueness ±0.01°C), and DO (trueness ±1%) at sites L, M, T, S, and C were measured using the AAQ-RINKO water quality profiler (JFE Advantech).
The CO2 efflux from the soil into the air was measured using an NDIR sensor (GMP343; VAISALA Corporation, Helsinki, Finland) coupled with a gas-permeable membrane (Kayanne et al., 2005; Saito et al., 1995). The trueness of the GMP343 was ±1 μatm, and it was calibrated with pure nitrogen (0 μatm of CO2) and a CO2 span gas of 801 μatm (Taiyo Nippon Sanso Co., Ltd.) in a laboratory before the field survey. The trueness was also verified at the end of each field survey (within ±5 μatm). Gas CO2 flowed through the membrane in the chamber using a pump. CO2 was measured at 10-s intervals with GMP343 after drying with drierite.
Estimation of the water-air, soil-water, and soil-air fluxes
The water-air CO2 flux (FCO2,w-a, mol CO2 m–2 h–1) was calculated as follows (Borges et al., 2003):
where k is the gas transfer velocity (m h–1), K0 is the solubility coefficient of CO2 (mol m–3 atm–1), and ΔpCO2 is the difference in the CO2 fugacity (≅partial pressure) between pCO2,water and pCO2,air, respectively. A positive FCO2,w-a value indicates a CO2 flux from the water to the atmosphere. The in-situ mole fraction of CO2 was converted to the partial pressure of CO2 using an equation of state for the vapor phase (Weiss, 1974). K0 was determined using the equation described by Weiss (Weiss, 1974). Ideally, k should be determined by using the formula developed for mangrove-dominated estuaries (Rosentreter et al., 2017). However, because the current velocity was not observed during the study period, k was determined by using the value observed in the study area (Fukido River estuary) (k(cm h–1) = 5 ± 2 (n = 13)) by Tokoro et al. (2008) (T08), as well as by using three different empirical gas transfer velocity equations based on the wind speed, as presented by Ho et al. (2006) (H06), Jiang et al. (2008) (J08), and Dobashi and Ho (2023) (D23):
| k=0.266×U102×600Sc0.5 | (H06) (2) |
| k=(0.314×U102-0.436×U10+3.990)×600Sc0.5 | (J08) (3) |
| k=0.143×U102×600Sc0.5 | (D23) (4) |
where U10 is the wind speed at 10 m above the water surface and Sc is the Schmidt number for CO2 given by Wanninkhof (Wanninkhof, 2014). H06 accounts for high wind speeds, J08 was developed for river- and marine-dominated estuaries located near shores, and D23 is used for environments where seagrass meadows develop; k is measured in cm h–1.
The soil-air CO2 flux (FCO2,s-a mmol m–2 h–1) was calculated as follows (Leopold et al., 2013):
| FCO2,s-a=δpCO2δt×VR×T×A | (5) |
where δpCO2/δt is the temporal rate of change in pCO2, V is the volume of the chamber (0.0127 m3), R is the ideal gas constant (820528 × 10–5 atm m3 K–1 mol–1), T is the absolute air temperature (K), and A is the bottom area of the incubation chamber (0.058 m2). δpCO2/δt was calculated using 5-min average pCO2 values after reaching an equilibrium state. The r-squared value for all the δpCO2/δt data used in this study was greater than 0.98.
The soil-water DIC flux (FDIC,s–w mmol m–2 h–1) was calculated as follows (Saderne et al., 2021):
| FDIC,s-w=DICE-DICI×V×ρδt×A | (6) |
where DICI and DICE are the DIC in mmol kg–1 at the beginning and end of incubation, respectively, and ρ is the density of seawater (kg L–1) derived from the sample salinity and temperature. The same procedure was followed for the TA flux.
The inundation area in the mangrove forest was calculated to estimate the CO2 emissions from swamps to the air and from creeks to the air. Hourly changes in the inundation areas were calculated based on the water level changes at Site M1 and the 5-meter resolution DEM provided by the Geospatial Information Authority of Japan.
Data analysis
The spring-neap tidal cycle in the study area is approximately two weeks long, and the mangrove swamp is inundated semi-diurnally, except for the neap tide. To identify the difference in water quality between the spring and neap tides, we focused on the periods two days before and after the maximum and minimum tidal amplitudes occurred throughout the spring-neap tidal cycle. The middle tide was defined as the days excluding the spring and neap tide periods (Fig. 2).

Because this study focuses on the difference between the swamp inundation and exposure duration, the first half of the ebb tide was defined as the “inundation ebb” and the second half of the ebb tide was defined as the “exposure ebb” (Figs. S2 and 6d). An increase in the carbonate chemistry parameters in mangrove creeks occurs owing to porewater export from mangrove soils, which is associated with a decrease in the hydrostatic head (Call et al., 2015; Call et al., 2019). Therefore, the presence or absence of swamp inundation was determined based on the water level of 0.34 m at Site M1, where the edge of the swamp was inundated.
The DIC and TA in estuarine waters without mangrove forests are largely determined by the conservative mixing of river water and seawater (Mook, 1991).
| DICCMM=Sm·DICo+(So-Sm)·DICrSo | (7) |
where DICCMM is the expected DIC concentration obtained by the conservative mixing model (CMM). Sm is the salinity measured at Site M1. DICo, DICr, and So are constants that represent the ocean (subscript “o”) and river (“r”) end-member values. Variations in the DIC and TA owing to biogeochemical activities were determined by subtracting the conservative mixing value from the measured value in the creek.
where ΔDICM and DICm are the contributions of biogeochemical activities to DIC and the measured DIC at Site M1, respectively. The same procedure was followed for ΔTAM. The ocean and river end-member values were determined by the mean value of the water inflow during the flood tide at Site M1 (So = 33.67, DICo = 1897 μmol kg–1, and TAo = 2179 μmol kg–1), and the mean value of river water at Sites L1 to L3 (DICr = 1554 μmol kg–1 and TAr = 1591 μmol kg–1), respectively.
Statistical analysis
All statistical analyses were conducted using the statistical functions (scipy.stats) provided by the Scipy library (version 1.7.3) in Python 3.9. The statistical significance of the variations between the tidal cycles and phases was tested for each variable using the non-parametric Wilcoxon test (w-test) for a small number of samples (n < 40), or the student’s statistic (t-test) for a large number of samples (n > 40) for two-parameter comparisons. Multiple comparisons were performed using the non-parametric Kruskal-Wallis rank sum test (rank test) for a small number of samples (n < 40), or a one-way analysis of variance (ANOVA) for a large number of samples (n > 40). The results were considered statistically significant at p < 0.05.
Results
Water-air, soil-water, and soil-air fluxes
The mean atmospheric pCO2 at Site M1 was 418 ± 29 μatm (mean value ± standard deviation) throughout the study period (Fig. 2a and Table 1). In the water, pCO2 exhibited periodic variations in response to tidal level changes, with the highest values occurring during the low tide in each tidal cycle (Fig. 2b). The mean pCO2 in the water at Site M1 was 1921 ± 1506 μatm (307–4583 μatm) during the spring tides, 2232 ± 1599 μatm (423–5187 μatm) during the middle tides, and 2154 ± 1533 μatm (587–6036 μatm) during the neap tides (p < 0.0001, ANOVA) (Fig. 2b and Table 1). Figure 2a demonstrates that the pCO2 in air exhibits diurnal variations, albeit to a lesser extent than that in water.
Table 1.
Mean values (±standard deviation) and range of all parameters at Site M1
| Parameter |
Spring tides |
Middle tides |
Neap tides |
p value |
| Water temperature (°C) |
30.29 ± 1.61 (27.93–34.06) |
30.82 ± 1.89 (25.68–36.77) |
31.63 ± 1.97 (28.50–36.63) |
p < 0.0001 |
| Salinity |
32.30 ± 1.90 (14.62–33.74) |
32.05 ± 3.58 (1.71–33.90) |
31.48 ± 2.07 (21.76–33.92) |
p > 0.05 |
| DO (% saturation) |
80.22 ± 36.04 (30.24–148.07) |
68.73 ± 26.77 (22.06–141.95) |
68.00 ± 26.34 (22.45–115.67) |
p < 0.0001 |
| pH |
7.677 ± 0.309 (7.188–8.136) |
7.609 ± 0.301 (7.190–8.039) |
7.573 ± 0.254 (7.112–7.962) |
p < 0.0001 |
| pCO2 in air (μatm) |
424 ± 17 (356–472) |
419 ± 29 (369–459) |
406 ± 32 (340–475) |
p < 0.001 |
| pCO2 in water (μatm) |
1921 ± 1506 (307–4583) |
2232 ± 1599 (423–5187) |
2154 ± 1533 (587–6036) |
p < 0.0001 |
| DIC (μmol kg–1) |
2269 ± 440 (1794–3348) |
NA |
2385 ± 469 (1847–3182) |
p > 0.05 |
| TA (μmol kg–1) |
2404 ± 348 (1984–3335) |
NA |
2514 ± 326 (2169–3068) |
p > 0.05 |
NA means not available. The p values are from ANOVA comparing the spring, middle, and neap tides.
The calculated mean water-air CO2 flux was 2.0 ± 2.7 mmol m–2 h–1 (–0.15 to 14.0 mmol m–2 h–1) using H06 (Eq. 2), 2.1 ± 2.0 mmol m–2 h–1 (–0.14 to 7.0 mmol m–2 h–1) using T08, 3.6 ± 3.9 mmol m–2 h–1 (–0.25 to 18.2 mmol m–2 h–1) using J08 (Eq. 3), and 1.1 ± 1.4 mmol m–2 h–1 (–0.08 to 7.5 mmol m–2 h–1) using D23 (Eq. 4). The water-air CO2 flux was consistently positive during the low tide, indicating that Site M1 served as a net source of CO2 (Fig. 2c). No significant difference in the water-air CO2 flux was observed among the spring, middle, and neap tides (p > 0.05, ANOVA).
During the swamp inundation periods, the mean soil-water DIC and TA fluxes at Site Sw were 5.7 ± 3.3 mmol m–2 h–1 (0.2 to 13.4 mmol m–2 h–1) and 3.5 ± 2.0 mmol m–2 h–1 (0.4 to 8.0 mmol m–2 h–1), respectively (Fig. S3). The DIC flux consistently exceeded the TA flux. Time-series changes were observed in the DIC and TA fluxes, which tended to increase during the ebb tide. No significant differences were found in the soil-water DIC and TA fluxes between the spring and neap tides (p > 0.05, w-test).
During the swamp exposure periods, the mean soil-air CO2 flux inside the mangrove forest was 3.1 ± 1.6 mmol m–2 h–1 (0.84 to 6.4 mmol m–2 h–1) during the spring tides, 3.6 ± 1.5 mmol m–2 h–1 (1.9 to 7.4 mmol m–2 h–1) during the middle tides, and 3.5 ± 1.8 mmol m–2 h–1 (0.97 to 8.5 mmol m–2 h–1) during the neap tides. No significant differences were observed in the soil-air CO2 flux between the spring, middle, and neap tides (p > 0.05, ANOVA).
Time series variations of carbonate-chemistry parameters
The pCO2 in the water varied based on the concentration and ratio of DIC and TA. Figure 3 illustrates the periodic changes in the DIC, TA, and pCO2 in water, as well as the pH values during spring and neap tides, reflecting the tidal variations. When comparing the ranges of DIC and TA, the DIC was consistently approximately 300 μmol kg–1 lower than TA during high tides (Fig. 3a, b, and g). Conversely, DIC and TA displayed similar values during low tides. Although the ranges and concentrations of DIC and TA over a 24-h sampling period did not exhibit significant differences between the spring and neap tides (p > 0.05 for DIC and TA, w-test) (Fig. 3a, b, and g), the maximum value of pCO2 in water during the neap tides was significantly higher than that during the spring tides (p < 0.0001, t-test) (Fig. 3c, d, h, and i).
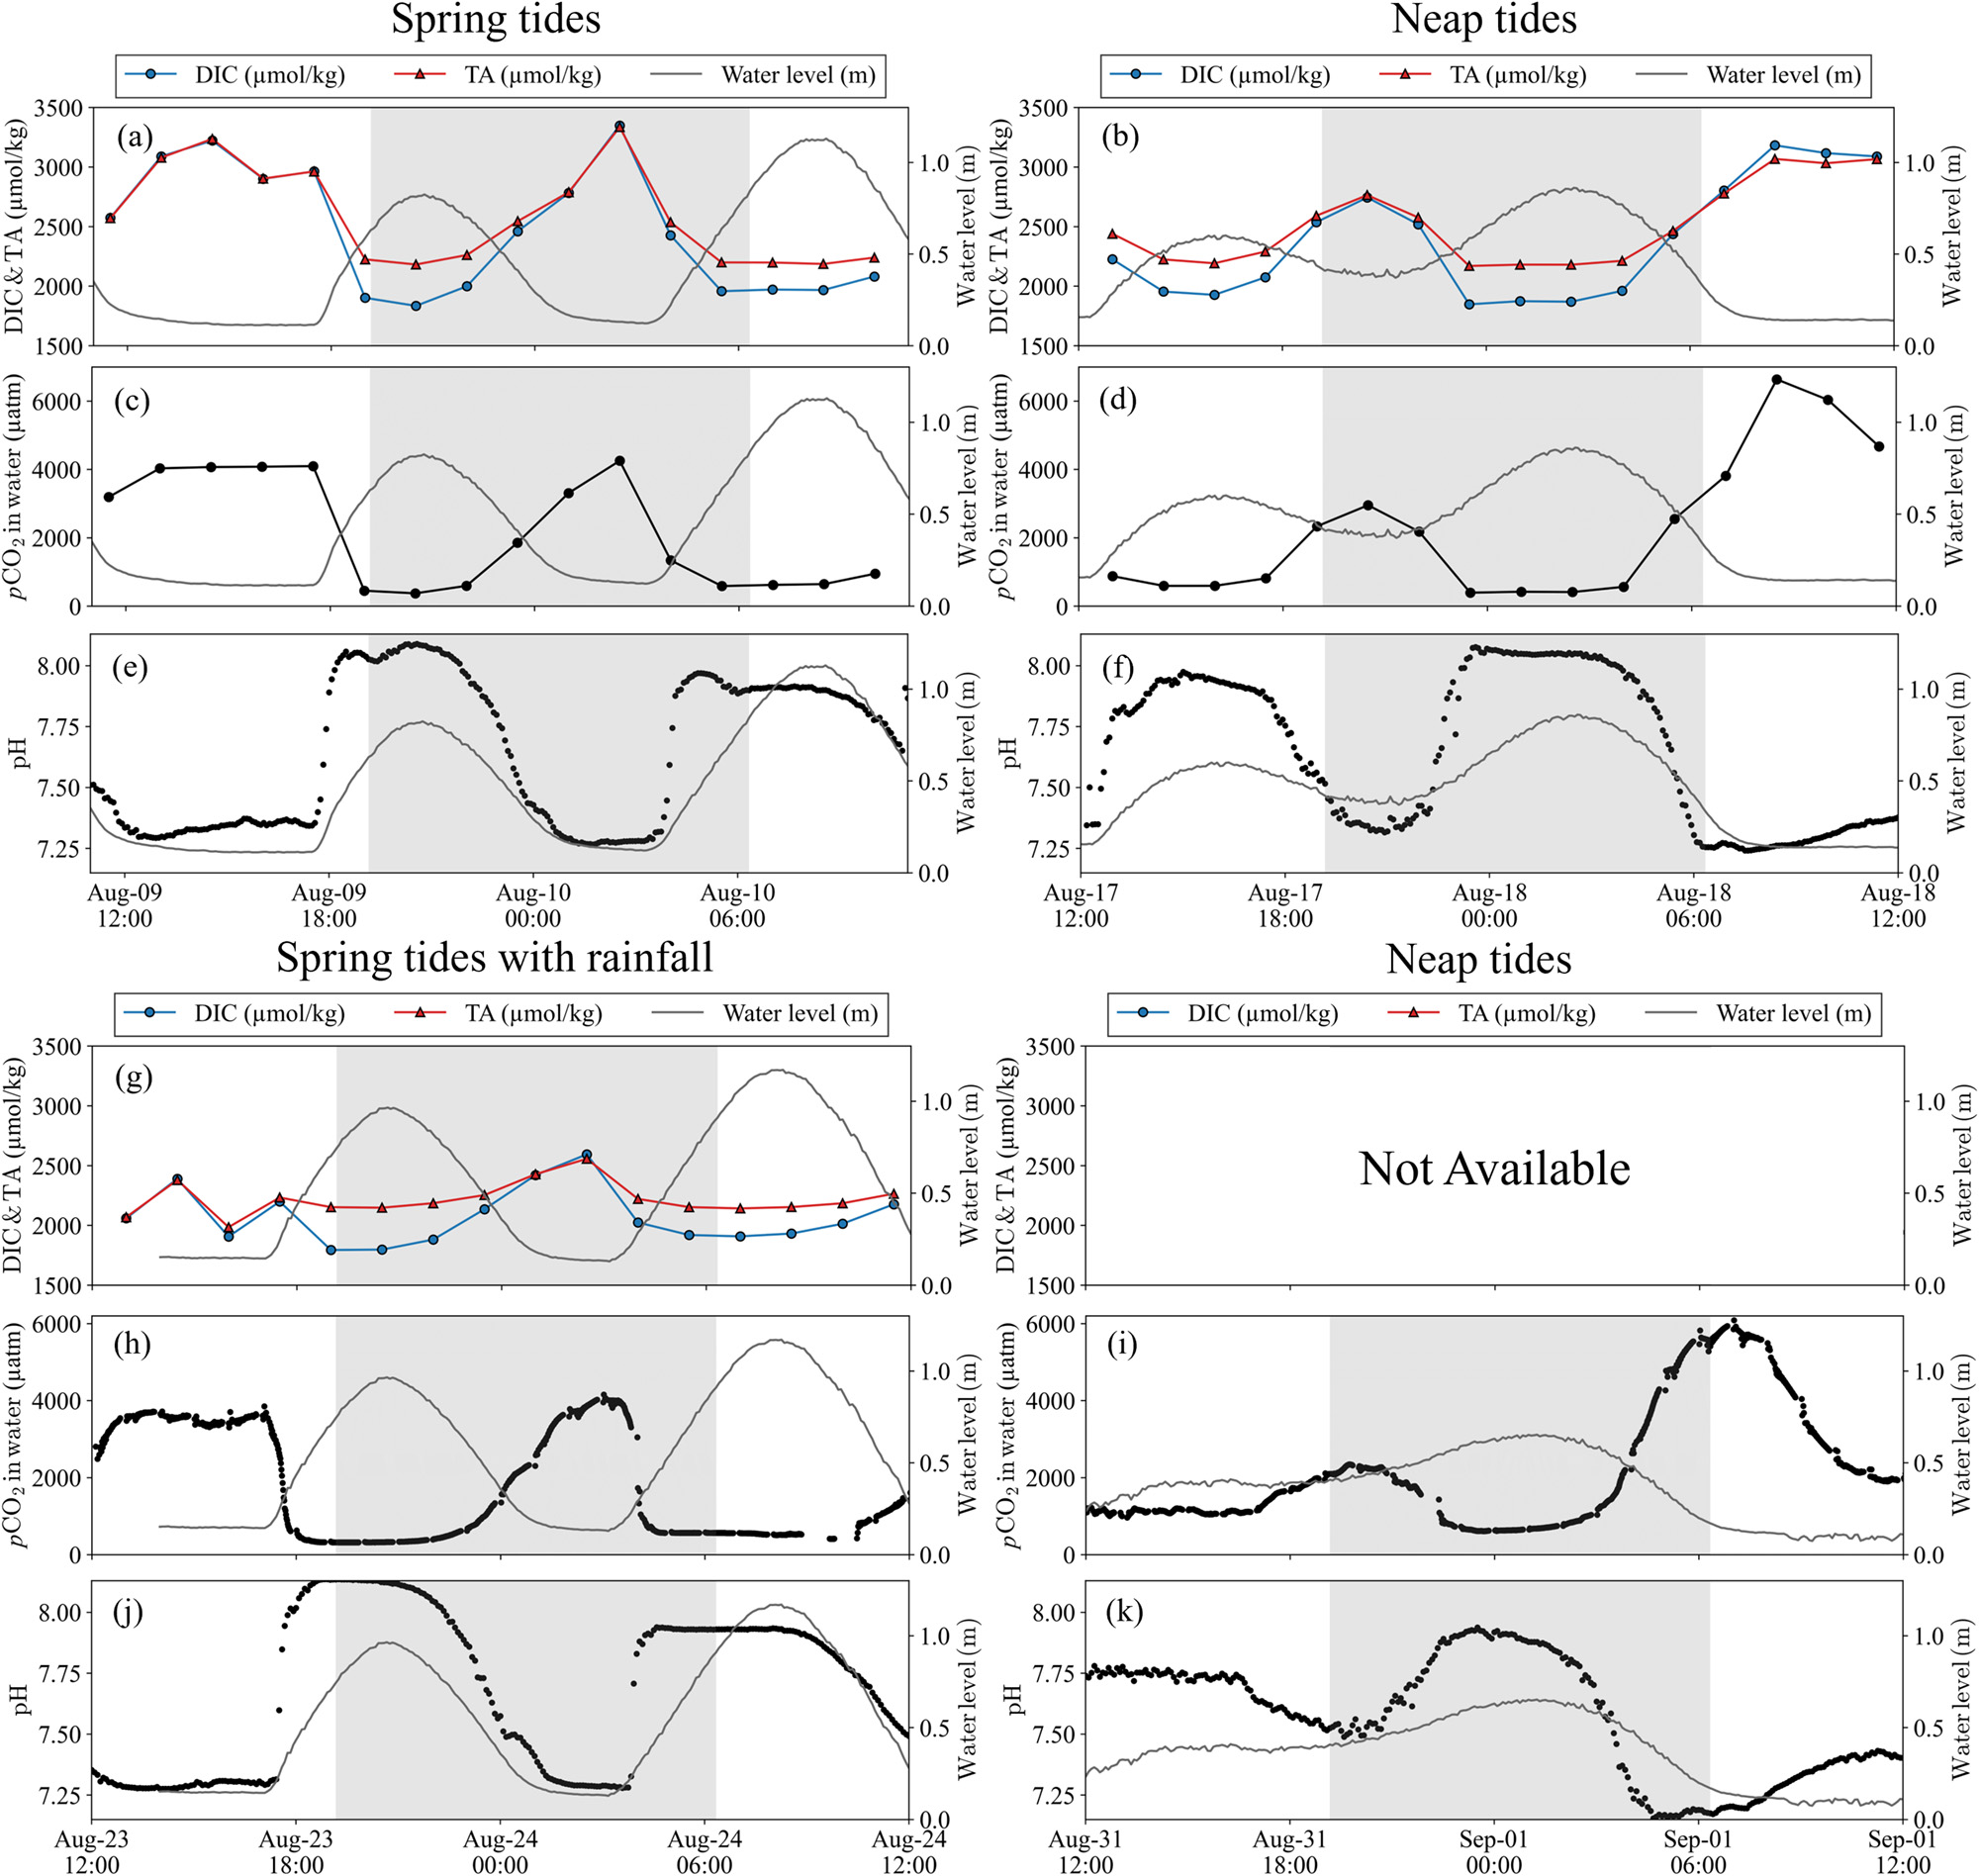
Figure 3 also includes DIC, TA, and pH values on rainy days (August 23–24), which were found to be 2072 ± 226 μmol kg–1 (1794–2594 μmol kg–1), 2219 ± 135 μmol kg–1 (1985–2556 μmol kg–1), and 7.686 ± 0.323 (7.276–8.136), respectively (Fig. 3g and j). When comparing the spring tides without rainfall (August 9–10) to those with rainfall (August 23–24), significant differences were observed in DIC and TA (p < 0.05 for DIC; p < 0.001 for TA, w-test) (Fig. 3a and g), whereas no significant difference was found in the pH values (p > 0.05, t-test) (Fig. 3e and j). Despite the significant differences in DIC and TA between the spring tides without rainfall (August 9–10) and with rainfall (August 23–24), the pCO2 in water did not display a significant difference (p > 0.05, t-test) (Fig. 3c and h).
Spatial variation of carbonate-chemistry parameters
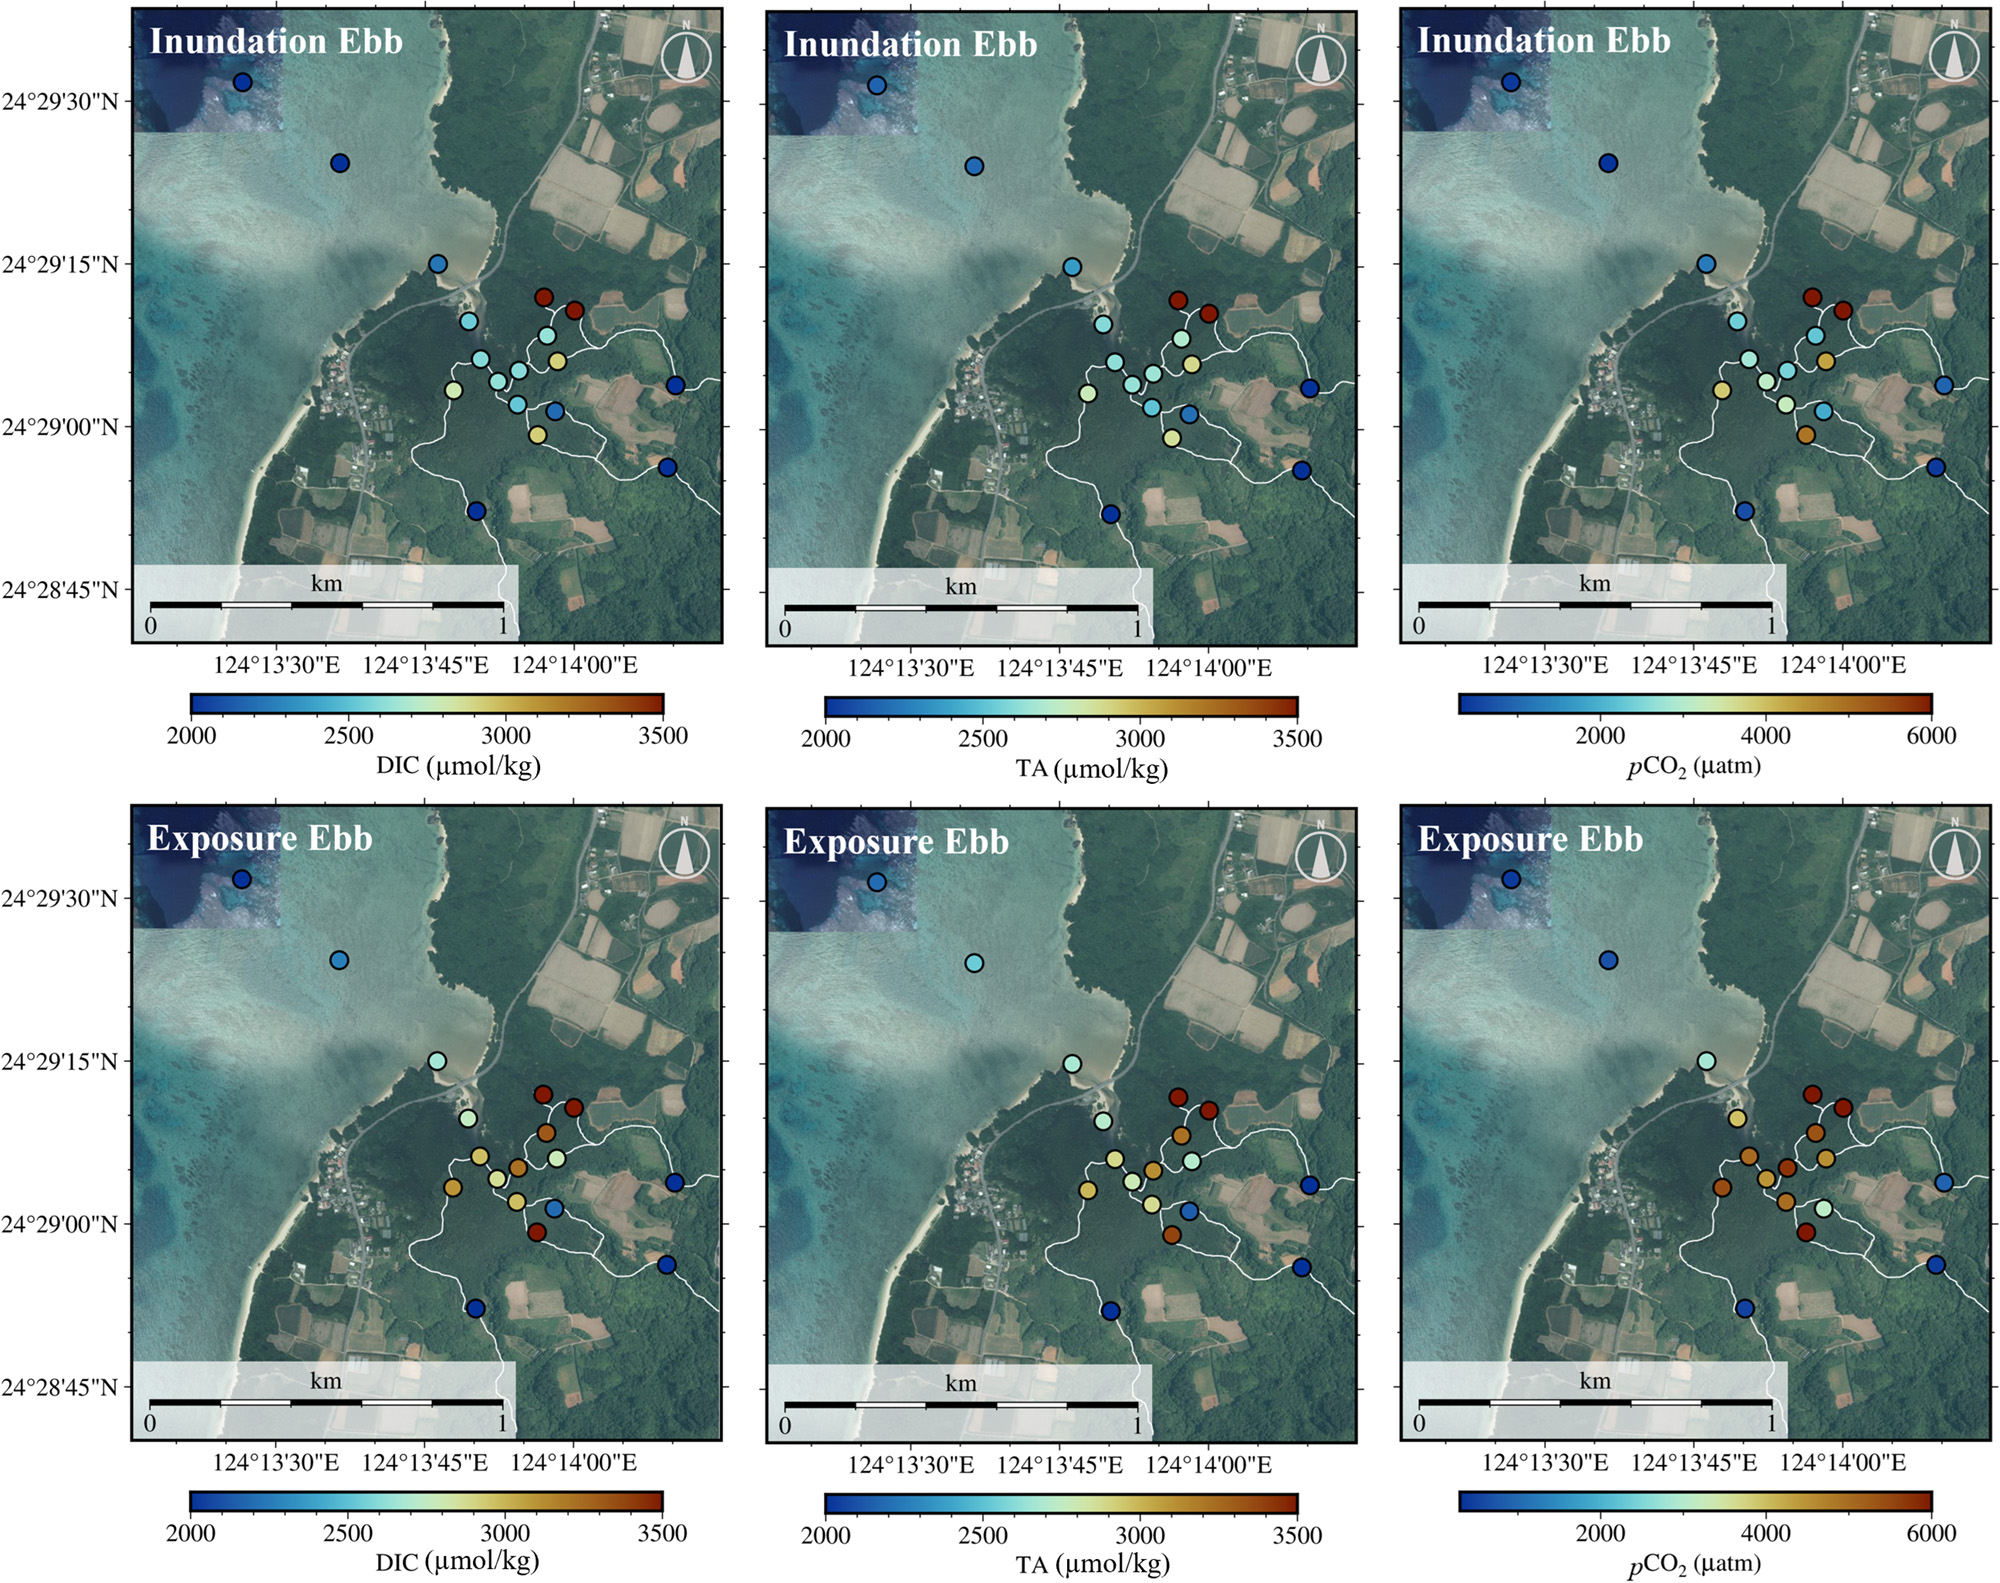
Based on the spatial water sampling results presented in Fig. 4 and Table S2, during the ebb exposure period, there was an apparent increase in the DIC, TA, and pCO2 in the water (calculated from water temperature, salinity, DIC, and TA), whereas the salinity and pH decreased (Fig. S4 and Table S1). The inundation ebb and exposure ebb data were collected before and after the mangrove swamp dried during the ebb tides (Figs. S2 and 6d). Throughout the transition from the inundation ebb to the exposure ebb period, the DIC and TA increased as the salinity decreased, except for Sites M7 and M12 (Fig. 4). Notably, the DIC and TA values at Site M7 were lower than those at the other mangrove stations (Fig. 4 and Table S2), indicating the strong influence of freshwater discharge from Site L2 (Fig. S4). The DO levels at Sites M1–M12 did not exhibit significant changes from the inundation ebb to the exposure ebb period, suggesting that DO was primarily consumed within a few hours after the inundation of the mangrove swamp (Fig. S4 and Table S2).
Discussion
Variation of carbonate chemistry parameters during swamp inundation and exposure periods
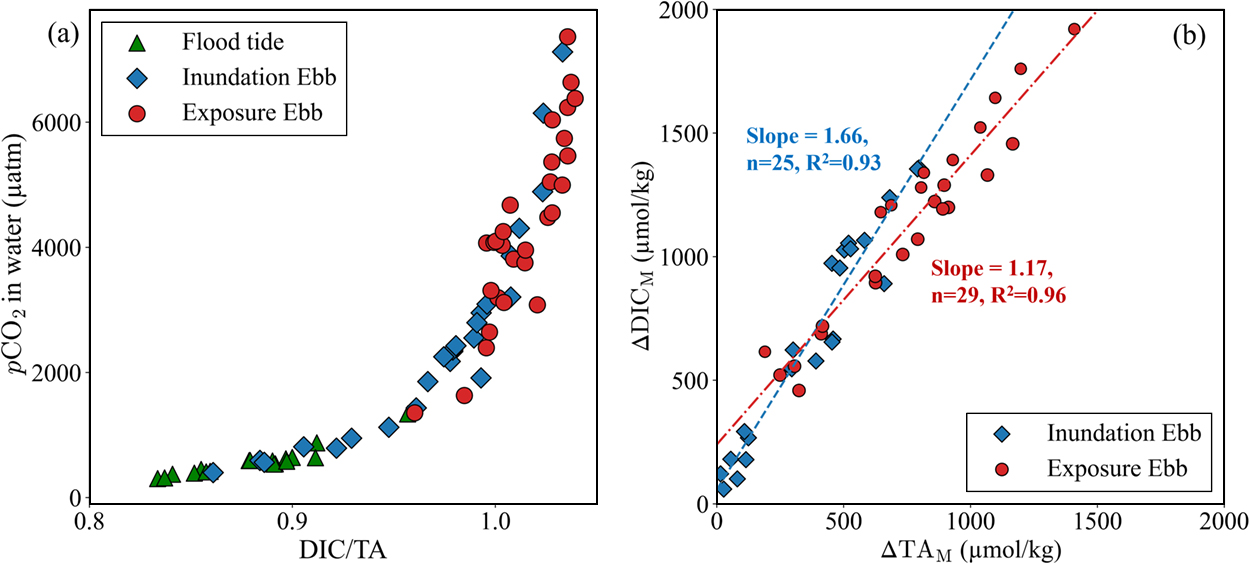
The variability in pCO2 in the water was determined by the concentration and ratio of DIC and TA; when the DIC/TA ratio exceeded 1.0, the concentration of CO2 in the water increased rapidly (Fig. 5a). The continuous 24-h survey results depicted in Fig. 3 reveal that temporal variations in carbonate chemistry parameters exhibit a similar semi-diurnal pattern, irrespective of the spring and neap tides or the presence or absence of rainfall. The mean values of DIC and TA for the freshwater inflow were 1554 and 1591 μmol kg–1, respectively, whereas their offshore (Site C1) values were 1858 and 2177 μmol kg–1 (Table S1). Consequently, the higher DIC and TA values at Sites M1–M12 can be attributed to the export of porewater from the mangrove soil (Fig. 4 and Table S1). The mean DIC/TA ratio at Site M1 during the flood tides (seawater) was 0.880 (Fig. 5a), whereas those at Sites M1–M12 were 0.969 and 1.014 during the inundation ebb period and the exposure ebb period, respectively. Spatially, extremely high pCO2 values were observed upstream of the mangrove creek at Sites M11 and M12 (Fig. 4 and Table S1). This indicates that the influence of mangrove soils became more pronounced upstream of the mangrove creek (Chen et al., 2021; Maher et al., 2013).
The ΔDICM and ΔTAM values in Eq. 8 are assumed to be determined by the microbial decomposition of the soil organic matter and porewater export through tidal pumping. The increases in the ΔDICM and ΔTAM values in site M1 per the tidal cycle were 1137 ± 282 μmol kg–1 and 841 ± 273 μmol kg–1, respectively. The biogeochemical activities in mangrove waters can be divided into mangrove-derived and submerged reactions (Ho et al., 2017). The former is the microbial decomposition of the soil organic matter and porewater export through tidal pumping, whereas the latter includes a primary production by phytoplankton and degradation of DOC. Previous studies have reported that 90–100% of the exported DIC and TA from mangrove forests originate from porewater in a mangrove swamp via tidal pumping (Chen et al., 2021; Maher et al., 2013; Taillardat et al., 2018). The mean value of Chl. a in the Fukido River estuary was 1.2 ± 1.2 μg L–1 (Lønborg et al., 2023), and the seasonal variation of TA and DIC at the offshore site of the Fukido River estuary was approximately ±10 μmol kg–1 for both parameters (Chen et al., 1995; Gregor and Gruber, 2021). These results suggest that the effect of phytoplankton photosynthesis on ΔDICM and ΔTAM per tidal cycle is negligible. The DOC in mangrove waters is known to be higher owing to porewater export (Kristensen et al., 2008), and an increase in the DOC owing to the presence of mangroves has been reported in the Fukido River estuary (the mean ± standard deviation was 109 ± 26 μmol kg–1) (Kida et al., 2019). However, mangrove-derived organic matter barely degraded within a few days (Dittmar et al., 2006). Thus, the effect of DOC degradation on ΔDICM and ΔTAM per tidal cycle should be negligible.
Several studies have used the stoichiometric relationship between ΔDICM and ΔTAM or nDIC and nTA to discuss the origin of mineralization pathways (Akhand et al., 2021b; Alongi, 2022; Borges et al., 2003; Bouillon et al., 2007a; Ho et al., 2017; Santos et al., 2019; Sippo et al., 2016; Volta et al., 2020; Chielle et al., 2024). However, as indicated in the Introduction, these stoichiometric relationships do not consider secondary redox reactions in water (Krumins et al., 2013; Reithmaier et al., 2021a); therefore, it should be difficult to identify the origin of the mineralization pathways in mangrove soils. Although it is difficult to estimate the original mineralization process using the stoichiometric relationship of DIC and TA, the slope of ΔDICM and ΔTAM may represent the characteristics of the local mangrove environment as these slopes vary in each mangrove ecosystem. Owing to the repeated inundation of mangrove forests, the soil environment is expected to undergo substantial fluctuations within a brief timeframe. Nevertheless, discussions regarding the ΔDICM to ΔTAM ratio in mangrove creeks have frequently focused on representative values while neglecting its inherent variability. In this study, the stoichiometric relationship between ΔDICM and ΔTAM revealed a change in the slope between the swamp inundation and exposure periods (Fig. 5b). ΔDICM and ΔTAM exhibited a strong correlation at all stations during the inundation ebb period (n = 25, R2 = 0.93) and the exposure ebb period (n = 29, R2 = 0.96), with slopes of 1.66 and 1.17, respectively (Fig. 5b). The slope during the inundation ebb period was relatively large compared to that during the exposure ebb period, suggesting a greater production of DIC than TA (Fig. 5b). During the flood tide, DO-saturated seawater flowed into the mangrove forest; however, most of it was consumed within a few hours after the mangrove swamps were inundated (Table 1, Fig. S4). This suggests that most of the DO was immediately consumed by active aerobic respiration or secondary redox reactions in the mangrove swamps. DIC increased more than TA by aerobic respiration and secondary redox reactions that utilize oxygen (Krumins et al., 2013). Similarly, the fluxes of DIC and TA between the soil and water indicated a greater production of DIC than TA during the swamp inundation period (Fig. S3). ΔDICM and ΔTAM increased more during the swamp exposure period than that during the swamp inundation period (Fig. 5b). This was likely owing to the influence of exported porewater, which became more pronounced during the swamp exposure period (Call et al., 2015; Call et al., 2019; Taillardat et al., 2018). The slopes of ΔDICM and ΔTAM during the swamp exposure period were also smaller than those during the swamp inundation period (Fig. 5b). This can be attributed to two factors: (1) during the swamp exposure period, porewater that influenced by more anaerobic reactions in the soil was exported, and (2) secondary redox reactions in the creeks were suppressed by anoxic conditions during the low tide.
In this study, we found that the slopes of ΔDICM and ΔTAM significantly differed for the swamp inundation and exposure periods (Fig. 5b), indicating that the slopes of ΔDICM and ΔTAM obtained in the mangrove creeks imply comprehensive environmental characteristics, including secondary reactions in water, rather than the origin of the mineralization processes in soils. Generally, the TA value is larger than the DIC value in surface waters of the open ocean, with a DIC/TA ratio of approximately 0.86 (Gregor and Gruber, 2021). In contrast, the stoichiometric relationship between ΔDICM and ΔTAM or nDIC and nTA in adjacent mangrove waters demonstrated a greater production of DIC than TA (Akhand et al., 2021b; Alongi, 2022; Borges et al., 2003; Bouillon et al., 2007a; Ho et al., 2017; Santos et al., 2019; Sippo et al., 2016; Volta et al., 2020; Chielle et al., 2024). Moreover, the DIC and TA rapidly increase during the low tide, and the DIC/TA ratio approaches 1.0 (Bouillon et al., 2007b; Cabral et al., 2021; Linto et al., 2014; Sippo et al., 2016; Zablocki et al., 2011). These results indicate that the increase in DIC may be more dominant than that of TA in mangrove creeks owing to interactions with mangrove swamps, not only in the Fukido River estuary, but also in other mangrove forests.
Controlling factors of pCO2 in water over the spring-neap (lunar) tidal cycle
As depicted in Fig. 2, the maximum pCO2 in water during one tidal cycle increased from the spring tide (4583 μatm) to the neap tide periods (6036 μatm). The semidiurnal tidal cycles exhibited intensified tidal asymmetry as the transition progressed from the spring to neap tides (Fig. 2). Consistent with the findings of Taillardat et al. (2018), during the neap tide, the increase in pCO2 was small in the first asymmetric tidal cycle, which rapidly increased in the following tidal cycle (Fig. 2). The theoretical relationship between DIC, TA, and pCO2 under the condition of salinity of 31.30 and water temperature of 30.78°C (mean values of the entire study period) indicates that the pCO2 should not exceed 4749 μatm when the DIC and TA values are below 4000 μmol kg–1 and the DIC/TA ratio remains below 1.0 (Humphreys et al., 2022) (Fig. 6a). Throughout the spring tides at Site M1, the mean DIC/TA ratio was 0.880 during the flood tide, which increased to 0.997 during the exposure ebb period (Fig. 6b). In the case of neap tides, the mean DIC/TA ratio at Site M1 was 0.873 during the flood tide, exhibiting similar results to the spring tides, whereas the mean DIC/TA ratio during the exposure ebb period increased to 1.020, which was higher than 1.0 (Fig. 6c). Consequently, the pCO2 value in water exceeded 4749 μatm during the exposure ebb period of the neap tides (Figs. 2b and 6c).

Generally, the carbonate chemistry parameters in mangrove creeks are determined via porewater export through lateral advection by tidal pumping, mainly from crab burrows (Call et al., 2015; Call et al., 2019; Chen et al., 2021; Faber et al., 2014; Maher et al., 2018; Nakamura et al., 2023; Santos et al., 2019; Sippo et al., 2016; Taillardat et al., 2018). The increases in ΔDICM and ΔTAM per tidal cycle where the maximum pCO2 was recorded were 1457 μmol kg–1 and 1166 μmol kg–1 during the spring tide, but 1289 μmol kg–1 and 896 μmol kg–1 during the neap tide, respectively. This may indicate that the amount of porewater exported by lateral advection via tidal pumping was greater during the spring tide compared to that during the neap tide. However, the maximum value of pCO2 was higher in the neap tide (6036 μatm) compared to that in the spring tide (4583 μatm), although ΔDICM and ΔTAM increased more in the spring tide than in the neap tide. The ΔDICM /ΔTAM at the low tide was 1.250 for the spring tide, and 1.439 for the neap tide, suggesting that the increase in DIC and TA was greater at the spring tide than that at the neap tide, but that the pCO2 increased at the neap tide because the environment provided more DIC than TA (Fig. 6b and c).
The semi-monthly pCO2 oscillations at Site M1 may have been controlled by an increase in the DIC/TA ratio as the duration of the swamp inundation increased. Environmental variations within the mangrove forest during the spring and neap tides were characterized by the inflow discharge and duration of the swamp inundation. At Site M1, the maximum depth reached 1.2 m during the spring tides and 0.7 m during the neap tides, indicating a greater inflow of seawater during the spring tides (Fig. 2). Conversely, during the neap tide, the duration of swamp inundation increased owing to tidal asymmetry (Figs. 2 and 6d). Throughout the study period, the duration of the swamp inundation per a tidal cycle was approximately 400 min for spring tides, whereas exceeding 800 min for neap tides. There was a strong negative correlation between the minimum pCO2 value and maximum tidal height (Fig. 7a), suggesting that an increased inflow of seawater resulted in a decrease in pCO2 during the spring tides when the tidal amplitude was larger, as reported by Call et al. (2015). In contrast, there was no significant difference between the maximum tidal height and maximum pCO2 (Fig. 7c). However, a positive correlation was observed between the duration of the swamp inundation and the maximum and mean pCO2 values (Fig. 7e and f). When the duration of inundation significantly increased, the maximum pCO2 during the semi-diurnal tidal cycle exceeded 4749 μatm (Fig. 7f).

The increase in the duration of swamp inundation owing to asymmetric tides is thought to increase the pCO2 in mangrove creeks via two mechanisms: (1) a longer inundation duration provides more DIC from the swamp surface layer, and (2) asymmetric tides suppress the export of porewater in the first tidal cycle, thus the subsequent tidal cycle exports aged porewater that is more affected by anaerobic decomposition. Regarding the former, as shown in Subsection “Variation of carbonate chemistry parameters during swamp inundation and exposure periods”, the slopes of ΔDICM and ΔTAM were larger during the swamp inundation period compared to those during the swamp exposure period, indicating that more DIC was supplied (Fig. 5b). Therefore, the DIC/TA ratio and pCO2 should increase during neap tides when the duration of swamp inundation is longer owing to tidal asymmetry. Regarding the latter, the aged porewater is exported after an asymmetric tidal cycle (Taillardat et al., 2018). During neap tides, when the duration of swamp inundation is longer owing to tidal asymmetry, porewater that is more anaerobically influenced is exported owing to its longer residence time in the soil (Call et al., 2015; Call et al., 2019). Part of the TA produced in mangrove soils may be removed by oxidation reactions in creeks, such as sulfide oxidation (Krumins et al., 2013; Reithmaier et al., 2021a). Therefore, during neap tides, the DIC/TA ratio and pCO2 should increase in mangrove creeks.
The physical interactions between tidal oscillations and mangrove swamps are considered important for semi-monthly pCO2 oscillations (Call et al., 2015; Call et al., 2019; Taillardat et al., 2018). However, the results of this study suggest that in addition to the physical interactions between tidal oscillations and mangrove swamps, differences in the geochemical processes that cause changes in the DIC/TA ratio are important.
Fate of sequestered carbon in the Fukido River mangrove forest
Carbon sequestered in mangrove soils has the following three main fates: burial in the soil, CO2 emissions to the atmosphere, and outwelling into the ocean. Of these, the outwelling of DIC to the ocean is considered the most important (Maher et al., 2018; Reithmaier et al., 2023). The area of mangroves in the Fukido River estuary was estimated to be 20.04 ha (Baloloy et al., 2021). By combining the reported values of each flux with the results of this study, we investigated the fate of sequestered carbon in the Fukido River mangrove forest. The carbon burial rate estimated from the 210Pb decay was 22.5 ± 17.5 mmol m–2 d–1 based on four 1-m soil cores collected from the mangrove fringe, mangrove interior, and landward side (Tateda et al., 2005). Therefore, approximately 4.51 ± 3.50 kmol d–1 of carbon was assumed to be buried per day.
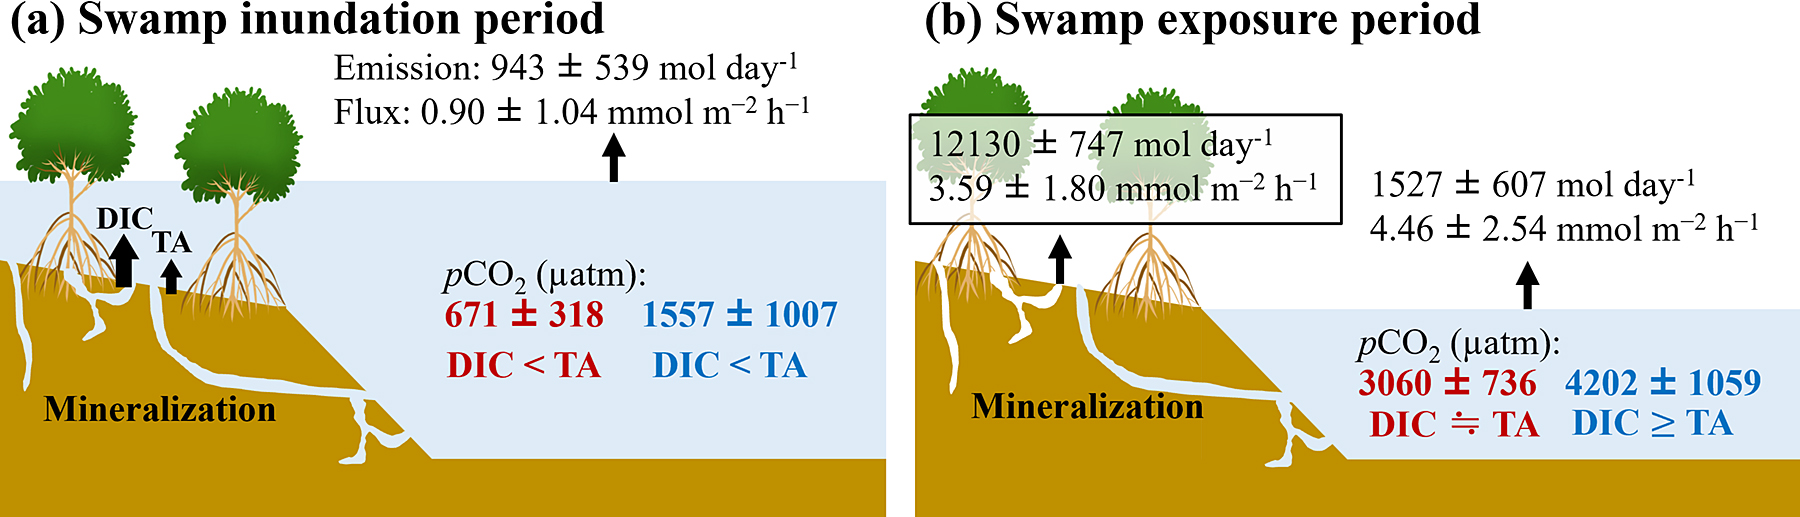
Water-air CO2 emissions (integrated flux by inundated area) in the Fukido River estuary were lower than soil-air CO2 emissions (integrated flux by exposed area). The mean water-air CO2 flux, derived from the four empirical equations, was 54.4 ± 17.2 mmol m–2 d–1, which closely aligns with the estimated global average (56.8 ± 8.9 mmol m–2 d–1) (Rosentreter et al., 2018). The mean soil-air CO2 flux, which was determined by using a static chamber, was 86.2 ± 43.2 mmol m–2 d–1, which was slightly lower than the global average (103.3 ± 39.3 mmol m–2 d–1) (Table S3) (Shiau and Chiu, 2020). However, a previous study estimated the CO2 flux from the soil to the atmosphere to be 38.8 mmol m–2 d–1 considering seasonal variability, which was lower than the results measured in this study (Tomotsune et al., 2018). In the Fukido River estuary, CO2 fluxes from the soil to the atmosphere tended to increase in summer, when temperatures were higher and benthic organisms were more active (Tomotsune et al., 2020; Tomotsune et al., 2018). Thus, the soil-air CO2 flux measured in August in this study may have been higher than that estimated from the annual measurements. Globally, the soil-air CO2 flux appears to be approximately twice that of the water-air CO2 (Rosentreter et al., 2018; Shiau and Chiu, 2020), which is supported by the findings of this study. The creek area, determined by using the Google Earth polygon function, was approximately 1.64 ha. Assuming that the measured pCO2 at Site M1 represents the values for the Fukido River estuary, the water-air CO2 emissions calculated from the inundated area per hour and the CO2 flux was 2253 ± 717 (1636–3990) mol d–1 (Fig. 8a and b). In contrast, the soil-air CO2 emission during the low tide was 12130 ± 747 (10620–13025) mol d–1, which was approximately 5.4 times higher than the water-air CO2 flux. This disparity is attributed to the significant increase in pCO2 in the creeks occurring during the low tide, when the surface area is reduced compared to that during the high tide.
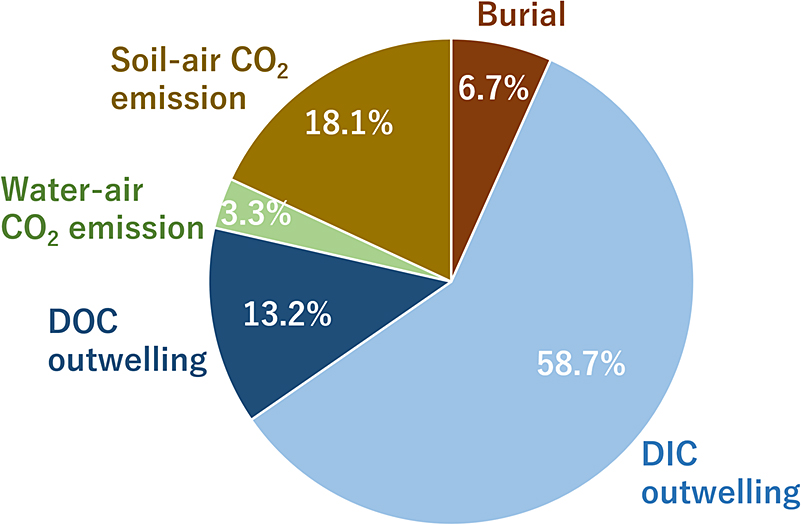
The DIC and DOC fluxes from the mangrove forest to the ocean were estimated to be 196 ± 83 mmol m–2 d–1 and 45 ± 28 mmol m–2 d–1, respectively (Ohtsuka et al., 2020). Therefore, approximately 39.4 ± 16.7 kmol d–1 DIC and 8.8 ± 5.5 kmol d–1 DOC were outwelled to the ocean per day. In total, approximately 6.7% of the sequestered carbon was buried in the soil, and approximately 72% of the sequestered carbon was outwelled to the ocean as the DIC and DOC (Fig. 9). The POC and litter outwellings were not considered in this study; however, they are generally considered to be equal to or less than the DOC outwelling (Maher et al., 2018; Reithmaier et al., 2023). The pCO2 in the creeks rapidly increased during the low tide and acted as a net source of CO2 to the atmosphere (Fig. 2). However, this was only approximately 3.3% of the fate of the sequestered carbon (Fig. 9). In addition, a previous study reported that the seas adjacent to the Fukido River mangroves act as net sinks for CO2 (Tokoro et al., 2014). This suggests that approximately 94.6% of the outwelled DIC from the Fukido River mangrove forest was stored in the ocean, indicating that the DIC outwelling was the largest sink for atmospheric CO2, as reported in other mangrove forests (Maher et al., 2018; Reithmaier et al., 2023).
Alongi (2022) reported that in mangrove forests worldwide, the amount of CO2 emissions from soil to air is 90 TgC y–1 and from water to air are 49 TgC y–1. However, these CO2 emissions were estimated by extrapolating the area of the mangrove forests multiplied by the average fluxes measured in different mangrove forests (Alongi, 2020; Alongi, 2022). This indicates that these CO2 emission estimates do not consider the ever-changing inundation conditions of mangrove swamps. Upon extrapolating the results of this study using the same method as that by Alongi (2022), the CO2 emission from the soil was 10902 mol d–1 and that from the water was 17274 mol d–1. This was approximately 1.6 times higher for soil emissions than for water emissions, which is generally consistent with the ratio estimated by Alongi (2022). However, the integrated CO2 emissions calculated from the hourly inundation area and fluxes were 2253 mol d–1 from water and 12130 mol d–1 from soil, indicating emissions that were approximately 5.4 times higher from water than from soil. This suggests that the current extrapolation method may not fully capture the actual CO2 emissions from mangrove ecosystems.
Note the difference in the CO2 flux between the swamp inundation and exposure periods. During the swamp inundation period, the soil-air CO2 flux was partly interrupted, and the water-air CO2 flux was 0.90 ± 1.04 mmol m–2 h–1 (Fig. 8a). However, the water-air CO2 flux during the swamp exposure period was approximately five times higher than that during the swamp inundation period owing to the rise in the pCO2 and DIC in the water as a result of tidal pumping (Fig. 8b). Based on the DEM and water level changes at Site M1, the maximum inundation area of the mangrove forest was calculated to be 71.9% during the spring tide and 26.9% during the neap tide. As discussed in Subsection “Controlling factors of pCO2 in water over the spring-neap (lunar) tidal cycle”, during the neap tide, most mangrove soils were exposed throughout the day, although the duration of swamp inundation increased owing to tidal asymmetry. Consequently, the mean CO2 emissions from the soil and water to the air were 13303 ± 849 mol d–1 during the spring tide and 15336 ± 1101 mol d–1 during the neap tide, indicating that CO2 emissions to the air were greater during the neap tide.
Limitations
In this study, based on measurements of the spatiotemporal carbonate chemistry parameters in a small mangrove ecosystem, which is ideal for tracking carbon budgets, we clarified the factors controlling pCO2 variation in creeks over a semi-monthly cycle and estimated the CO2 emissions associated with changes in the swamp inundation area. The CO2 fluxes estimated in this study were based on measurements obtained during relatively calm weather conditions in the summer; therefore, whether the same trends are observed during typhoons remains unknown. As shown in Fig. 3, the DIC and TA concentrations in the creeks significantly decreased on rainy days. A similar trend was observed in other mangrove ecosystems (Reithmaier et al., 2021b). However, there was no significant difference in the pCO2 values between those with and without rain (Fig. 3), which is because dilution by rainfall reduced the concentrations of TA and DIC but maintained the DIC/TA ratio. Increases in litterfall and DOC owing to typhoon disturbances have been previously reported (Kida et al., 2019; Ohtsuka et al., 2019). However, the effects of these disturbances on the carbonate chemistry parameters are unknown. According to the Japan Meteorological Agency, the Ishigaki Island receives more than 1 mm of precipitation for approximately 120 days per year. Therefore, estimations of annual CO2 fluxes based on observations under quiescent conditions are unlikely to capture actual CO2 fluxes.
As discussed in Subsection “Fate of sequestered carbon in the Fukido River mangrove forest”, the estimation of CO2 emissions from mangrove ecosystems depends on swamp inundation conditions. Therefore, extrapolating CO2 emissions from reported CO2 fluxes by multiplying them by the mangrove area is unlikely to capture the actual CO2 emissions. However, estimating CO2 emissions by considering the swamp inundation conditions from the field survey is difficult. In this study, water-air CO2 emissions were calculated assuming that the pCO2 values measured at Site M1 represented the entire mangrove forest. Regardless, as shown in Fig. 4, pCO2 levels inside the mangroves were higher than those at the mouth of the estuary. Therefore, the estimated CO2 emissions from the creeks to the air may have been underestimated in this study. Owing to the limitations of observational studies, numerical analyses combining flow and ecosystem models are essential for elucidating the annual carbon budget of mangrove ecosystems in the future.
Conclusion
In this study, we investigated the semi-diurnal and semi-monthly variations in carbonate chemistry parameters (pCO2, DIC, and TA) in mangrove creeks and reported the following three novel findings:
(1) The slope of ΔDICM and ΔTAM significantly differed between swamp inundation and exposure periods, and the DIC was more abundantly supplied in comparison to TA when the swamps were inundated (Fig. 5b). The slopes of ΔDICM and ΔTAM obtained in the mangrove creeks are likely to imply comprehensive environmental characteristics, including secondary reactions in water, rather than the origin of the mineralization processes in soils.
(2) During the semi-monthly tidal oscillations, the increase in pCO2 was small in the first asymmetric tidal cycle, and pCO2 rapidly increased in the subsequent tidal cycle, which is consistent with the findings of Taillardat et al. (2018) (Fig. 2). In addition to the increase in DIC and TA associated with the porewater exported via tidal pumping, the variation in the DIC/TA ratio in the water is also important for the variation in pCO2 during the lunar cycle (Fig. 6).
(3) Although high pCO2 values were recorded in the mangrove creeks, CO2 emissions from the creeks to the air were approximately 5.4 times lower than those from the swamps to the air (Fig. 8). This suggests that DIC outwelling was the largest sink for atmospheric CO2 in the Fukido River estuary, as reported for other mangrove forests (Maher et al., 2018; Reithmaier et al., 2023).
Declaration of Competing Interest
The authors declare that they have no known competing financial interests or personal relationships that could have appeared to influence the work reported in this paper.
Data Availability Statement
Data- Data set for the article is available online in the Zenodo repository (https://doi.org/10.5281/zenodo.10491692).
Acknowledgments
We are grateful for funding provided by the Japan Society for the Promotion of Science (KAKENHI grants 21J23067). We would like to thank the anonymous reviewers for improving the manuscript. We would like to thank Editage (www.editage.jp) for English language editing. Field surveys in this study were conducted with permission from the Ministry of the Environment in Japan, and Ishigaki city in Okinawa, Japan.
References
- Akhand, A., Chanda, A., Manna, S., Das, S., Hazra, S., Roy, R., Choudhury, S. B., Rao, K. H., Dadhwal, V. K., Chakraborty, K., Mostofa, K. M. G., Tokoro, T., Kuwae, T. and Wanninkhof, R. (2016) A comparison of CO2 dynamics and air-water fluxes in a river-dominated estuary and a mangrove-dominated marine estuary. Geophys. Res. Let. 43, 11,726–11,735. https://doi.org/10.1002/2016GL070716
- Akhand, A., Chanda, A., Watanabe, K., Das, S., Tokoro, T., Chakraborty, K., Hazra, S. and Kuwae, T. (2021a) Low CO2 evasion rate from the mangrove-surrounding waters of the Sundarbans. Biogeochemistry 153, 95–114. https://doi.org/10.1007/s10533-021-00769-9
- Akhand, A., Watanabe, K., Chanda, A., Tokoro, T., Chakraborty, K., Moki, H., Tanaya, T., Ghosh, J. and Kuwae, T. (2021b) Lateral carbon fluxes and CO2 evasion from a subtropical mangrove-seagrass-coral continuum. Sci. Total Environ. 752, 142190. https://doi.org/10.1016/j.scitotenv.2020.142190
- Alongi, D. M. (2020) Carbon cycling in the world’s mangrove ecosystems revisited: Significance of non-steady state diagenesis and subsurface linkages between the forest floor and the coastal ocean. Forests 11, 977. https://doi.org/10.3390/f11090977
- Alongi, D. M. (2022) Lateral export and sources of subsurface dissolved carbon and alkalinity in mangroves: Revising the blue carbon budget. J. Mar. Sci. Eng. 10,1916. https://doi.org/10.3390/jmse10121916
- Alongi, D. M., Pfitzner, J., Trott, L. A., Tirendi, F., Dixon, P. and Klumpp, D. W. (2005) Rapid sediment accumulation and microbial mineralization in forests of the mangrove Kandelia candel in the Jiulongjiang Estuary, China. Estuar., Coast. Shelf Sci. 63, 605–618. https://doi.org/10.1016/J.ECSS.2005.01.004
- Atwood, T. B., Connolly, R. M., Almahasheer, H., Carnell, P. E., Duarte, C. M., Ewers Lewis, C. J., Irigoien, X., Kelleway, J. J., Lavery, P. S., Macreadie, P. I., Serrano, O., Sanders, C. J., Santos, I., Steven, A. D. L. and Lovelock, C. E. (2017) Global patterns in mangrove soil carbon stocks and losses. Nature Clim. Change 7, 523–528. https://doi.org/10.1038/nclimate3326
- Baloloy, A. B., Blanco, A. C., Sharma, S. and Nadaoka, K. (2021) Development of a rapid mangrove zonation mapping workflow using sentinel 2-derived indices and biophysical dataset. Front. Remote Sens. 2, 730238. https://doi.org/10.3389/frsen.2021.730238
- Borges, A. V., Djenidi, S., Lacroix, G., Théate, J., Delille, B. and Frankignoulle, M. (2003) Atmospheric CO2 flux from mangrove surrounding waters. Geophys. Res. Lett. 30, 12–15. https://doi.org/10.1029/2003GL017143
- Bouillon, S., Middelburg, J. J., Dehairs, F., Borges, A. V., Abril, G., Flindt, M. R., Ulomi, S. and Kristensen, E. (2007a) Importance of intertidal intertidal sediment processes and porewater exchange on the water column biogeochemistry in a pristine mangrove creek (Ras Dege, Tanzania). Biogeosciences 4, 311–322. https://doi.org/10.5194/bg-4-311-2007
- Bouillon, S., Dehairs, F., Velimirov, B., Abril, G. and Borges, A. V. (2007b) Dynamics of organic and inorganic carbon across contiguous mangrove and seagrass systems (Gazi Bay, Kenya). J. Geophys. Res. Biogeosci. 112, G02018. https://doi.org/10.1029/2006JG000325
- Bouillon, S., Borges, A. V., Castañeda-Moya, E., Diele, K., Dittmar, T., Duke, N. C., Kristensen, E., Lee, S. Y., Marchand, C., Middelburg, J. J., Rivera-Monroy, V. H., Smith, T. J., III and Twilley, R. R. (2008) Mangrove production and carbon sinks: A revision of global budget estimates. Global Biogeochem. Cycles 22, GB2013. https://doi.org/10.1029/2007gb003052
- Breithaupt, J. L., Smoak, J. M., Smith, T. J., Sanders, C. J. and Hoare, A. (2012) Organic carbon burial rates in mangrove sediments: Strengthening the global budget. Global Biogeochem. Cycles 26, GB3011. https://doi.org/10.1029/2012GB004375
- Cabral, A., Dittmar, T., Call, M., Scholten, J., de Rezende, C. E., Asp, N., Gledhill, M., Seidel, M. and Santos, I. R. (2021) Carbon and alkalinity outwelling across the groundwater-creek-shelf continuum off Amazonian mangroves. Limnol. Oceanogr. Lett. 6, 369–378. https://doi.org/10.1002/LOL2.10210
- Call, M., Maher, D. T., Santos, I. R., Ruiz-Halpern, S., Mangion, P., Sanders, C. J., Erler, D. V., Oakes, J. M., Rosentreter, J., Murray, R. and Eyre, B. D. (2015) Spatial and temporal variability of carbon dioxide and methane fluxes over semi-diurnal and spring-neap-spring timescales in a mangrove creek. Geochim. Cosmochim. Acta 150, 211–225. https://doi.org/10.1016/j.gca.2014.11.023
- Call, M., Santos, I. R., Dittmar, T., de Rezende, C. E., Asp, N. E. and Maher, D. T. (2019) High pore-water derived CO2 and CH4 emissions from a macro-tidal mangrove creek in the Amazon region. Geochim. Cosmochim. Acta 247, 106–120. https://doi.org/10.1016/j.gca.2018.12.029
- Chen, C. T. A., Liu, C. T. and Pai, S. C. (1995) Variations in oxygen, nutrient and carbonate fluxes of the Kuroshio Current. La Mer 33, 161–176.
- Chen, X., Santos, I. R., Call, M., Reithmaier, G. M. S., Maher, D., Holloway, C., Wadnerkar, P. D., Gómez-Álvarez, P., Sanders, C. J. and Li, L. (2021) The mangrove CO2 pump: Tidally driven pore-water exchange. Limnol. Oceanogr. 66, 1563–1577. https://doi.org/10.1002/lno.11704
- Chielle, R. S. A., Marins, R. V., Cavalcante, M. S. and Cotovicz, L. C., Jr. (2024) Seasonal and spatial variability of CO2 emissions in a large tropical mangrove-dominated delta. Limnol. Oceanogr. https://doi.org/10.1002/lno.12471
- Dickson, A. G., Sabine, C. L. and Christian, J. R. (eds.) (2007) Guide to Best Practices for Ocean CO2 Measurements. PICES Special Publication 3, 191 pp.
- Dittmar, T., Hertkorn, N., Kattner, G. and Lara, R. J. (2006) Mangroves, a major source of dissolved organic carbon to the oceans. Global Biogeochem. Cycles 20, GB1012. https://doi.org/10.1029/2005GB002570
- Dobashi, R. and Ho, D. T. (2023) Air–sea gas exchange in a seagrass ecosystem-results from a 3He/SF6 tracer release experiment. Biogeosciences 20, 1075–1087. https://bg.copernicus.org/articles/20/1075/2023/
- Donato, D. C., Kauffman, J. B., Murdiyarso, D., Kurnianto, S., Stidham, M. and Kanninen, M. (2011) Mangroves among the most carbon-rich forests in the tropics. Nature Geosci. 4, 293–297. https://doi.org/10.1038/ngeo1123
- Duarte, C. M., Middelburg, J. J. and Caraco, N. (2005) Major role of marine vegetation on the oceanic carbon cycle. Biogeosciences 2, 1–8. https://doi.org/10.5194/bg-2-1-2005
- Duarte, Carlos M., Losada, I. J., Hendriks, I. E., Mazarrasa, I. and Marbà, N. (2013) The role of coastal plant communities for climate change mitigation and adaptation. Nature Clim. Change 3, 961–968. https://doi.org/10.1038/nclimate1970
- Faber, P. A., Evrard, V., Woodland, R. J., Cartwright, I. C. and Cook, P. L. M. (2014) Pore-water exchange driven by tidal pumping causes alkalinity export in two intertidal inlets. Limnol. Oceanogr. 59, 1749–1763. https://doi.org/10.4319/LO.2014.59.5.1749
- Gregor, L. and Gruber, N. (2021) OceanSODA-ETHZ: A global gridded data set of the surface ocean carbonate system for seasonal to decadal studies of ocean acidification. Earth Syst. Sci. Data 13, 777–808. https://doi.org/10.5194/essd-13-777-2021
- Ho, D. T., Law, C. S., Smith, M. J., Schlosser, P., Harvey, M. and Hill, P. (2006) Measurements of air-sea gas exchange at high wind speeds in the Southern Ocean: Implications for global parameterizations. Geophys. Res. Lett. 33, L16611. https://doi.org/10.1029/2006GL026817
- Ho, D. T., Ferrón, S., Engel, V. C., Anderson, W. T., Swart, P. K., Price, R. M. and Barbero, L. (2017) Dissolved carbon biogeochemistry and export in mangrove-dominated rivers of the Florida Everglades. Biogeosciences 14, 2543–2559. https://doi.org/10.5194/bg-14-2543-2017
- Howard, J., Sutton-Grier, A., Herr, D., Kleypas, J., Landis, E., Mcleod, E., Pidgeon, E. and Simpson, S. (2017) Clarifying the role of coastal and marine systems in climate mitigation. Front. Ecol. Environ. 15, 42–50. https://doi.org/10.1002/fee.1451
- Humphreys, M. P., Lewis, E. R., Sharp, J. D. and Pierrot, D. (2022) PyCO2SYS v1.8: Marine carbonate system calculations in Python. Geosci. Model Dev. 15, 15–43. https://doi.org/10.5194/GMD-15-15-2022
- Jardine, S. L. and Siikamäki, J. V. (2014) A global predictive model of carbon in mangrove soils. Environ. Res. Lett. 9, 104013. https://doi.org/10.1088/1748-9326/9/10/104013
- Jennerjahn, T. C. and Ittekkot, V. (2002) Relevance of mangroves for the production and deposition of organic matter along tropical continental margins. Naturwissenschaften 89, 23–30. https://doi.org/10.1007/s00114-001-0283-x
- Jiang, L. Q., Cai, W. J. and Wang, Y. (2008) A comparative study of carbon dioxide degassing in river- and marine-dominated estuaries. Limnol. Oceanogr. 53, 2603–2615. https://doi.org/10.4319/lo.2008.53.6.2603
- Kayanne, H., Hata, H., Kudo, S., Yamano, H., Watanabe, A., Ikeda, Y., Nozaki, K., Kato, K., Negishi, A. and Saito, H. (2005) Seasonal and bleaching-induced changes in coral reef metabolism and CO2 flux. Global Biogeochem. Cycles 19, GB3015. https://doi.org/10.1029/2004GB002400
- Kida, M., Tanabe, M., Tomotsune, M., Yoshitake, S., Kinjo, K., Ohtsuka, T. and Fujitake, N. (2019) Changes in dissolved organic matter composition and dynamics in a subtropical mangrove river driven by rainfall. Estuar. Coast. Shelf Sci. 223, 6–17. https://doi.org/10.1016/j.ecss.2019.04.029
- Kristensen, E. (2007) Carbon balance in mangrove sediments: The driving processes and their controls. Greenhouse Gas and Carbon Balances in Mangrove Coastal Ecosystems (Tateda, Y., Upstill-Goddard, R., Goreau, T., Alongi, D., Nose, A., Kristensen, E. and Wattayakorn, G., eds.), 61–78, Maruzen Publishing.
- Kristensen, E., Bouillon, S., Dittmar, T. and Marchand, C. (2008) Organic carbon dynamics in mangrove ecosystems: A review. Aquat. Bot. 89, 201–219. https://doi.org/10.1016/j.aquabot.2007.12.005
- Krumins, V., Gehlen, M., Arndt, S., Van Cappellen, P. and Regnier, P. (2013) Dissolved inorganic carbon and alkalinity fluxes from coastal marine sediments: Model estimates for different shelf environments and sensitivity to global change. Biogeosciences 10, 371–398. https://bg.copernicus.org/articles/10/371/2013/
- Leopold, A., Marchand, C., Deborde, J., Chaduteau, C. and Allenbach, M. (2013) Influence of mangrove zonation on CO2 fluxes at the sediment-air interface (New Caledonia). Geoderma 202–203, 62–70. https://doi.org/10.1016/j.geoderma.2013.03.008
- Linto, N., Barnes, J., Ramachandran, R., Divia, J., Ramachandran, P. and Upstill-Goddard, R. C. (2014) Carbon dioxide and methane emissions from mangrove-associated waters of the Andaman Islands, Bay of Bengal. Estuaries Coast 37, 381–398. https://doi.org/10.1007/s12237-013-9674-4
- Lønborg, C., Carreira, C., Abril, G., Agustí, S., Amaral, V., Andersson, A., Arístegui, J., Bhadury, P., Bernardi Bif, M., Borges, A. V., Bouillon, S., Ll. Calleja, M., Cotovicz Jr., L. C., Cozzi, S., Doval, M., Duarte, C. M., Eyre, B., Fichot, C. G., García-Martín, E. E., Garzon-Garcia, A., Giani, M., Gonçalves-Araujo, R., Gruber, R., A. Hansell, D., Hashihama, F., He, D., Holding, J. M., Hunter, W. R., Ibánhez, J. S. P., Ibello, V., Jiang, S., Kim, G., Klun, K., Kowalczuk, P., Kubo, A., Weng Lee, C., Lopes, C. B., Maggioni, F., Magni, P., Marrase, C., Martin, P., McCallister, S. L., McCallum, R., Medeiros, P. M., Morán, X. A. G., Muller-Karger, F., Myers-Pigg, A., Norli, M., Oakes, J. M., Osterholz, H., Park, H., Lund Paulsen, M., Rosentreter, J. A., Rueda-Roa, D., Santinelli, C., Shen, Y., Teira, E., Tinta, T., Uher, G., Wakita, M., Ward, N., Watanabe, K., Xin, Y., Yamashita, Y., Yang, L., Yeo, J., Yuan, H., Zheng, Q. and Álvarez-Salgado, X. A. (2023) A global database of dissolved organic matter (DOM) measurements in coastal waters (CoastDOM v1), Earth Syst. Sci. Data Discuss. [preprint]. https://doi.org/10.5194/essd-2023-348
- Maher, D. T., Santos, I. R., Golsby-Smith, L., Gleeson, J. and Eyre, B. D. (2013) Groundwater-derived dissolved inorganic and organic carbon exports from a mangrove tidal creek: The missing mangrove carbon sink? Limnol. Oceanogr. 58, 475–488. https://doi.org/10.4319/lo.2013.58.2.0475
- Maher, D. T., Call, M., Santos, I. R. and Sanders, C. J. (2018) Beyond burial: Lateral exchange is a significant atmospheric carbon sink in mangrove forests. Biol. Lett. 14. https://doi.org/10.1098/rsbl.2018.0200
- Mook, W. G. (1991) Stable carbon isotopes in rivers and estuaries. SCOPE 42. Biogeochemistry of Major World Rivers (Degens, E. T., Kempe, S., Richey, J., eds.), 245–264, Wiley.
- Nakamura, W., Wang, K., Ono, K., Endo, T., Watanabe, S., Mori, T., Furukawa, K., Fujimoto, K. and Sasaki, J. (2023) A tidal flat adjacent to a fringe mangrove forest mitigates pCO2 increases and enhances lateral export of dissolved carbon. J. Mar. Sci. Eng. 11, 2356. https://doi.org/10.3390/jmse11122356
- Nellemann, C., Corcoran, E., Duarte, C. M., Valdrés, L., Young, C. D., Fonseca, L. and Grimsditch, G. (2009) Blue Carbon: The Role of Healthy Oceans in Binding Carbon. UN Environment, GRID-Arendal.
- Ohtsuka, T., Tomotsune, M., Suchewaboripont, V., Iimura, Y., Kida, M., Yoshitake, S., Kondo, M. and Kinjo, K. (2019) Stand dynamics and aboveground net primary productivity of a mature subtropical mangrove forest on Ishigaki Island, south-western Japan. Reg. Stud. Mar. Sci. 27, 100516. https://doi.org/10.1016/j.rsma.2019.100516
- Ohtsuka, T., Onishi, T., Yoshitake, S., Tomotsune, M., Kida, M., Iimura, Y., Kondo, M., Suchewaboripont, V., Cao, R., Kinjo, K. and Fujitake, N. (2020) Lateral export of dissolved inorganic and organic carbon from a small mangrove estuary with tidal fluctuation. Forests 11, 1041. https://doi.org/10.3390/F11101041
- Reithmaier, G. M. S., Johnston, S. G., Junginger, T., Goddard, M. M., Sanders, C. J., Hutley, L. B., Ho, D. T. and Maher, D. T. (2021a) Alkalinity production coupled to pyrite formation represents an unaccounted blue carbon sink. Global Biogeochem. Cycles 35, e2020GB006785. https://doi.org/10.1029/2020gb006785
- Reithmaier, G. M. S., Chen, X., Santos, I. R., Drexl, M. J., Holloway, C., Call, M., Álvarez, P. G., Euler, S. and Maher, D. T. (2021b) Rainfall drives rapid shifts in carbon and nutrient source-sink dynamics of an urbanised, mangrove-fringed estuary. Estuar. Coast. Shelf Sci. 249, 107064. https://doi.org/10.1016/j.ecss.2020.107064
- Reithmaier, G. M. S., Cabral, A., Akhand, A., Bogard, M. J., Borges, A. V., Bouillon, S., Burdige, D. J., Call, M., Chen, N., Chen, X., Cotovicz, L. C., Jr, Eagle, M. J., Kristensen, E., Kroeger, K. D., Lu, Z., Maher, D. T., Pérez-Lloréns, J. L., Ray, R., Taillardat, P., Tamborski, J. J., Upstill-Goddard, R. C., Wang, F., Wang, Z. A., Xiao, K., Yau, Y. Y. Y., Santos, I. R. (2023) Carbonate chemistry and carbon sequestration driven by inorganic carbon outwelling from mangroves and saltmarshes. Nat. Commun. 14, 8196. https://doi.org/10.1038/s41467-023-44037-w
- Rosentreter, J. A., Maher, D. T., Ho, D. T., Call, M., Barr, J. G. and Eyre, B. D. (2017) Spatial and temporal variability of CO2 and CH4 gas transfer velocities and quantification of the CH4 microbubble flux in mangrove dominated estuaries. Limnol. Oceanogr. 62, 561–578. https://doi.org/10.1002/lno.10444
- Rosentreter, Judith A., Maher, D. T., Erler, D. V., Murray, R. and Eyre, B. D. (2018) Seasonal and temporal CO2 dynamics in three tropical mangrove creeks—A revision of global mangrove CO2 emissions. Geochim. Cosmochim. Acta 222, 729–745. https://doi.org/10.1016/j.gca.2017.11.026
- Saderne, V., Fusi, M., Thomson, T., Dunne, A., Mahmud, F., Roth, F., Carvalho, S. and Duarte, C. M. (2021) Total alkalinity production in a mangrove ecosystem reveals an overlooked Blue Carbon component. Limnol. Oceanogr. Lett. 6, 61–67. https://doi.org/10.1002/lol2.10170
- Saito, H., Tamura, N., Kitano, H., Mito, A., Takahashi, C., Suzuki, A. and Kayanne, H. (1995) A compact seawater pCO2 measurement system with membrane equilibrator and nondispersive infrared gas analyzer. Deep Sea Res. Part I: Oceanogr. Res. Pap. 42, 2025–2033. https://doi.org/10.1016/0967-0637(95)00090-9
- Santos, I. R., Maher, D. T., Larkin, R., Webb, J. R. and Sanders, C. J. (2019) Carbon outwelling and outgassing vs. burial in an estuarine tidal creek surrounded by mangrove and saltmarsh wetlands. Limnol. Oceanogr. 64, 996–1013. https://doi.org/10.1002/LNO.11090
- Shiau, Y. J. and Chiu, C. Y. (2020) Biogeochemical processes of C and N in the soil of mangrove forest ecosystems. Forests 11, 492. https://doi.org/10.3390/F11050492
- Sippo, J. Z., Maher, D. T., Tait, D. R., Holloway, C. and Santos, I. R. (2016) Are mangroves drivers or buffers of coastal acidification? Insights from alkalinity and dissolved inorganic carbon export estimates across a latitudinal transect. Global Biogeochem. Cycles 30, 753–766. https://doi.org/10.1002/2015GB005324
- Taillardat, P., Ziegler, A. D., Friess, D. A., Widory, D., Truong Van, V., David, F., Thành-Nho, N. and Marchand, C. (2018) Carbon dynamics and inconstant porewater input in a mangrove tidal creek over contrasting seasons and tidal amplitudes. Geochim. Cosmochim. Acta 237, 32–48. https://doi.org/10.1016/j.gca.2018.06.012
- Tateda, Y., Nhan, D. D., Wattayakorn, G. and Toriumi, H. (2005) Preliminary evaluation of organic carbon sedimentation rates in Asian mangrove coastal ecosystems estimated by 210Pb chronology. Radioprotection 40, S527–S532. https://doi.org/10.1051/radiopro:2005s1-077
- Tokoro, T., Kayanne, H., Watanabe, A., Nadaoka, K., Tamura, H., Nozaki, K., Kato, K. and Negishi, A. (2008) High gas-transfer velocity in coastal regions with high energy-dissipation rates. J. Geophys. Res. Oceans 113, C11006. https://doi.org/10.1029/2007JC004528
- Tokoro, T., Hosokawa, S., Miyoshi, E., Tada, K., Watanabe, K., Montani, S., Kayanne, H. and Kuwae, T. (2014) Net uptake of atmospheric CO2 by coastal submerged aquatic vegetation. Global Change Biology 20, 1873–1884. https://doi.org/10.1111/gcb.12543
- Tomotsune, M., Arai, H., Yoshitake, S., Kida, M., Fujitake, N., Kinjo, K. and Ohtsuka, T. (2020) Effect of crab burrows on CO2 flux from the sediment surface to the atmosphere in a subtropical mangrove forest on Ishigaki Island, Southwestern Japan. Estuaries Coast 43, 102–110. https://doi.org/10.1007/s12237-019-00667-2
- Tomotsune, M., Yoshitake, S., Iimura, Y., Kida, M., Fujitake, N., Koizumi, H. and Ohtsuka, T. (2018) Effects of soil temperature and tidal condition on variation in carbon dioxide flux from soil sediment in a subtropical mangrove forest. J. Tropical Ecology 34, 268–275. https://doi.org/10.1017/S026646741800024X
- Volta, C., Ho, D. T., Maher, D. T., Wanninkhof, R., Del Castillo, C., Del Castillo, C. and Dulai, H. (2020) Seasonal variations in dissolved carbon inventory and fluxes in a mangrove-dominated estuary. Global Biogeochem. Cycles 34, e2019GB006515. https://doi.org/10.1029/2019GB006515
- Wanninkhof, R. (2014) Relationship between wind speed and gas exchange over the ocean revisited. Limnol. Oceanogr., Methods 12, 351–362. https://doi.org/10.4319/lom.2014.12.351
- Weiss, R. F. (1974) Carbon dioxide in water and seawater: The solubility of a non-ideal gas. Mar. Chem. 2, 203–215. https://doi.org/10.1016/0304-4203(74)90015-2
- Zablocki, J. A., Andersson, A. J. and Bates, N. R. (2011) Diel aquatic CO2 system dynamics of a Bermudian mangrove environment. Aquat. Geochem. 17, 841–859. https://doi.org/10.1007/s10498-011-9142-3

