ABSTRACT
Cold acclimation is one of the important factors in temperature adaptation for insects needing to make rapid adjustment to the seasonal temperature changes in their living environment. In a fruit fly species, Drosophila albomicans, which has a tropical origin and currently has a wide geographic distribution extended into Asian temperate regions, cold tolerance in terms of survival time at 1℃ of adult flies reared at 25℃ was substantially improved by a cold acclimation at 20℃ for several days. Examining 29 isofemale lines from widely distributed natural populations, we observed a substantial variation in their acclimation response. However, the acclimation response was not necessarily stronger in the strains from the recently colonized temperate regions. A significantly stronger acclimation response was detected in male flies of the temperate strains when compared to those of the tropical strains. D. albomicans also showed stronger cold tolerance compared to its closely related species belonging to the D. nasuta subgroup. Among these strains, we detected a strong positive correlation between the cold tolerance change and the metabolic rate change upon the cold acclimation, suggesting their strong physiological association regulated by common genetic factors, which may have been the target of natural selection for the temperature adaptation. The response to deacclimation and reacclimation suggested that a systematic change in gene expressions is the main molecular mechanism for the cold acclimation to have effects on the cold tolerance and metabolic rate changes.
INTRODUCTION
Cold tolerance is a critical trait in insects whose activity and survival are directly affected by changes in their environmental temperature (Lee and Denlinger, 2010). In Drosophila, species distributed in relatively colder locations usually show higher cold tolerance compared to those distributed in relatively warmer locations. This tendency is consistent with the concept of environmental adaptation and is often observed in geographic populations within a single species (Hoffmann et al., 2003 for review). These facts clearly indicate that cold tolerance is one of the key factors affecting fitness of insects, enabling them to withstand conditions in their environment.
To cushion the impact of seasonal temperature fluctuation, the capacity for adjusting physiological condition to the temperature changes is thought to be an important part of cold tolerance. Many insects respond to an exposure to a cooler temperature than usual for several days and enhance their cold tolerance in preparation for the anticipated subsequent temperature changes. Such phenomenon is called acclimation and is observed as an improved survival rate in a cold temperature (say ~0℃) after experiencing a mildly lower temperature than the usual living temperature (Salt, 1961). Rako and Hoffmann (2006) classified this type of plastic response into three categories: “rearing acclimation” as a continuous response to a lower temperature than the optimal living temperature during the course of development (e.g., Ohtsu et al., 1999), “cold acclimation” as a response to a moderately low temperature for a few days to several weeks (e.g., Goto, 2000; Bubliy et al., 2002) and “rapid cold hardening,” as a rapid response to a sub-lethal temperature for a very short time from a few minutes to hours (e.g., Czajka and Lee, 1990). Since the seasonal temperature fluctuation is relatively mild in the temperate regions, the cold acclimation is likely to be an effective strategy for insects like Drosophila to adapt to temperature changes in their habitats.
Changes in lipid composition of cell membrane have been identified as a molecular mechanism underlying the rearing acclimation and the rapid cold hardening in insects (Ohtsu et al., 1998; Lee et al., 2006; Overgaard et al., 2008), whereas changes in metabolic rate are thought to be a mechanism for the cold acclimation. For instance, Berrigan (1997) showed that D. melanogaster flies reared at 18℃ had a higher respiration rate (metabolic rate) at 15℃ compared to the flies reared at 25℃ or 29℃. Terblanche et al. (2005) showed that metabolic rate of a tsetse fly species, Glossina morsitans morsitans, reared at 24℃ was increased after experiencing 19℃ for 10 days. Using its closely related species, G. pallidipes, Terblanche and Chown (2006) measured the critical thermal minima (CTmin) defined as the temperature, at which loss of coordinated muscle function is observed in a gradually decreasing temperature condition (–0.25℃/min), and reported that the flies acclimatized at 21℃ had a lower CTmin with a higher metabolic rate compared to the control flies reared at 25℃. These studies suggested that there is a connection between cold acclimation and metabolic rate.
In general, metabolic rate decreases as the ambient temperature decreases in ectothermic animals including Drosophila (Fleming and Miquel, 1983; Berrigan and Partridget, 1997; Oikawa et al., 2006), and this tendency is regarded as a response to temperature changes (e.g., Gillooly et al., 2001). However, in the studies with Drosophila and the tsetse fly species mentioned above (Berrigan, 1997; Terblanche et al., 2005; Terblanche and Chown, 2006), significant effects of the rearing temperature on the response to temperature changes were also suggested. The connection between cold tolerance and metabolic rate was also suggested in studies of D. melanogaster mutants. A mutant of dystroglycan gene, atsugari, which causes an increase in mitochondrial oxidative metabolic rate, showed a higher cold tolerance (Takeuchi et al., 2009). Similarly, a dopamine transporter-defective mutant, fumin, showed a higher metabolic rate and a higher cold tolerance (Ueno et al., 2012). These observations suggest that the cold tolerance of flies is improved by the increased metabolic rate.
Another approach to examine if the elevation of metabolic rate is a major response to the cold acclimation would be to analyze intraspecific variations of cold tolerance and of the metabolic rate and see if they have a correlation. It is also intriguing to see if they parallel each other in response to the cold acclimation. For this purpose, D. albomicans belonging to the D. nasuta subgroup is particularly suitable, because this species had a wide geographic distribution in Southeast Asia until late 1980’s (Kitagawa et al., 1982) and has expanded the distribution to the Japanese archipelago in the temperate regions recently (Mikasa, 1991; Chen et al., 1994; Fujino et al., 2006; Hoshina et al., 2007), whereas other closely related species of the D. nasuta subgroup have stayed in the tropics or subtropics. This suggests the possibility that D. albomicans has a wider variation in cold tolerance to be able to distribute from the tropics to the temperate regions. Therefore, it is an intriguing question to ask whether the distribution expansion of D. albomicans has been accompanied by an increase in cold tolerance with an increase in metabolic rate upon cold acclimation.
In this study, we first investigate the basic thermal physiology, i.e. cold tolerance and acclimation response, of D. albomicans in comparison to that of its closely related species in the D. nasuta subgroup and also to that of D. melanogaster, a well-studied canonical model species. Then, to explore the possibility that the metabolic rate change caused by the cold acclimation is responsible for the higher cold tolerance in Drosophila, we analyze the effects of cold acclimation on the cold tolerance and on the metabolic rate using geographic populations of D. albomicans. We examined whether there is a strong association between the cold tolerance and the metabolic rate changes in response to the cold acclimation. This study could be a step forward in understanding molecular mechanisms of evolutionary adaptation to thermal environment by organisms.
MATERIALS AND METHODS
Fly strains
Twenty-nine strains of D. albomicans were originally collected from 23 localities in 1979–1992 by Kitagawa et al. (1982), each of which was established from a single inseminated female as an isofemale line and has been maintained by sib-mating in a small mass culture with the standard cornmeal medium (containing 90 g cornmeal, 100 g glucose, 40 g dead beer-yeast and 8 g agar in 1 litter water) at 20℃ under constant light condition before use. The abbreviation of the strain names and their collection sites and years are described in Supplementary Table S1. Its closely related species belonging to the D. nasuta subgroup, i.e., 13 strains of D. nasuta, 4 strains each of D. kepulauana, D. kohkoa, D. sulfurigaster bilimbata and D. pallidifrons, and 3 strains each of D. s. albostrigata and D. pulaua, were also used (Supplementary Table S2). In addition, a wild type strain (Canton S) of D. melanogaster was maintained at 25℃ in otherwise the same condition as the D. albomicans strains.
Categorization of geographic populations
To investigate the cold tolerance of D. albomicans with regard to the temperature condition of their habitat, we categorized 23 collection sites of the D. albomicans strains into 3 temperature zones according to the lowest monthly mean temperature and the lowest monthly mean of daily minimum temperature obtained from World Meteorological Organization, Central Weather Bureau, or Japan Meteorological Agency dependent on the location of each collection site. The detailed information on the meteorological data is described in Supplementary Tables S1 and S2.
The lowest monthly mean temperature and the lowest monthly mean of daily minimum temperature from all the collection sites were plotted on a scatter diagram (Fig. 1). The two measurements as indicators of winter severity showed a high correlation with each other (Spearman’s r = 0.98, P < 10–15). However, since the latter on the x-axis showed a discontinuous distribution, the collection sites were categorized into 3 temperature zones separated by the intervals indicated by the dotted lines. As the result, the criteria for the 3 temperature zones became as follows. Temperature Zone 1: the lowest monthly mean of daily minimum temperature –5–5℃, Temperature Zone 2: the lowest monthly mean of daily minimum temperature 5–20℃, and Temperature Zone 3: the lowest monthly mean of daily minimum temperature 20–25℃. Temperature Zone 1 consists of the newly colonized populations in Japan and China since 1980s (Supplementary Table S1). It should be noted that the populations in Temperature Zone 3 are unlikely to regularly experience temperature below 20℃ even in the coldest month of a year.

To control for epigenetic effects, fly strains were cultured at 25℃ on the standard corn-meal medium for at least 3 consecutive generations before all the experiments. Female flies were separated from males within 48 hours after eclosion without using anesthesia. For the cold acclimation, 20–60 flies were put in a vial with fresh medium and kept at 15℃ or 20℃ for 7 days (designated as “25/15” or “25/20”, respectively). The non-acclimatized control flies were kept in 25℃ for the same period (designated as “25/25”). Flies of WL1 and Canton S strains were acclimatized at both 15℃ and 20℃, and flies of other 28 D. albomicans strains were acclimatized at 20℃.
Experiments for deacclimation were performed under 3 different temperature schemes. (1) Flies reared at 20℃ for at least 3 consecutive generations were kept at 25℃ for 7 days (designated as “20/25”), whereas the control flies were kept at 20℃ for the same period (designated as “20/20”). For this condition, we used 8 D. albomicans strains: X108, WL1, IOM2, NG3, YAK1, TAK2, KKU202 and KKU204. (2) Flies reared at 25℃ were exposed to 20℃ for 3 days and then placed back into 25℃ for 4 days (designated as “25/20/25”). The control flies reared at 25℃ were exposed to 20℃ for 3 days and subsequently another 4 days. WL1 and X108 strains were used for this condition. (3) Flies reared at 20℃ were exposed to 25℃ for 3 days and then placed back into 20℃ for 4 days (designated as “20/25/20”). The control flies reared at 20℃ were exposed to 25℃ for 3 days and subsequently another 4 days. WL1 and X108 strains were used for this condition.
Measurement of cold tolerance
To examine the cold tolerance of flies, we measured the survival rate of flies after exposed to 1℃ for various time lengths and drew the survival curve against the exposure time. We used 29 strains of D. albomicans and Canton S strain of D. melanogaster for this purpose. For each strain, 20 individuals were transferred into a glass vial (15 mm diameter and 105 mm long) containing 2 ml of a sugar agar medium [10% sucrose; 1% agar; 1% butyl parahydroxybenzoate] and kept in an incubator, in which air temperature was regulated to be 1 ± 0.5℃ for the period of 6, 8, 10, 12, 14, 16, 18, 20, 22, 24, 36 or 48 hours. To measure the actual air temperature in the incubator during the experiment, we used temperature data loggers (Thermochron G type) and collected temperature data. After each period of 1℃ exposure, the air temperature was programed to become 20℃ in approximately 25 minutes. Then, we counted the number of survivors after 48 hours, following Rako and Hoffmann (2006). If a fly stood on its legs and walk, we identified the fly as a survivor. For each time length and sex, the survival rate measurement was independently replicated 5 times. The number of time points varied among experiments as the survival rate varied among strains. The time point at which 50% of flies died (50% lethal time: LT50) or 25% flies died (25% lethal time: LT25) was estimated by the logistic regression analysis implemented in R version 2.13.0 software (R Core Team, 2008).
The cold tolerance was compared between D. albomicans and its closely related species within the D. nasuta subgroup in terms of the survival rate after 16 hour exposure to 1℃. The survival rate was examined for each sex reared at 25℃ with or without the cold acclimation for 36 strains from 7 species in total (Supplementary Table S2). We used 20 individuals for each experiment which was replicated 5 times.
Measurement of metabolic rate
Following Hulbert et al. (2004), we measured metabolic rate in terms of the consumption of O2 of flies at 7 days after the eclosion for 10 strains: X108, SWB101, KM3, HNZ12, WL1, NG3, KMT21, KKU202, TAK502 and SMT503. We assembled a respiration chamber connecting a plastic syringe of 1 ml size containing a small amount of CO2 absorber (Soda lime, Wako) to a 50 μl micropipette via a plastic adaptor and a short rubber tube. For this experiment, only male flies were used, because they have smaller body size variation irrespective of their reproductive state. We placed 20 flies in the syringe body and inserted the plunger to close the respiration chamber. We then placed the respiration chamber on a flat plate in a water bath filled with ice-cold water for at least 1 hour to equilibrate the flies’ respiration rate and put 4 μl of ink into the micropipette at the tip. Finally, we measured the movement of the ink corresponding to the oxygen consumption at every 1 hour over the next 3 hours. The measurements for the acclimatized flies and for the control flies were conducted simultaneously in the same water bath with an empty chamber to control unknown effects from ambient temperature, pressure, etc. Each set of the measurement were replicated 30 times independently to obtain the average and the variance.
The metabolic rate at 20℃ was also measured for the acclimatized flies and the control flies of WL1 and X108 strains. In this case, the oxygen consumption was measured at every 30 minutes over 3 to 4 hours after the equilibration for 1 hour. The measurement was replicated 30 times. An empty chamber was also prepared for each replicate as the control.
RESULTS
Cold tolerance and cold acclimation response of Drosophila
The survival rate curves obtained from male and female flies with the 7 day cold acclimation at 15℃ or 20℃ are shown in Fig. 2, A and B for D. albomicans (WL1) and Fig. 2, C and D for D. melanogaster (Canton S). They reveal substantial variations in the cold tolerance and the response to the cold acclimation between males and females within the same species and between the species. The overall cold tolerance of D. melanogaster was substantially higher than that of D. albomicans regardless of the fact that the flies were acclimatized or not. Another distinct between-species difference was in the acclimation response to different temperatures. For D. albomicans, the acclimation at 15℃ made almost the same (males) or only slightly better (females) effect compared to the acclimation at 20℃ (Fig. 2, A and B), whereas the flies acclimatized at 15℃ had a higher survival rate than those acclimatized at 20℃ in both sexes in D. melanogaster (Fig. 2, C and D). This result suggests that the effective temperature for the cold acclimation is different between D. albomicans and D. melanogaster: 20℃ is sufficient to induce a full acclimation response in D. albomicans whereas lower temperature is more effective in D. melanogaster.

The effective time length of the cold acclimation for D. albomicans was measured by the survival rate at 1℃ for 14 hours (X108 and YAK) or 16 hours (WL1 and KKU204) after various time lengths of cold acclimation at 20℃. Although the response to the different time lengths of cold acclimation varied among the strains, its maximum was reached within 4–5 days in all the strains (Supplementary Fig. S1). Based on this result, we determined the acclimation condition to be at 20℃ for 7 days throughout the experiments in order to induce the full acclimation response. ANOVA showed that the survival time at 1℃ for acclimatized flies was significantly longer than that for non-acclimatized flies and that the survival time of males was significantly longer than that of females regardless of whether the flies were acclimatized or not (Supplementary Table S3).
Geographic variation of cold tolerance in D. albomicans and its closely related species
To examine whether adaptation to the cooler climate in the temperate regions was involved in the distribution expansion of D. albomicans, we investigated the variation of cold tolerance among the geographic populations. We compared the 50% lethal time (LT50) at 1℃ among D. albomicans strains from different temperature zones (Fig. 3, A and B). The expected adaptation scenario that the cold tolerance is higher in the regions with severe winter was observed but the magnitude was rather small. A marginally significant difference among the zones was detected in non-acclimatized male flies by one-way ANOVA (F2,26 = 4.03, P = 0.03), whereas the difference was not significant in female flies (F2,26 = 1.50, P = 0.24) (Fig. 3, A and B). The significant difference in the male flies was attributed to the difference between Temperature Zones 1 and 3 by Tukey’s HSD test (P < 0.05) (Fig. 3A).

The responses to the cold acclimation by D. albomicans strains from different temperature zones were also compared. We used the 25% lethal time (LT25) rather than LT50 to compare the cold tolerance after cold acclimation at 20℃, because 4 out of 28 strains showed survival rates higher than 50% at the 24-hour point when the experiment was terminated (Supplementary Table S4). Strains from colder locations tend to have a higher tolerance to cold temperature upon the cold acclimation, although the tendency was not strong. Again, the difference was detected only in male flies by one-way ANOVA (Fig. 3C, F2,26 = 3.31, P = 0.05) and the significant difference was detected between Temperature Zones 1 and 3 (P < 0.05 by Tukey’s HSD test). The difference was not significant in female flies (Fig. 3D, F2,26 = 2.67, P = 0.09).
The cold tolerance was also compared between D. albomicans and 7 its closely related species mostly distributed in the tropics and subtropics (Supplementary Table S2) in terms of the survival rate after incubation at 1℃ for 16 hours. The D. albomicans strains from Zones 1 and 2 showed the highest cold tolerance both in the acclimatized (“25/20”) and the non-acclimatized (“25/25”) flies of both sexes (Fig. 4). The cold tolerance of the D. albomicans strains from Zone 3 was comparable to that of the closely related species in both acclimatized and non-acclimatized flies.
Effect of cold acclimation on metabolic rate in D. albomicans
To investigate the effect of the cold acclimation on metabolism of flies, the metabolic rate was measured in terms of oxygen consumption in ice-cold water (ca. 0℃) for 10 D. albomicans strains (Table 1). A marginally significant increase in the metabolic rate upon the cold acclimation was observed in 8 of the 10 strains (P < 0.05 in the sign test), suggesting that the metabolic rate was affected by the cold acclimation to some extent. When the metabolic rate was measured at 20℃ for WL1 and X108 strains as the representatives showing respectively the maximum and minimum acclimation responses in the cold tolerance at 0℃, they also showed a large and small acclimation response, respectively (Supplementary Fig. S2). In this case, however, since the flies were not immobilized in such warm temperature, the resting state metabolic rate was unable to be obtained separately from the active state metabolic rate. Nevertheless, the metabolic rate of the acclimatized flies was higher than that of the control flies with a statistical significance in WL1 (Supplementary Fig. S2, t = 2.38, df = 58, P < 0.05). By contrast, the difference was negligible in X108 (Supplementary Fig. S2, t = 1.57, df = 58, P > 0.10).
Table 1. The 50% lethal time (LT50) and metabolic rate measurements for 10
D. albomicans strains without or with cold acclimation
| Strain |
LT50 (hours) |
Metabolic rate (μl/mg.hour) ± S.E. |
| male |
female |
male |
| 25/25 |
25/20 |
25/25 |
25/20 |
25/25 |
25/20 |
| X108 |
10.66 |
12.29 |
9.08 |
10.56 |
0.171 (± 0.03) |
0.145 (± 0.02) |
| SWB101 |
9.81 |
17.57 |
6.22 |
13.73 |
0.170 (± 0.02) |
0.185 (± 0.03) |
| KM3 |
11.67 |
20.21 |
8.36 |
20.49 |
0.124 (± 0.01) |
0.156 (± 0.01) |
| HNZ12 |
13.52 |
20.18 |
10.73 |
16.72 |
0.146 (± 0.02) |
0.141 (± 0.03) |
| WL1 |
7.86 |
23.34 |
5.33 |
17.98 |
0.162 (± 0.02) |
0.221 (± 0.02) |
| NG3 |
15.63 |
24.55 |
13.38 |
22.20 |
0.129 (± 0.02) |
0.148 (± 0.02) |
| KMT21 |
9.68 |
18.70 |
10.41 |
18.48 |
0.159 (± 0.01) |
0.191 (± 0.02) |
| KKU202 |
11.41 |
20.74 |
10.60 |
20.66 |
0.135 (± 0.01) |
0.183 (± 0.01) |
| TAK502 |
8.52 |
19.17 |
6.58 |
15.01 |
0.166 (± 0.01) |
0.201 (± 0.01) |
| SMT503 |
15.52 |
19.27 |
10.16 |
19.83 |
0.180 (± 0.02) |
0.159 (± 0.01) |
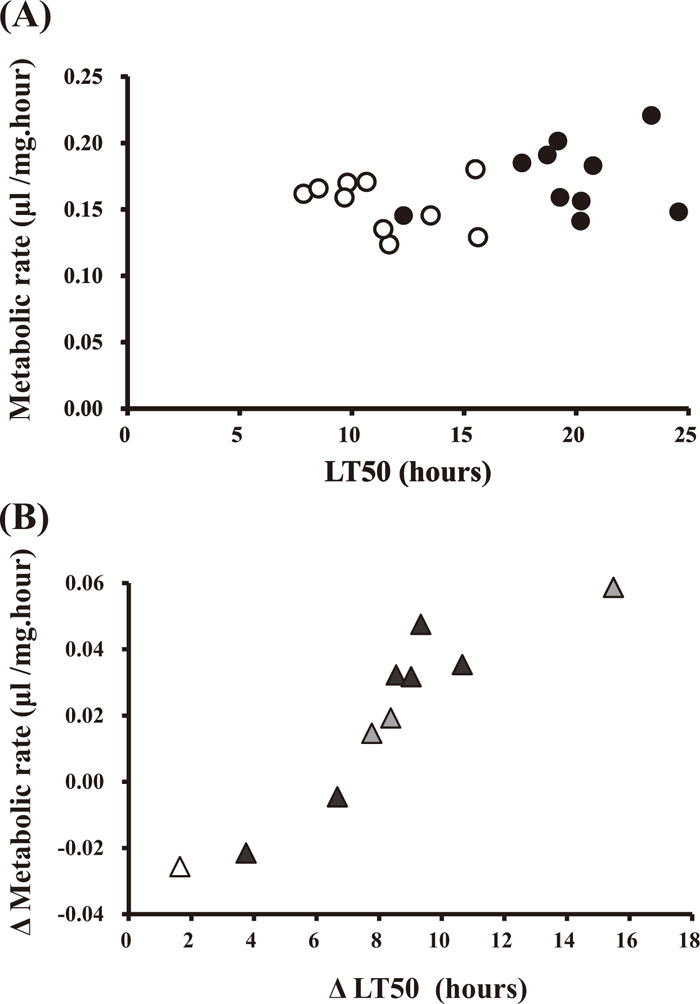
If the metabolic rate is closely associated with the cold tolerance, it is expected that LT50 becomes greater as the metabolic rate increases. However, as shown in Fig. 5A, there was no clear correlation between LT50 and the metabolic rate either for the acclimatized flies (Spearman’s r = 0.24, P > 0.1) or for the non-acclimatized control flies (Spearman’s r = 0.28, P > 0.1). However, Fig. 5B showed a significant positive correlation between the change in the cold tolerance and the change in the metabolic rate upon the cold acclimation (Spearman’s r = 0.93, P < 0.001). These results suggest that the metabolic rate may not be a major factor of determining the cold tolerance per se, although they have a shared physiological background affected by the cold acclimation.
To examine the plasticity of the acclimatized physiological state, we performed the deacclimation experiments. To examine the effect of deacclimation on the cold tolerance, we first used the flies reared at 20℃ and then exposed to 25℃ for 7 days. The pairwise t-test showed that the LT50 values from the deacclimatized flies were significantly lower than those from the control acclimatized flies in both males (t = 7.65, df = 7, P < 0.01) and females (t = 3.32, df = 7, P < 0.05) (see Table 2). This suggests that the increase in the temperature from 20 to 25℃ causes a relaxation of the effect of the cold acclimation. The largest reduction in LT50 by the deacclimation was observed in WL1, one of the strains that showed the highest response to the cold acclimation (Table 1; Supplementary Table S4). The effect of the deacclimation is consistent when flies were reared at 25℃ and then acclimatized at 20℃ (Table 3). Table 4 shows that the reduction in the metabolic rate by the deacclimation was highly significant in WL1 (0.194 vs. 0.131, t = 3.65, df = 58, P < 0.001) and in X108 (0.143 vs. 0.119, t = 2.85, df = 58, P < 0.01). When flies were reared at 25℃ and acclimatized at 20℃, the reduction by the subsequent deacclimation was also highly significant in WL1 (0.221 vs. 0.158, t = 4.74, df = 58, P < 0.001) but not in X108 (0.145 vs. 0.165, t = 1.25, df = 58, P > 0.20).
Table 2. The 50% lethal time (LT50) for 8
D. albomicans strains without or with deacclimation
| Strain | LT50 - Half Lethal Time (hours) |
|---|
| malea | femaleb |
|---|
| 20/20 | 20/25 | 20/20 | 20/25 |
|---|
| X108 | 17.49 | 13.55 | 15.24 | 9.49 |
| WL1 | > 24.00c | 10.47 | 22.13 | 9.45 |
| IOM2 | > 24.00c | 15.52 | 20.69 | 12.64 |
| NG3 | > 24.00c | 20.13 | > 24.00c | 15.14 |
| YAK1 | 23.60 | 22.73 | 22.04 | 15.36 |
| TAK2 | 20.14 | 16.50 | 15.56 | 10.87 |
| KKU202 | > 24.00c | 19.64 | > 24.00c | 17.65 |
| KKU204 | 19.73 | 18.62 | 17.70 | 13.13 |
a Pairwise
t test shows a significant difference between 20/20 and 20/25 (
t = 7.65,
df = 7,
P < 0.01).
b Pairwise
t test shows a significant difference between 20/20 and 20/25 (
t = 3.32,
df = 7,
P < 0.05).
c Survival rate larger than 50% at the 24 hour time point.
Table 3. The 50% lethal time (LT50) for two
D. albomicans strains with deacclimation or reacclimation
| Strain | | Deacclimation | Reacclimation |
|---|
| 25/20/20a | 25/20/25 | 20/25/25b | 20/25/20 |
|---|
| WL1 | male | 23.34 | 11.28 | 10.47 | > 24.00c |
| female | 17.98 | 5.93 | 9.45 | 20.08 |
| X108 | male | 12.29 | 8.58 | 11.21 | 12.22 |
| female | 10.56 | 6.54 | 8.91 | 9.70 |
c Survival rate larger than 50% at the 24 hour time point.
Table 4. Metabolic rate (mean ± S.E.) of two
D. albomicans strains experiencing various temperature conditions
| Strain | 25/25/25a | 25/20/20b | 25/20/25 | 20/20/20 | 20/25/25 | 20/25/20 |
|---|
| WL1 | 0.162 (± 0.02) | 0.221 (± 0.02) | 0.158 (± 0.03) | 0.194 (± 0.03) | 0.131 (± 0.01) | 0.185 (± 0.01) |
| X108 | 0.171 (± 0.03) | 0.145 (± 0.02) | 0.165 (± 0.03) | 0.143 (± 0.01) | 0.119 (± 0.01) | 0.123 (± 0.01) |
We further used a reacclimation scheme, 20/25/20 (reared at 20℃, deacclimatized at 25℃ and reacclimatized at 20℃). The reacclimatized flies showed longer LT50 values compared to the control flies in both WL1 and X108 (Table 3). The difference in LT50 is larger in WL1 than in X108. The metabolic rate of the reacclimatized flies was also increased significantly in WL1 (Table 4; 0.131 vs. 0.185, t = 3.14, df = 58, P < 0.01) but not in X108 (Table 4; 0.119 vs. 0.123, t = 0.44, df = 58, P > 0.60). In all the schemes for temperature changes, the resulted changes in the metabolic rate paralleled the changes in the cold tolerance.
DISCUSSION
Cold adaptation of D. albomicans
Drosophila albomicans is a widely distributed species originated from the tropics in Southeast Asia (Kitagawa et al., 1982). In Drosophila species, the ability to overwinter is a critical factor to limit their geographical distribution (Kimura, 1988, 2004). Therefore, an expected trend is that strains collected from colder areas have a higher cold tolerance. This trend was observed in D. albomicans, although the difference in cold tolerance among the strains from the three temperature zones was not very large (Fig. 3) as reported for other Drosophila species as well (Kimura, 2004). This may be partly due to frequent migrations throughout their distribution range. In this regard, a strain from Taihsan, China, was noteworthy since the lowest monthly mean of daily minimum temperature of the collection site is –4.70℃ (Supplementary Table S4). Since this species unlikely overwinters in such temperature condition, wind likely carried those flies from a distant location. Therefore, this strain was possibly established from a migrant from a warmer location, suggesting that adaptation to local thermal environment could be obscured by seasonal migration in comparative studies among geographic populations.
Alternatively, our results suggest that the acclimation response was not a critical factor for this species during the recent colonization in Japan and China (Temperature Zone 1). Nevertheless, the comparison among closely related species revealed that the cold tolerance of the D. albomicans strains from the subtropics to temperate regions (Temperature Zones 1 and 2) was higher than that of its closely related species belonging to the D. nasuta subgroup distributed in the tropics and subtropics irrespective of their experience of the cold acclimation (Fig. 4). This implies that the distribution expansion of D. albomicans is likely attributed to the intraspecific variation including such strains that have a high cold tolerance and a strong acclimation response. It is noteworthy that D. pallidifrons, which is the most ancestral species in the D. nasuta subgroup (Wakahama et al., 1983; Suzuki et al., 1990), showed a relatively high cold tolerance after the cold acclimation (Fig. 4). This implies that D. albomicans may have retained the ability to respond to the cold acclimation from the ancestral species, whereas many of the closely related species have lost it. Such preadapted trait was likely a critical factor for this species to have the potential of expanding its distribution to colder regions. In either case, our results suggest that the ability to adapt to temperature fluctuations varies among species and among strains and that D. albomicans has the best ability in the D. nasuta subgroup.
It might be worth discussing the effects of in-lab artificial selection during the long-term maintenance of the strains used in this study. Every wild strain used was originated from a single inseminated female fly so that at each locus there might be genetic variations among four (or more by multiple inseminations) alleles carried by the ancestral female in her eggs and the sperms that fertilized the eggs. Since all the strains have been propagated by sib-mating, there has been no other source of genetic variation except mutations newly occurred during the last thirty years, which is considered to be too short for the mutations to generate de novo genetic variation. Because of this small extent of genetic variation due to the small number of original alleles within a strain, the effects of in-lab selection should be largely restricted as selection does not operate without genetic variation. Therefore, it is unlikely that the observed differences in the cold tolerance and acclimation response were largely influenced by the effects of in-lab artificial selection during the long-term maintenance of the strains.
In contrast to the small difference among geographic populations, there was a drastic difference in cold tolerance between D. albomicans and a cosmopolitan species, D. melanogaster. The latter showed a much higher cold tolerance than the former in all the tested temperature conditions (Fig. 2). Cosmopolitan species are generally considered to have higher tolerances to various environmental stresses such as heat, cold, and desiccation (Levins, 1969; Parsons and McDonald, 1978; Stanley et al., 1980; Jenkins and Hoffmann, 1999). For example, Jenkins and Hoffmann (1999) showed that three cosmopolitan species, D. melanogaster, D. simulans and D. immigrans, were more tolerant of cold than D. serrata that is distributed in the subtropics and tropics of eastern Australia. This is consistent with our observation of differences between D. albomicans and D. melanogaster. Furthermore, the level of acclimation response to different temperature conditions differed between these species. When flies were acclimatized at 15℃ or 20℃, the effect was very similar for D. albomicans (Fig. 2, A and B), whereas the acclimation at 15℃ was more effective than that at 20℃ for D. melanogaster (Fig. 2, C and D).
In the previous studies on the effects of acclimation on cold tolerance using D. melanogaster, the acclimation temperature was set between 11–15℃. For example, Goto (2000) showed that the half lethal temperature (temperature that kills half of the individuals for 24 hours) was 1℃ for the adult flies with an acclimation at 15℃ for 1 day, whereas it was 3℃ for those without acclimation. Bubliy et al. (2002) showed that when flies reared at 25℃ were acclimatized at 11℃ for 5 days before an exposure to 0℃ for 24 hours, the survival rate of the acclimatized flies was about 5–7 times higher than that of the control flies. Rako and Hoffmann (2006) showed that cold acclimatized flies at 12℃ after reared at 19℃ had lower mortality after a cold shock at −5℃ or −2℃. Compared to the acclimation responses of D. melanogaster described in these studies, our results showed that a full acclimation response was induced in D. albomicans at much higher temperature. This suggests that the response to a slightly cooler temperature (20℃) is important for D. albomicans in its habitat in the temperate regions.
There was another notable difference observed between D. melanogaster and D. albomicans. In D. albomicans, male flies showed a higher cold tolerance than female flies with a few exceptions (Fig. 2, A and B; Supplementary Table S4). This tendency was observed irrespective of their experience of cold acclimation. Such between-sex difference was not very clear in D. melanogaster (Fig. 2, C and D) or in other species belonging to the D. nasuta subgroup. However, the previous studies on D. melanogster and other species (D. takahashii, D. lutescens, D. triauraria, D. trapezifrons, D. watanabei, D. simulans, D. auraria and D. immigrans) showed that female flies tend to have a higher cold tolerance than male flies (Kimura, 1982; Goto and Kimura, 1998; Goto et al., 2000; Bubliy et al., 2002; Kojima and Kimura, 2003), although Kimura (1982) reported that the sex showing higher cold tolerance was dependent on the acclimation temperature in D. lutescens. Therefore, the observed between-sex difference in the cold tolerance of D. albomicans was rather exceptional among Drosophila species and may be reflecting some physiological traits specific to this species.
Metabolic rate and cold acclimation
In this study, there was no correlation found between cold tolerance and metabolic rate among different strains (Fig. 5A). This is consistent with Oikawa et al. (2006) showing no significant correlation between mass-adjusted oxygen consumption and thermal tolerance among 28 species belonging to Drosophila and its related genera. This may be because cold tolerance is a complex trait influenced by various factors such as presence of cryoprotective agents, antifreeze proteins, ice-nucleating proteins and heat-shock proteins and modified condition of cell membrane (Chown and Nicolson, 2004, for review; Lee and Denlinger, 2010; Michaud and Denlinger, 2010; Koštál, 2010; Chown and Sinclair, 2010; Huey, 2010; Overgaard et al., 2010; Storey and Storey, 2012). Differences in genetic background for these factors likely cause diversities in cold tolerance among strains and dispel the correlation with metabolic rate, which is also a complex physiological trait influenced by various factors.
By contrast, we found a significant positive correlation between the increase in cold tolerance and the increase in metabolic rate upon the cold acclimation among different strains of D. albomicans (Fig. 5B). In this case, the effect of cold acclimation was successfully extracted, because the influence of the differences in genetic background was controlled. This result supports the hypothesis that the changes in metabolic rate and the changes in cold tolerance are involved in common physiological processes. Similar metabolic rate changes upon cold acclimation have been shown by previous studies using D. melanogaster flies. For instance, Berrigan (1997) showed that the flies developed at 29℃ had a lower mass-specific metabolic rate than the flies with cold-acclimation at 18℃. Overgaard et al. (2008) reported that the flies reared at 25℃ had a lower cold tolerance compared to the control flies acclimatized at 20℃. Although these studies were designed to examine the effect of the rearing temperature rather than the acclimation, we clearly showed in this study that the effect of rearing temperature is mostly overridden by the temperature experienced at the adult stage using the deacclimation and reacclimation experiments. Therefore, their results can be interpreted as the response to the lower temperature experienced at the adult stage rather than the rearing temperature. In addition, using a tsetse fly species, G. pallidipes, Terblanche et al. (2005) showed that the flies developed at 19℃ had a higher metabolic rate than those at 24℃ and 29℃ when measured at either 20℃, 24℃, 28℃ or 32℃. Furthermore, Terblanche and Chown (2006) directly showed that both cold tolerance and metabolic rate became higher in response to cold acclimation at the adult stage as shown in this study for Drosophila species.
Molecular mechanism of cold acclimation responses
Recent studies have suggested that changes in gene expression are not the major driver of a short term response to a more abrupt temperature change in the case of rapid cold hardening (Sinclair et al., 2007; Teets et al., 2012, 2013). However, for the cold acclimation response to a longer term milder temperature change observed in this study, there are several lines of circumstantial evidence suggesting that the changes in gene expression play a major role. First of all, there have been cases reporting that the alteration of transcription level of some genes can induce similar physiological responses to those observed in our study. For example, both metabolic rate and cold tolerance were enhanced in atsugari and fumin mutants due to the altered transcription level of the corresponding and/or downstream genes (Takeuchi et al., 2009; Ueno et al., 2012). Secondly, Smp30 (Dca), known as a candidate gene for cold tolerance, was up-regulated during the cold acclimation at 15℃ for a few days in D. melanogaster originally reared at 25℃, a condition similar to that of our study (Goto, 2000). Finally in this study, the deacclimation and reacclimation experiments showed that the switches between acclimatized and non-acclimatized physiological states in flies required at least several days (Tables 3 and 4), suggesting that a rapidly triggered calcium signaling during rapid cold hardening for example was unlikely to be the underlying molecular mechanism. Therefore, so far, those circumstantial evidences imply that a systematic change in gene expression is responsible for the cold acclimation responses observed in this study. Genome-wide transcriptome analyses and intensive transgenetic experiments should shed light on the molecular mechanisms of cold tolerance and help our understanding of the evolutionary adaptation to thermal environment by organisms.
ACKNOWLEDGMENTS
We would like to thank M Toda and MT Kimura for valuable discussions regarding the ecology and the distribution of D. albomicans and its related species. This study is supported by JSPS grants-in-aid for scientific research 23370096 and a grant-in-aid from Tokyo Metropolitan University to KT.
REFERENCES
- Berrigan, D. (1997) Acclimation of metabolic rate in response to developmental temperature in Drosophila melanogaster. J. Therm. Biol. 22, 213–218.
- Berrigan, D., and Partridget, L. (1997) Influence of temperature and activity on the metabolic rate of adult Drosophila melanogaster. Comp. Biochem. Physiol. A Physiol. 118, 1301–1307.
- Bubliy, O. A., Riihimaa, A., Norry, F. M., and Loeschcke, V. (2002) Variation in resistance and acclimation to low-temperature stress among three geographical strains of Drosophila melanogaster. J. Therm. Biol. 27, 337–344.
- Chen, W., Zhang, J., Geng, Z., and Zhu, D. (1994) Invasion of Drosophila albomicans into Shanghai and areas nearby and a study on its mitochondrial DNA polymorphism. Yi Chuan Xue Bao 21, 179–187.
- Chown, S. V., and Nicolson, S. W. (2004) Insect physiological ecology: mechanisms and patterns. Oxford University Press, New York.
- Chown, S. L., and Sinclair, B. J. (2010) The macrophysiology of insect cold-hardiness. In: Low Temperature Biology of Insects (eds.: R. E. Lee and D. L. Denlinger), pp. 191–222. Cambridge University Press, New York.
- Czajka, M. C., and Lee, R. E. (1990) A rapid cold-hardening response protecting against cold shock injury in Drosophila melanogaster. J. Exp. Biol. 148, 245–254.
- Fleming, J. E., and Miquel, J. (1983) Effects of temperature on the metabolic rate of young and old Drosophila. Experientia 39, 267–268.
- Fujino, Y., Beppu, K., and Nakamura, H. (2006) Stratification of the Drosophilid assemblage in the research forest of AFC, Shinshu University. Bulletin Shinshu University Alpine Field Center 4, 47–55.
- Gillooly, J. F., Brown, J. H., West, G. B., Savage, V. M., and Charnov, E. L. (2001) Effects of size and temperature on metabolic rate. Science 293, 2248–2251.
- Goto, S. G. (2000) Expression of Drosophila homologue of senescence marker protein-30 during cold acclimation. J. Insect Physiol. 46, 1111–1120.
- Goto, S. G., and Kimura, M. T. (1998) Heat- and cold-shock responses and temperature adaptations in subtropical and temperate species of Drosophila. J. Insect Physiol. 44, 1233–1239.
- Goto, S. G., Kitamura, H. W., and Kimura, M. T. (2000) Phylogenetic relationships and climatic adaptations in the Drosophila takahashii and montium species subgroups. Mol. Phylogenet. Evol. 15, 147–156.
- Hoffmann, A. A., Sørensen, J. G., and Loeschcke, V. (2003) Adaptation of Drosophila to temperature extremes: bringing together quantitative and molecular approaches. J. Therm. Biol. 28, 175–216.
- Hoshina, H., Yamada, C., Uomi, H., and Terashima, M. (2007) Actual distribution of Drosophila (Drosophila) albomicans Duda, 1924 (Diptera: Drosophilidae) in Fukui pref., Honshu, Japan. Bulletin of The Fukui City Museum of Natural History 54, 79–82.
- Huey, R. B. (2010) Evolutionary physiology of insect thermal adaptation to cold environments. In: Low Temperature Biology of Insects (eds.: R. E. Lee and D. L. Denlinger), pp. 223–241. Cambridge University Press, New York.
- Hulbert, A. J., Clancy, D. J., Mair, W., Braeckman, B. P., Gems, D., and Partridge, L. (2004) Metabolic rate is not reduced by dietary-restriction or lowered insulin/IGF-1 signaling and is not correlated with individual lifespan in Drosophila melanogaster. Exp. Gerontol. 39, 1137–1143.
- Jenkins, N. L., and Hoffmann, A. A. (1999) Limits to the southern border of Drosophila serrata: cold resistance, heritable variation, and trade-offs. Evolution 53, 1823–1834.
- Kimura, M. T. (1982) Inheritance of cold hardiness and sugar contents in two closely related species, Drosophila takahashii and D. lutescens. Jan. J. Genet. 57, 575–580.
- Kimura, M. T. (1988) Adaptations to temperate climates and evolution of overwintering strategies in the Drosophila melanogaster species group. Evolution 42, 1288–1297.
- Kimura, M. T. (2004) Cold and heat tolerance of drosophilid flies with reference to their latitudinal distributions. Oecologia 140, 442–449.
- Kitagawa, O., Wakahama, K. I., Fuyama, Y., Shimada, T., Takanasi, E., Hatsumi, M., Uwabo, M., and Mita, Y. (1982) Genetic studies of the Drosophila nasuta subgroup, with notes on distribution and morphology. Jan. J. Genet. 57, 113–141.
- Kojima, K., and Kimura, M. T. (2003) Life history adaptations and stress tolerance of four domestic species of Drosophila. Entomological Science 6, 135–142.
- Koštál, V. (2010) Cell structural modifications in insects at low temperatures. In: Low Temperature Biology of Insects (eds.: R. E. Lee and D. L. Denlinger), pp. 116–140. Cambridge University Press, New York.
- Lee, R. E., and Denlinger, D. L. (2010) Rapid cold-hardning: ecological significance and underpinning mechanisms. In: Low Temperature Biology of Insects (eds.: R. E. Lee and D. L. Denlinger), pp. 35–58. Cambridge University Press, New York.
- Lee, R. E., Damodaran, K., Yi, S.-X., and Lorigan, A. (2006) Rapid cold-hardening increases membrane fluidity and cold tolerance of insect cells. Cryobiology 52, 459–463.
- Levins, R. (1969) Thermal acclimation and heat resistance in Drosophila species. The Am. Nat. 103, 483–499.
- Michaud, M. R., and Denlinger, D. L. (2010) Genomics, proteomics and metabolomics: finding the other players in insect cold-tolerance. In: Low Temperature Biology of Insects (eds.: R. E. Lee and D. L. Denlinger), pp. 91–115. Cambridge University Press, New York.
- Mikasa, K. (1991) A statistical analysis of seasonal fluctuations of population size in Drosophila populations near human habitation at Himeji city. J. Arts Sci. Meikai University 3, 8–18.
- Ohtsu, T., Katagiri, C., and Kimura, M. T. (1998) How Drosophila species acquire cold tolerance; Qualitative changes of phospholipids. Eur. J. Biochem. 252, 608–611.
- Ohtsu, T., Katagiri, C., and Kimura, M. T. (1999) Biochmical aspects of climatic adaptations in Drosophila curviceps, D. immigrans and D. albomicans (Diptera: Drosophilidae). Environmental Entomology 28, 968–972.
- Oikawa, A., Mori, N., and Kimura, M. T. (2006) Comparison of oxygen consumption in drosophilid flies from different climates. Entomological Science 9, 347–354.
- Overgaard, J., Tomčala, A., Sørensen, J. G., Holmstrup, M., Krogh, P. H., Šimek, P., and Koštál, V. (2008) Effects of acclimation temperature on thermal tolerance and membrane phospholipid composition in the fruit fly Drosophila melanogaster. J. Insect Physiol. 54, 619–629.
- Overgaard, J., Sørensen, J. G., and Loeschcke, V. (2010) Genetic variability and evolution of cold-tolerance. In: Low Temperature Biology of Insects (eds.: R. E. Lee and D. L. Denlinger), pp. 276–296. Cambridge University Press, New York.
- Parsons, P. A., and McDonald, J. (1978) What distinguishes cosmopolitan and endemic Drosophila species? Cell. Mol. Life Sci. 34, 1445–1446.
- R Core Team (2008) R: A language and environment for statistical computing. R Foundation for Statistical Computing, Vienna, Austria (http://www.R-project.org/).
- Rako, L., and Hoffmann, A. A. (2006) Complexity of the cold acclimation response in Drosophila melanogaster. J. Insect Physiol. 52, 94–104.
- Salt, R. W. (1961) Principles of insect cold-hardiness. Annu. Rev. Entomol. 6, 55–74.
- Sinclair, B. J., Gibbs, A. G., and Roberts, S. P. (2007) Gene transcription during exposure to, and recovery from, cold and desiccation stress in Drosophila melanogaster. Insect Mol. Biol. 16, 435–443.
- Stanley, S. M., Parsons, P. A., Spence, G. E., and Weber, L. (1980) Resistance of species of the Drosophila melanogaster subgroup to environmental extremes. Aust. J. Zool. 28, 413–421.
- Storey, K. B., and Storey, J. M. (2012) Insect cold hardiness: metabolic, gene, and protein adaptation. Can. J. Zool. 90, 456–475.
- Suzuki, Y. M., Kitagawa, O., and Wakahama, K. I. (1990) Chromosomal analysis and phylogenetic relationships in the Drosophila nasuta subgroup. I. Phylogenetic relationships within the Drosophila sulfrigaster species complex. Genetica 80, 53–66.
- Takeuchi, K., Nakano, Y., Kato, U., Kaneda, M., Aizu, M., Awano, W., Yonemura, S., Kiyonaka, S., Mori, Y., Yamamoto, D., et al. (2009) Changes in temperature preferences and energy homeostasis in dystroglycan mutants. Science 323, 1740–1743.
- Teets, N. M., Peyton, J. T., Ragland, G. J., Colinet, H., Renault, D., Hahn, D. A., and Denlinger, D. L. (2012) Combined transcriptomic and metabolomic approach uncovers molecular mechanisms of cold tolerance in a temperate flesh fly. Physiol. Genomics 44, 764–777.
- Teets, N. M., Yi, S. X., Lee, R. E., and Denlinger, D. L. (2013) Calcium signaling mediates cold sensing in insect tissues. Proc. Natl. Acad. Sci. USA 110, 9154–9159.
- Terblanche, J. S., and Chown, S. L. (2006) The relative contributions of developmental plasticity and adult acclimation to physiological variation in the tsetse fly, Glossina pallidipes (Diptera, Glossinidae). J. Exp. Biol. 209, 1064–1073.
- Terblanche, J. S., Klok, C. J., and Chown, S. L. (2005) Temperature-dependence of metabolic rate in Glossina morsitans morsitans (Diptera, Glossinidae) does not vary with gender, age, feeding, pregnancy or acclimation. J. Insect Physiol. 51, 861–870.
- Ueno, T., Tomita, J., Kume, S., and Kume, K. (2012) Dopamine modulates metabolic rate and temperature sensitivity in Drosophila melanogaster. PLoS ONE 7, e31513.
- Wakahama, K. I., Shinohara, T., Hatsumi, M., Uchida, S., and Kitagawa, O. (1983) Metaphase chromosome configuration of the immigrans species group of Drosophila. Jan. J. Genet. 58, 315–326.
