INTRODUCTION
Unsupervised machine learning that can extract a wide range of information from big sequence data without prior knowledge or particular models is highly anticipated in this era of big data accumulation for genome research. A self-organizing map (SOM) is an unsupervised machine-learning algorithm that can cluster and visualize high-dimensional complex data on one plane (Kohonen et al., 1996). For codon composition handled as multidimensional data, Kanaya et al. (2001) have modified the conventional SOM to a batch-learning SOM (BLSOM), which, in contrast to the conventional SOM, is suitable for high-performance parallel computing and thus for big sequence analyses (Abe et al., 2003). The BLSOM for oligonucleotide composition (e.g., 256 dimensions for tetranucleotide composition) can cluster genomic fragments (e.g., 10 kb) from a wide range of species according to phylotype without information regarding species during machine learning and reveal various novel genome characteristics (Abe et al., 2005, 2006; Uehara et al., 2011; Nakao et al., 2013).
Oligonucleotides such as hexa- and heptanucleotides (or longer) often represent motif sequences responsible for sequence-specific binding of proteins such as transcription factors (TFs). The occurrences of functionally important oligonucleotides such as TF binding sequences (TFBSs) should differ between genomic regions within one genome, and the regions enriched in these specific oligonucleotides should be distinguishable from other sequences. When constructing a BLSOM with pentanucleotide compositions in all 100- and 50-kb sequences derived from the human genome, the BLSOM formed several specific zones on the map, in which various core elements of a wider variety of TFBSs were enriched (Iwasaki et al., 2013). Importantly, sequences belonging to these specific zones were derived primarily from Mb-level centromeric and pericentromeric regions, which are poor in protein-coding genes; in addition, a set of enriched TFBSs is chromosome-dependent. The enrichment of TFBSs in these gene-poor regions was an unexpected artificial intelligence (AI) observation that provides a starting point for the present study.
Mammalian pericentromeric regions support centromere clustering and form the condensed heterochromatin “chromocenter” in interphase nuclei. Microscopic analyses such as fluorescence in situ hybridization have shown that centromeric and pericentromeric regions of both homologous and nonhomologous chromosomes are associated in a chromocenter, and its size and number differ among tissues of the same organism; notably, the grouping of particular chromosomes involved in chromocenter formation depends on cell type (Maison and Almouzni, 2004; Probst and Almouzni, 2011). It is also known that a burst in the transcription of noncoding RNAs from centromeric satellites is required for chromocenter formation during early mammalian development (Probst et al., 2010; Probst and Almouzni, 2011; Saksouk et al., 2015). Considering molecular mechanisms to achieve cell type-dependent chromocenter formation and the burst transcription of noncoding RNAs, the chromosome-dependent enrichment of a set of TFBSs in centromeric and pericentromeric regions is of particular interest because the cellular content of individual TFs is regulated cell type-dependently. In the present study we analyzed the distribution pattern of occurrence per Mb of eight pentanucleotides representing core elements for a wide variety of TFBSs; we then analyzed distribution patterns of hexa- and heptanucleotide TFBSs compiled by the SwissRegulon Portal, and revealed Mb-level TFBS and CpG islands in centromeric and pericentromeric regions on all human chromosomes except chrY.
We next try to combine the knowledge about chromocenters obtained by microscopic-level analysis with that obtained by sequence-level analysis. Sequence-level approaches to map physical chromatin interactions have been developed intensively in the 3C, 4C, 5C and Hi-C techniques (Lieberman-Aiden et al., 2009; Sanyal et al., 2012; Dekker and Misteli, 2015). Genome-wide mapping of chromatin interactions has been conducted for various cell types of various species and has clarified both intra- and interchromosomal interactions. The present study has shown that the Mb-level chromatin segments that support interchromosomal interactions locate primarily in Mb-level TFBS and CpG islands and are thus enriched for TFBSs and CG-containing oligonucleotides.
RESULTS
Occurrence of TFBS-core pentanucleotides in human 1-Mb sequences
Once the unsupervised machine learning, which was the BLSOM for pentanucleotide composition in our previous study (Iwasaki et al., 2013), revealed unexpected genome characteristics, such as the enrichment of TFBS-core oligonucleotides in gene-poor regions, the peculiar characteristics can be studied in more detail with a much simpler and direct method. When searching through TRANSFAC (http://www.gene-regulation.com/) and JASPAR Core Vertebrata (http://jaspar.genereg.net/), at least ten complementary pairs of pentanucleotides could be assigned as core motifs for a wide variety of human TFBSs; since transcriptional direction is not relevant here, a pair of complementary oligonucleotides is assumed to be the same in the present study. The previous pentanucleotide BLSOM showed that eight of the ten TFBS cores were clearly enriched at specific zones on the BLSOM that were primarily composed of Mb-level centromeric and pericentromeric sequences (Iwasaki et al., 2013; for details, see Fig. 8 of the present study). To confirm this AI discovery and characterize the Mb-level structures in more detail, Figs. 1A and 2A plot the occurrences per Mb of the eight TFBS-core pentanucleotides along six human chromosomes. Human centromeric and pericentromeric regions are composed of highly repetitive sequences and remain incompletely sequenced even in the GRCh38/hg38 version currently available, and the unsequenced region is visualized as an open space in Figs. 1 and 2.


Figure 1A presents three examples of chromosomes with a wide unsequenced region (chr1, chr9 and chr16), and Fig. 2A presents examples with a narrow unsequenced region (chr4, chr5 and chr8). The highest occurrence of TFBS cores is observed in centromeric and pericentromeric regions on all six chromosomes, more precisely in constitutive heterochromatin regions reported by Strachan and Read (2004) and the UCSC genome browser (https://genome.ucsc.edu/). Importantly, the TFBS core that produces the highest peak differs among chromosomes, and this chromosome-dependent heightened occurrence of TFBS cores in the centromeric and pericentromeric regions is observed on all chromosomes except chrY; Supplementary Figs. S1–S3 present the results for other chromosomes including chrY.
Mb-level CpG islands
Our previous BLSOM for pentanucleotide composition revealed that various CG-containing pentanucleotides are also enriched in centromeric and pericentromeric regions (Wada et al., 2015). Methylation at C in CG dinucleotides is a typical epigenetic modification, and the binding of methyl-CpG-binding domain proteins, as well as several structurally unrelated methyl-CpG-binding zinc-finger proteins, to methylated C induces histone deacetylation, subsequent chromatin condensation and heterochromatinization (Bogdanović and Veenstra, 2009). The human methyl-CpG-binding protein MeCP2 requires an A/T-rich sequence surrounding the methylated C for its binding and is involved in the formation of chromatin loops and in nuclear organization (Klose et al., 2005; Bogdanović and Veenstra, 2009).
When deliberating cell type-dependent chromocenter formation (i.e., centromere clustering), the enrichment of CG-containing oligonucleotides in centromeric and pericentromeric regions is of particular interest since the levels of methyl-CpG-binding proteins and of CG methylation are regulated cell type-dependently. Figures 1B and 2B plot the occurrences per Mb of CG-containing pentanucleotides. Because a pair of complementary oligonucleotides is assumed to be the same, 122 pairs of CG-containing pentanucleotides are analyzed. Considering the A/T neighborhood-dependent binding of MeCP2, mentioned above, we divide the 122 pairs into two categories by referring to the number of A/T nucleotides in each CG-containing pentanucleotide; those having three or two A/Ts are designated “A/T-rich” (Figs. 1Bi and 2Bi), and those having one or zero A/Ts are designated “A/T-poor” (Figs. 1Bii and 2Bii). The highest peak predominantly corresponds to the A/T-rich category and locates in centromeric and pericentromeric regions on all chromosomes; the second-highest peak predominantly corresponds to the A/T-poor category and is located in subtelomeric regions (Figs. 1B and 2B; Supplementary Figs. S1–S3). This difference between the two categories may relate to the A/T neighborhood-dependent binding of methyl-CpG-binding proteins. A few sharp peaks are observed in the internal parts of each chromosome, but their heights are lower than those in centromeric, pericentromeric and subtelomeric regions.
CpG islands (Bird, 1987), which play crucial roles in transcriptional regulation, are typically a few hundred bp in length and occur preferentially in gene regulatory regions (Deaton and Bird, 2011). By zooming out from several hundred bp to the Mb level, conventional CpG islands become inconspicuous, and Mb-level peaks become prominent. In view of the biological importance of CpG islands, we named the present large-scale structures “Mb-level CpG islands”. If we use the term CpG island, we should investigate the Mb-level CG deficiency along all chromosomes without the influence of G+C% fluctuation. Figure 3 plots the CG/GC ratio, which can visualize CG deficiency with the least influence of the G+C% fluctuation. While the A/T effect surrounding CG is disregarded in Fig. 3, Mb-level CpG islands still exist, and high peaks are observed in centromeric and pericentromeric regions of all chromosomes. Supplementary Fig. S5 presents other examples, and analyses on all chromosomes showed that the highest peak is observed in centromeric and pericentromeric regions for 19 chromosomes; on the residual five chromosomes, the highest peak is observed in subtelomeric regions, and the second-highest peak is observed in centromeric and pericentromeric regions. Several sharp peaks are observed in the internal parts of each chromosome, but their heights are lower than the peaks in the former regions.

Figures 1A and 2A analyzed the occurrence of eight TFBS-core pentanucleotides, but almost all TFBSs are longer than pentanucleotides. In addition, while the eight pentanucleotides are known to be core elements for a wide range of TFBSs, these pentanucleotides may also exist in sequences unrelated to TFBSs. Therefore, the enrichment observed in centromeric and pericentromeric regions may not properly reflect the actual enrichment of TFBSs. To clarify this uncertainty, we next analyzed distributions of human TFBSs compiled by SwissRegulon Portal (Pachkov et al., 2013), which compiles genome-wide annotations of regulatory sites including experimentally determined binding sites and known sites of sequence-specific TF binding reported in the literature. By searching through SwissRegulon Portal, we found 189 hexanucleotide TFBSs and 977 heptanucleotide TFBSs, to which eight and eleven types of TFs can bind, respectively; as mentioned above, a pair of complementary oligonucleotides is assumed to be the same in the present study. After surveying the database in more detail, we realized that a considerable portion of the registered TFBSs were rarely used (e.g., only a few times on the human genome), and we omitted such TFBSs that gave scarce information (Materials and Methods).
In Figs. 4 and 5 we analyzed occurrences per Mb of 74 (out of a total 189) hexanucleotide TFBSs on chr1 and chrX, respectively, after classifying the 74 TFBSs according to the eight TF groups; TF names according to SwissRegulon Portal are listed at the top of each panel. Except for TFDP1 on chr1 (Fig. 4), the highest peak locates primarily in centromeric and pericentromeric regions and the second-highest peak in subtelomeric regions; results for chr2 and chr9 are presented in Supplementary Figs. S6 and S7. Importantly, on all chromosomes except chrY, the highest peak locates primarily in centromeric and pericentromeric regions and the second-highest peak in subtelomeric regions for all eight TFs, although actual TFBSs giving high peaks differ between chromosomes.


Figures 6 and 7 analyzed occurrences of 549 (out of a total 977) heptanucleotide TFBSs on chr1 and chrX. Among the eleven TF groups, results for nine TFs are presented in Figs. 6 and 7, and for the residual two, TCF4_Dimer for chr1 and SPIB for chrX are presented in Figs. 4B and 5B, respectively; results for chr2 are presented in Supplementary Fig. S9. As found for hexanucleotide TFBSs, the highest peak locates primarily in centromeric and pericentromeric regions and the second-highest peak in subtelomeric regions for all eleven TFs on all chromosomes except chrY, although actual TFBSs giving the high peaks differ between chromosomes. These findings, obtained by analyzing hexa- and heptanucleotide TFBSs, are consistent with that obtained by analyzing TFBS-core pentanucleotides. Therefore, enrichment of TFBSs at centromeric and pericentromeric regions should be applicable to a wide range of TFBSs.
BLSOM analyses for TFBS occurrences in 1-Mb sequences
By analyzing the newest version of the human genome sequence (hg38) with a standard distribution map method, Figs. 1, 2, 3, 4, 5, 6, 7 can directly visualize Mb-level TFBS islands, which were predicted by the previous BLSOM for pentanucleotide composition (Iwasaki et al., 2013). While we analyzed a total of 623 TFBSs for all chromosomes, we can present only a limited portion of the results because the distribution map method is unsuitable for high-dimensional big data. When we analyze much longer TFBSs (e.g., 3,946 octanucleotide TFBSs compiled by SwissRegulon Portal) in order to obtain a more general view of TFBS distribution, the limitation becomes increasingly clear and the analysis becomes very cumbersome. In contrast, the oligonucleotide BLSOM can analyze high-dimensional big data without difficulty as a general feature of AI. As described in Materials and Methods, the BLSOM method projects high-dimensional data (oligonucleotide composition) onto a two-dimensional plane, and the present study has developed a new type of BLSOM that analyzes TFBS occurrences in 1-Mb sliding sequences with a 50-kb step; i.e., even ten times more 1-Mb sequences than the above distribution analysis can be analyzed simultaneously on a single map. TFBS occurrences of neighbor 1-Mb sequences are very similar to each other, and, therefore, sequences belonging to one chromosome may be visualized as a single stroke-like trajectory with no information about chromosomes during machine learning; i.e., TFBS occurrences along one chromosome will be visualized as dotted lines.
The BLSOM presented in Fig. 8A analyzes occurrences of all 3,946 octanucleotide TFBSs, which include even the rarely used TFBSs. Each node (i.e., lattice point) that contains sequences from a single chromosome is indicated in a color specifying the chromosome (for the colors, see Supplementary Fig. S12C), and a node containing sequences from more than one chromosome is indicated in black; that containing no genomic sequence is left blank (colorless). A major proportion of nodes are black, showing that these nodes contain sequences derived from more than one chromosome. However, there exists one conspicuous rectangle zone on the left side of the map, which has many colored dotted lines surrounded by wide colorless areas; this specific zone is marked in pink in Fig. 8B and designated as the SZ.

Our previous BLSOM studies (Abe et al., 2003, 2005) showed that nodes that contain sequences with a very different oligonucleotide composition from other sequences are surrounded by colorless nodes, which contain no sequence. TFBS occurrences in SZ sequences, therefore, should clearly differ from those in major zone sequences. Table 1 lists genomic regions harboring SZ sequences and centromeric and pericentromeric constitutive heterochromatin bands (https://genome.ucsc.edu). First, to examine whether the SZ sequences locate at centromere band regions, we calculated the difference in starting and ending position (Diff start and end in Table 1) between a SZ and the centromere band. While chromosomal bands are microscopic-level structures, their starting and ending positions fit well with those of the SZ for the majority of chromosomes.
Table 1. Genomic regions of SZ sequences and of centromeric and pericentromeric constitutive heterochromatin
| Chr | SZ start | SZ end | Cent p | Cent start | Cent end | Cent q | Cons Hetero | Diff start | Diff end | Hexa start | Hexa end | Start H-O | End H-O |
|---|
| 1 | 121.2 | 144.85 | p11.1 | 121.7 | 125.1 | q11 | 143.2: 1q12 | −0.5 | 19.75 | 121.3 | 143.75 | 0.1 | −1.1 |
| 2 | 89.9 | 95 | p11.1 | 91.8 | 96 | q11.1 | | −1.9 | −1 | 88.95 | 94.85 | −0.95 | −0.15 |
| 3 | 89.9 | 94.2 | p11.1 | 87.8 | 94 | q11.1 | | 2.1 | 0.2 | 89.95 | 94.1 | 0.05 | −0.1 |
| 4 | 48.9 | 52.2 | p11 | 48.2 | 51.8 | q11 | | 0.7 | 0.4 | 48.65 | 52.2 | −0.25 | 0 |
| 5 | 45.6 | 50.65 | p11 | 46.1 | 51.4 | q11.1 | | −0.5 | −0.75 | 45.6 | 50.65 | 0 | 0 |
| 6 | 58.1 | 61.9 | p11.1 | 58.5 | 62.6 | q11.1 | | −0.4 | −0.7 | 58.05 | 61.85 | −0.05 | −0.05 |
| 7 | 57.5 | 63.3 | p11.1 | 58.1 | 62.1 | q11.1 | | −0.6 | 1.2 | 57.55 | 63.15 | 0.05 | −0.15 |
| 8 | 43.25 | 46.95 | p11.1 | 43.2 | 47.2 | q11.1 | | 0.05 | −0.25 | 43.45 | 46.8 | 0.2 | −0.15 |
| 9 | 40.1 | 66.3 | p11.1 | 42.2 | 45.5 | q11 | 61.5: 9q12 | −2.1 | 20.8 | 40.4 | 68.55 | 0.3 | 2.25 |
| 10 | 38.35 | 42.55 | p11.1 | 38 | 41.6 | q11.1 | | 0.35 | 0.95 | 38.05 | 42.75 | −0.3 | 0.2 |
| 11 | 48.3 | 55.65 | p11.11 | 51 | 55.8 | q11 | | −2.7 | −0.15 | 48.4 | 55.6 | 0.1 | −0.05 |
| 12 | 34 | 38.45 | p11.1 | 33.2 | 37.8 | q11 | | 0.8 | 0.65 | 34.05 | 38.4 | 0.05 | −0.05 |
| 13 | 16.35 | 18.5 | p11.1 | 16.5 | 18.9 | q11 | | −0.15 | −0.4 | 16.35 | 18.6 | 0 | 0.1 |
| 14 | 16.35 | 18.95 | p11.1 | 16.1 | 18.2 | q11.1 | | 0.25 | 0.75 | 16.35 | 19.5 | 0 | 0.55 |
| 15 | 17.35 | 20.8 | p11.1 | 17.5 | 20.5 | q11.1 | | −0.15 | 0.3 | 17.35 | 22 | 0 | 1.2 |
| 16 | 31.85 | 37.95 | p11.1 | 35.3 | 38.4 | q11.1 | 47.0: 16q11.2 | −3.45 | −0.45 | 32.95 | 46.8 | 1.1 | 8.85 |
| 17 | 21.5 | 27.3 | p11.1 | 22.7 | 27.4 | q11.1 | | −1.2 | −0.1 | 21.4 | 27.35 | −0.1 | 0.05 |
| 18 | 15 | 21.2 | p11.1 | 15.4 | 21.5 | q11.1 | | −0.4 | −0.3 | 15.05 | 21.1 | 0.05 | −0.1 |
| 19 | 23.9 | 28 | p11 | 24.2 | 28.1 | q11 | | −0.3 | −0.1 | 24.05 | 27.95 | 0.15 | −0.05 |
| 20 | 25.9 | 31.45 | p11.1 | 25.7 | 30.4 | q11.1 | | 0.2 | 1.05 | 25.95 | 31.65 | 0.05 | 0.2 |
| 21 | 10.25 | 13.4 | p11.1 | 10.9 | 13 | q11.1 | | −0.65 | 0.4 | 9.5 | 13.4 | −0.75 | 0 |
| 22 | 13.2 | 16.7 | p11.1 | 13.7 | 17.4 | q11.1 | | −0.5 | −0.7 | 13.2 | 16.8 | 0 | 0.1 |
| X | 57.7 | 63.25 | p11.1 | 58.1 | 63.8 | q11.1 | | −0.4 | −0.55 | 57.85 | 63.1 | 0.15 | −0.15 |
| Y | 9.85 | 12.15 | p11.1 | 10.3 | 10.6 | q11.1 | | −0.45 | 1.55 | 9.9 | 12.2 | 0.05 | 0.05 |
Abbreviations in the first column are as follows: Chr, chromosome; SZ start (end), genomic start (end) position of SZ for octanucleotide BLSOM; Cent p (q), centromere band for p (q) arm (https://genome.ucsc.edu); Cent start (end), start (end) position of centromere band; Cons Hetero, end position of constitutive heterochromatin band and the band name in parenthesis; Diff start (end), difference between start (end) of SZ and centromere band; Hexa start (end), start (end) position of SZ for hexanucleotide BLSOM; Start (End) H-O), difference between start (end) position of SZ for hexanucleotide (H) and octanucleotide (O) BLSOM.
The pericentromeric constitutive heterochromatin region of chr1 and chr9 is marked in brown and that of chr16 is marked in green. A difference of more than 10 Mb in the Diff end column is marked in brown. A difference of more than 1 Mb in the Start (End) H-O columns is marked in green. SZ sequences of chrY of the octanucleotide BLSOM locate primarily at three regions: 9.85–12.14 Mb (Yp11.2–q11.21), 17.75–18.15 Mb (Yq11.222) and 19.6–20.8 (Yq11.223). When focusing on chromosomes other than sex chromosomes, SZ sequences of the octanucleotide BLSOM that locate outside of centromeric and pericentromeric regions were very rare and confined to those derived from the 0.7 Mb sequence (131.75–132.45 Mb) on chr2; these locate in the SZ but near the border with the main zone, and the biological meaning of this 0.7-Mb sequence is not clear at present.
For several chromosomes, however, the starting and/or ending position differs considerably between a SZ and the centromere band; differences of more than 10 Mb are marked in brown in the Diff end column in Table 1. Importantly, the exceptional chromosomes (chr1 and chr9) are known to have exceptionally large pericentromeric constitutive heterochromatin regions (Strachan and Read, 2004). In the case of chr1, the broad constitutive heterochromatin band 1q12 (125.1–143.2 Mb) corresponds to a large portion of the SZ that is uncovered by the centromere band 1q11. For chr9, a broad constitutive heterochromatin band, 9q12 (45.5–61.5 Mb), corresponds to a large portion of the SZ uncovered by 9q11. In the case of chrY, the centromere bands (Yp11.1 and q11.1) are very narrow (a total of 0.3 Mb), but large and separate portions even away from the centromere band are composed of constitutive heterochromatin. SZ sequences of chrY are derived from three separate chromosomal regions and their total size is 3.9 Mb (see the footnotes for Table 1). These findings support the view that the characteristic TFBS composition of the SZ reflects the characteristics of constitutive heterochromatin but not of centromere structures.
To determine whether the features discovered by the BLSOM for octanucleotide TFBSs are also observed for TFBSs with a different length, Supplementary Fig. S12A analyzed occurrences of all 189 hexanucleotide TFBSs, which include the rarely used TFBSs, and an SZ (marked in pink in Supplementary Fig. S12B) was again observed. Genomic regions harboring the SZ sequences are also presented in Table 1; when the difference of the starting or ending position of this SZ from the centromere band is more than 10 Mb, the position is marked in green in the Hexa end column. Importantly, the regions obtained for the hexanucleotide BLSOM are in good agreement with those for the octanucleotide BLSOM except for a few chromosomes; a difference of more than 1 Mb is marked in green in the Start (End) H-O columns. The clear difference is confined primarily to chr1, chr9 and chr16, which have large-scale constitutive heterochromatin, and the most evident difference (8.85 Mb) is observed for chr16. The SZ region of chr16 for the hexanucleotide BLSOM (but not for the octanucleotide BLSOM) fits well with the pericentromeric constitutive heterochromatin 16q11.2 (marked in green). The difference found for the two sets of TFBSs may relate to differential roles of the large constitutive heterochromatin regions of different chromosomes.
Diagnostic oligonucleotides for SZ formation
A BLSOM can visualize diagnostic oligonucleotides that are responsible for the clustering (self-organization) of sequences in a particular zone like the SZ. In the BLSOM of Fig. 8A, the representative vector for each node is composed of 3,946 variables, and the contribution level of each variable in each node can be visualized by a color: red (high), white (moderate) and blue (low), as described previously (Abe et al., 2006). Figure 8B presents examples of fourteen TFBSs that are enriched (red) at the SZ and thus at centromeric and pericentromeric regions; and the last panel in Fig. 8B shows an example that is not enriched at the SZ. The panels in the upper part of Fig. 8B mainly show TFBSs that are enriched at wide areas in the SZ and thus enriched on many chromosomes; the lower part mainly presents examples enriched at particular areas in the SZ and thus enriched on a limited number of chromosomes.
In summary, Fig. 8B shows that the BLSOM can specify the TFBSs that are enriched in centromeric and pericentromeric regions of individual chromosomes. When considering molecular mechanisms for cell type-dependent centromere clustering, the chromosome-dependent enrichment of a particular set of TFBSs should become important. Furthermore, to study TFBSs longer than octanucleotides, AI methods like the BLSOM should become increasingly useful.
Interchromosomal chromatin interaction
Microscopic studies have shown that the number and size of chromocenters, as well as the number and type of centromeres gathered in each chromocenter, vary depending on cell type, and telomeric regions are also associated as the chromocenter grows larger (Probst et al., 2010; Probst and Almouzni, 2011). To understand molecular mechanisms of this cell type-dependent centromere clustering, it becomes important to obtain molecular-level information about chromosomal regions that physically interact with each other. Hi-C measurements of chromatin interactions have clarified not only intra- but also interchromosomal interactions, and the data for interchromosomal interactions should specify genomic regions that are involved in the centromere clustering of nonhomologous chromosomes.
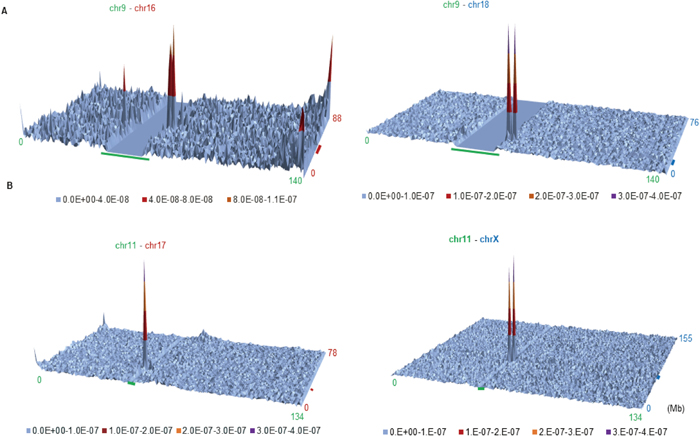
Lieberman-Aiden et al. (2009) have successfully clarified human genomic regions that are involved in intra- and interchromosomal interactions in GM06990 cells. We used their normalized (observed/expected) contact frequency for interchromosomal interactions at 1-Mb resolution; notably, with no additional computational processing, we can identify and visualize genomic regions involved in interchromosomal interactions. Figure 9 shows contour plots of Mb-level chromatin interactions between nonhomologous chromosomes: chr9–chr16 and chr9–chr18 (Fig. 9A) and chr11–chr17 and chr11–chrX (Fig. 9B). The centromeric constitutive heterochromatin region of each chromosome is indicated by a thick colored bar distinguishing the chromosome: green, brown and blue for chr9, chr16 and chr18, respectively, in Fig. 9A; green, brown and blue for chr11, chr17 and chrX, respectively, in Fig. 9B. The unsequenced area for chr9 is large and easily recognized as the flat bottom in the contour plot, and that for chr11 appears as a valley. Interestingly, the peak position of chr9 is almost the same against chr16 and chr18 (Fig. 9A) and that of chr11 is almost the same against chr17 and chrX (Fig. 9B). Further analyses on all pairs of nonhomologous chromosomes showed that the highest peak for the interchromosomal association was usually at centromeric and pericentromeric regions and the second-highest peak was at subtelomeric regions.
If genomic regions showing the highest interaction of a certain chromosome (e.g., chr9) with others (e.g., chr16 and18) are primarily common regardless of counterpart chromosomes, the common region of the former should be visualized in the following way. By using the normalized contact frequency (Lieberman-Aiden et al., 2009), frequencies for each 1-Mb sequence of one chromosome against all counterpart 1-Mb sequences from all other chromosomes are summed and plotted along the chromosome. Examples of eight chromosomes are presented in Fig. 10, and analyses for all chromosomes show that clear peaks are observed at centromeric and pericentromeric regions. Since the Hi-C data are based on the NCBI36/hg18 sequence, the nucleotide numbering differs slightly from that for hg38, and the unsequenced area is larger than for hg38. After correcting for the difference in nucleotide numbering between the two sequence versions with Lift Genome Annotations (https://genome.ucsc.edu/cgi-bin/hgLiftOver), the high peaks were found to locate within the centromeric and pericentromeric Mb-level TFBS and CpG islands found for hg38, showing that a major region responsible for interchromosomal interaction is enriched for TFBSs and CpG-containing oligonucleotides on all chromosomes; Hi-C data for chrY were absent because GM06990 is a female cell line.


 ), AATCT/AGATT (
 ), AGATA/TATCT (
 ), ATTGG/CCAAT (
 ), CTATC/GATAG (
 ), CTTCC/GGAAG (
 ), GCCAA/TTGGC (
 ) and TATCA/TGATA (
 ). To reduce an artifactual effect caused by the cut site of the 1-Mb sequence, the 1-Mb window slides with a 500-kb step. The genomic region of centromeric and pericentromeric constitutive heterochromatin, obtained from

 and chr
 or between chr
 . (B) Contact frequencies between chr
 and chr
 or between chr
 . The position of constitutive heterochromatin is marked with a thick bar colored for distinguishing chromosomes. Detailed analyses on the data including those for other chromosomes show chromosome-dependent complex interactions also for subtelomeric regions with centromeric, pericentromeric and/or subtelomeric regions of nonhomologous chromosomes; these interactions may relate to the participation of telomeres in the formation of large chromocenters.