ABSTRACT
Acute myocardial infarction (AMI) is one of the leading causes of death globally, with a mortality rate of over 20%. However, the diagnostic biomarkers frequently used in current clinical practice have limitations in both sensitivity and specificity, likely resulting in delayed diagnosis. This study aimed to identify potential diagnostic biomarkers for AMI and explored the possible mechanisms involved. Datasets were retrieved from the Gene Expression Omnibus. First, we identified differentially expressed genes (DEGs) and preserved modules, from which we identified candidate genes by LASSO (least absolute shrinkage and selection operator) regression and the SVM–RFE (support vector machine–recursive feature elimination) algorithm. Subsequently, we used ROC (receiver operating characteristic) analysis to evaluate the diagnostic accuracy of the candidate genes. Thereafter, functional enrichment analysis and an analysis of immune infiltration were implemented. Finally, we assessed the association between biomarkers and biological processes, infiltrated cells, clinical traits, tissues and time points. We identified nine preserved modules containing 1,016 DEGs and managed to construct a diagnostic model with high accuracy (GSE48060: AUC = 0.923; GSE66360: AUC = 0.973) incorporating two genes named S100A9 and SOCS3. Functional analysis revealed the pivotal role of inflammation; immune infiltration analysis indicated that eight cell types (monocytes, epithelial cells, neutrophils, CD8+ T cells, Th2 cells, NK cells, NKT cells and platelets) were likely involved in AMI. Furthermore, we observed that S100A9 and SOCS3 were correlated with inflammation, variably infiltrated cells, clinical traits of patients, sampling tissues and sampling time points. In conclusion, we suggested S100A9 and SOCS3 as diagnostic biomarkers of AMI and discovered their association with inflammation, infiltrated immune cells and other factors.
INTRODUCTION
Acute myocardial infarction (AMI) is the myocardial dysfunction and necrosis from hypoxia and ischemia caused by abrupt obstruction of the coronary arteries, and is one of the leading causes of death worldwide, affecting more than seven million individuals each year (Thygesen et al., 2012; Reed et al., 2017; Ibanez et al., 2018). Although therapies have developed in recent decades (de Vreede et al., 1991), the prognosis of AMI remains poor with a fatality rate of over 20% (Gan et al., 2000; Krumholz et al., 2009), and about 30% of the deaths occur before hospital arrival (Karam et al., 2019). A favorable prognosis of AMI relies on an early diagnosis, which remains a challenge (Neumann et al., 2016). The diagnosis of AMI is mainly based on three aspects, clinical signs, electrocardiograms and biomarkers, among which biomarkers are considered the most accurate and conclusive (Reed et al., 2017). However, the biomarkers frequently used in current clinical practice, such as cardiac troponins and creatine kinase myocardial band, have limitations in both sensitivity and specificity, likely resulting in delayed diagnosis (Graff et al., 2006; Braunwald, 2012).
With rapid advances in molecular biology, attention has gradually focused on the vital role of genetic factors in the occurrence and development of AMI (Dai et al., 2016). We can now uncover potential biomarkers related to specific diseases through bulk screening of molecules thanks to bioinformatics, an interdisciplinary field incorporating biology, computer technology, information engineering and statistics.
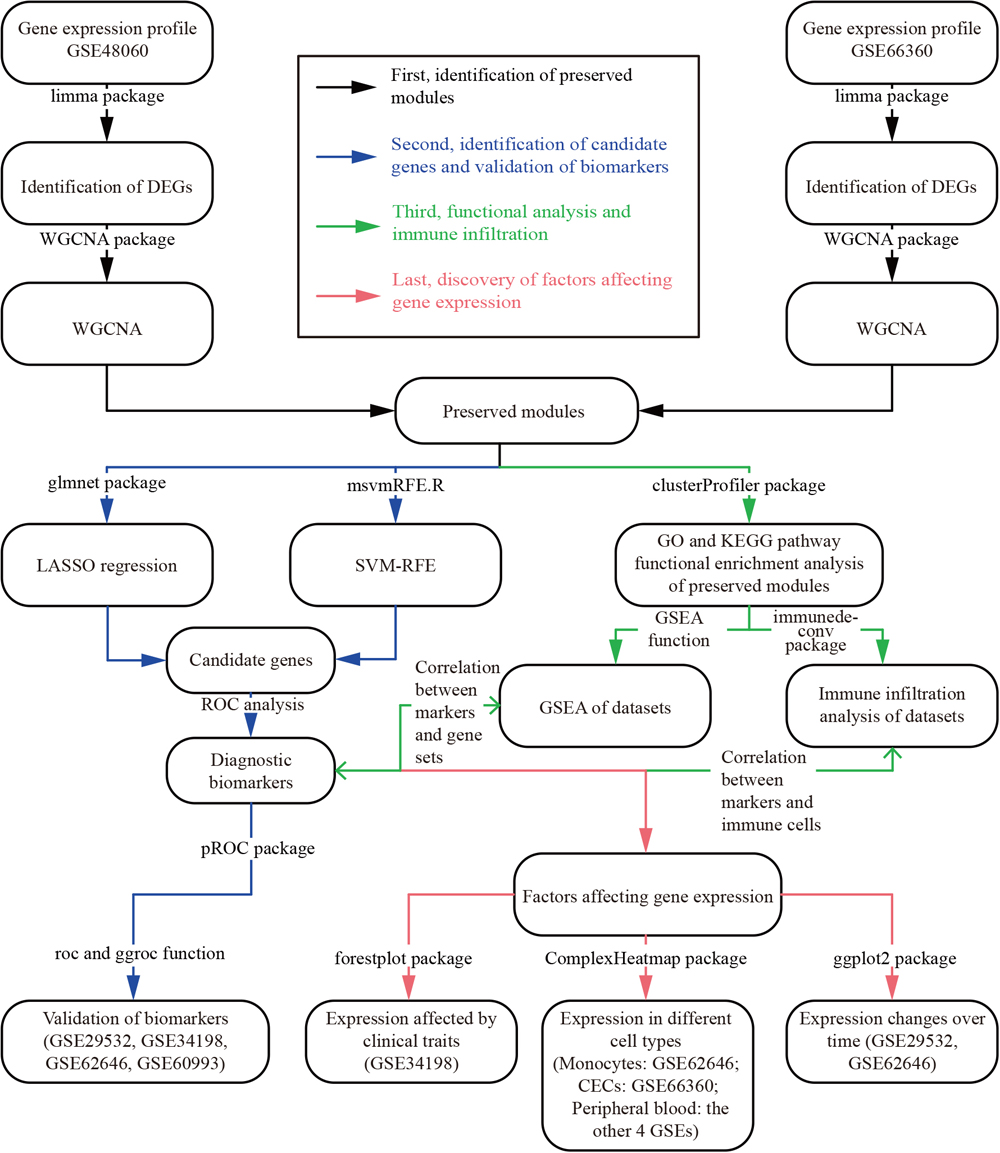
In this study, we aimed to identify potential diagnostic biomarkers of AMI. First, we identified differentially expressed genes (DEGs) using the limma package and preserved modules using weighted gene correlation network analysis (WGCNA). Subsequently, we implemented LASSO (least absolute shrinkage and selection operator) regression and the SVM–RFE (support vector machine–recursive feature elimination) algorithm for further gene selection. Genes that were included in the preserved modules as well as selected by both algorithms were considered as candidate genes. Finally, we constructed various diagnostic models incorporating different candidate genes, and the diagnostic accuracy of the models was tested using ROC (receiver operating characteristic) analysis. Genes in the optimal diagnostic model with the best balance between simplicity and accuracy were considered potential diagnostic biomarkers of AMI. Additionally, we performed immune infiltration analysis to discover AMI-related immune cells and their association with biomarkers, and evaluated their association with different clinical traits.
RESULTS
The flow chart in Fig. 1 summarizes the analysis procedure.
Identification of DEGs and preserved modules
As the preliminary screening of genes, we first identified DEGs using the lmFit and eBayes functions in the limma package. In the two training datasets, we identified 5,966 DEGs in GSE48060 and 6,041 DEGs in GSE66360, and 2,060 overlapping DEGs in both datasets. For details of these and the other datasets used in this study, see Materials and Methods and Table 1.
Table 1. Basic information for GSE datasets
| GEO accession | Case | Control | Sample | Platform | Group |
|---|
| GSE48060 | 31 | 21 | Peripheral blood | GPL570 | Training set |
| GSE66360 | 49 | 50 | Circulating endothelial cells (CECs) | GPL570 | Training set |
| GSE29532 | 49 | 6 | Peripheral blood | GPL5175 | Test set |
| GSE34198 | 45 | 45 | Peripheral blood | GPL6102 | Test set |
| GSE60993 | 17 | 7 | Peripheral blood | GPL6884 | Test set |
| GSE62646 | 28 | 14 | Monocytes | GPL6244 | Test set |
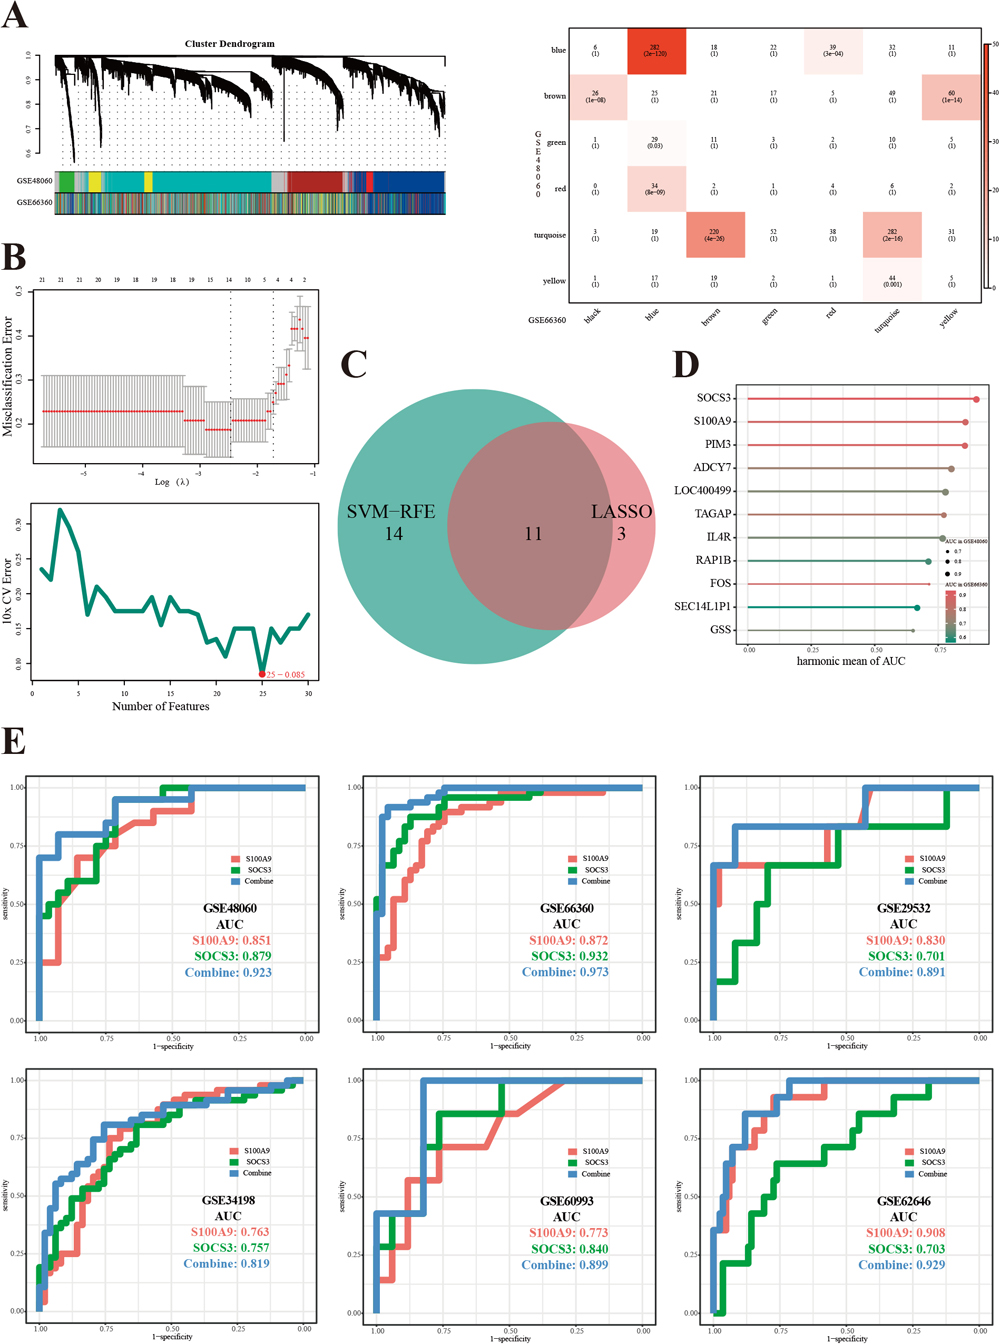
To find reproducible biomarkers in several cell types, we applied module preservation analysis to GSE48060 and GSE66360. First, unqualified samples were removed, including GSM1167075, GSM1167076, GSM1167099 and GSM1167123 in GSE48060, and GSM1620894, GSM1620899, GSM1620912 and GSM1620913 in GSE66360. Second, we picked 14 as the soft threshold power value in accordance with the criterion (signed R2 = 0.821). Third, the two co-expression networks passed a comparability test (ranked expression: P < 1e–200; ranked connectivity: P = 2e–25; Supplementary Fig. S1), and co-expression networks of each dataset were constructed. Eventually, a total of nine modules containing 1,016 genes were identified as preserved modules (Fig. 2A).
Identification of candidate genes and validation of biomarkers
Two machine-learning (ML) methods, LASSO regression and the SVM–RFE algorithm, were applied to identify candidate genes. LASSO identified 14 candidate genes; meanwhile, SVM–RFE identified 25 candidate genes containing 11 overlapping genes (Fig. 2B and Fig. 2C). The 11 genes then underwent ROC analysis in the training sets GSE48060 and GSE66360 as shown in Table 2, and the top five genes with the highest harmonic mean of the area under the curve (AUC) were S100A9, SOCS3, PIM3, ADCY7 and LOC400499 (Fig. 2D). We managed to simplify the diagnostic model with an accuracy of over 90% in the training sets (AUC values: 0.923 in GSE48060 and 0.973 in GSE66360), containing only the top two genes: S100A9 and SOCS3. Therefore, we consider S100A9 and SOCS3 to be efficient diagnostic biomarkers for AMI. Detailed results of ROC analysis are shown in Fig. 2E.
Table 2. Results of the LASSO model, SVM–RFE algorithm and subsequent ROC analysis
| Gene symbol | LASSO | SVM-RFE | Harmony mean of AUC |
|---|
| Coefficient | AUC | AvgRank | AUC | Value | Rank |
|---|
| SOCS3 | 0.19 | 0.879 | 33.9 | 0.932 | 0.9047 | 1 |
| S100A9 | 0.29 | 0.851 | 9.7 | 0.872 | 0.8614 | 2 |
| PIM3 | 0.17 | 0.837 | 44.5 | 0.886 | 0.8608 | 3 |
| ADCY7 | −2.54 | 0.896 | 22.3 | 0.733 | 0.8063 | 4 |
| LOC400499 | 1.07 | 0.914 | 34.9 | 0.685 | 0.7831 | 5 |
| TAGAP | −0.28 | 0.775 | 46.9 | 0.777 | 0.7760 | 6 |
| IL4R | 1.00 | 0.905 | 40.3 | 0.673 | 0.7719 | 7 |
| RAP1B | −0.52 | 0.854 | 30.1 | 0.616 | 0.7157 | 8 |
| FOS | −0.01 | 0.605 | 32.0 | 0.874 | 0.7150 | 9 |
| SEC14L1P1 | −0.38 | 0.829 | 47.4 | 0.564 | 0.6713 | 10 |
| GSS | 0.16 | 0.627 | 33.0 | 0.681 | 0.6529 | 11 |
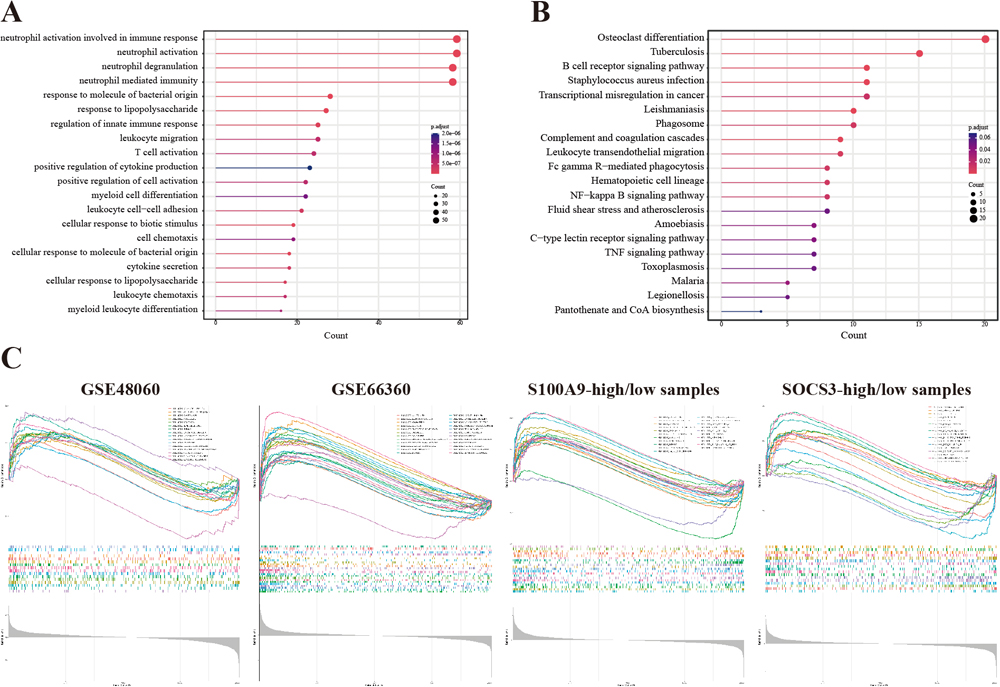
To discover biological processes, states and pathways in the preserved modules and datasets, we performed Gene Ontology (GO) enrichment analysis, Kyoto Encyclopedia of Genes and Genomes (KEGG) functional enrichment analysis and gene set enrichment analysis (GSEA). The GO analysis of preserved modules showed that biological processes (BPs) associated with neutrophils were most significantly enriched (Fig. 3A), and enriched KEGG pathways are shown in Fig. 3B. The top upregulated biological processes or states in GSE48060, GSE66360, S100A9-high/low and SOCS3-high/low datasets were, respectively, HALLMARK_REACTIVE_OXYGEN_SPECIES_PATHWAY (enrichment score (ES) = 0.550), HALLMARK_TNFA_SIGNALING_VIA_NFKB (ES = 0.817) and HALLMARK_IL6_JAK_STAT3_SIGNALING (ES = 0.658) and HALLMARK_IL6_JAK_STAT3_SIGNALING (ES = 0.549) (Fig. 3C and Supplementary Table S1).
Immune infiltration
To discover differences in the immune microenvironment in AMI, we analyzed immune cell infiltration. First, cell type enrichment analysis revealed that eight types of cells differed in their infiltration behavior (Fig. 4A and Supplementary Table S2): NK cells (P = 9.83e–5), epithelial cells (P = 6.55e–4), monocytes (P = 8.09e–4), neutrophils (P = 1.53e–3), CD8+ T cells (P = 0.014), platelets (P = 0.020), NKT cells (P = 0.026) and Th2 cells (P = 0.039). Subsequently, the correlation between each cell and score was evaluated as shown in Fig. 4B and Supplementary Table S3. The stromal score had the strongest positive correlation with adipocytes (r = 0.910, P = 3.09e–19), while the immune score had a positive correlation with monocytes (r = 0.489, P = 4.19e–4), neutrophils (r = 0.434, P = 0.002), epithelial cells (r = 0.450, P = 0.001), B cells (r = 0.445, P = 0.002), CD4+ T cells (r = 0.313, P = 0.030) and CD8+ T cells (r = 0.365, P = 0.011), as well as a strong negative correlation with platelets (r = –0.772, P = 1.33e–10) and megakaryocytes (r = –0.804, P = 5.94e–12). Finally, the correlation between biomarkers and cells was assessed as shown in Fig. 4C, Fig. 4D, Supplementary Table S4 and Supplementary Table S5. S100A9 was significantly positively correlated with neutrophils (r = 0.731, P = 3.76e–9), eosinophils (r = 0.557, P = 3.89e–5), epithelial cells (r = 0.516, P = 1.76e–4), platelets (r = 0.486, P = 4.59e–4), the immune score (r = 0.393, P = 0.006) and the microenvironment score (r = 0.396, P = 0.006), and significantly negatively with NK (r = –0.505, P = 2.50e–4) and NKT cells (r = –0.512, P = 1.99e–4). SOCS3 was mainly positively correlated with MSCs (r = 0.406, P = 0.004) and neutrophils (r = 0.404, P = 0.004), and negatively correlated with NK (r = –0.372, P = 0.009) and NKT cells (r = –0.353, P = 0.014).

Considering our results and the existing literature, we propose a possible mechanism of S100A9 and SOCS3 involvement in inflammation, as shown in Fig. 4E.
Exploration of factors affecting gene expression
We investigated how gene expression was affected in AMI from three viewpoints.
Gene expression in patients with different clinical traits
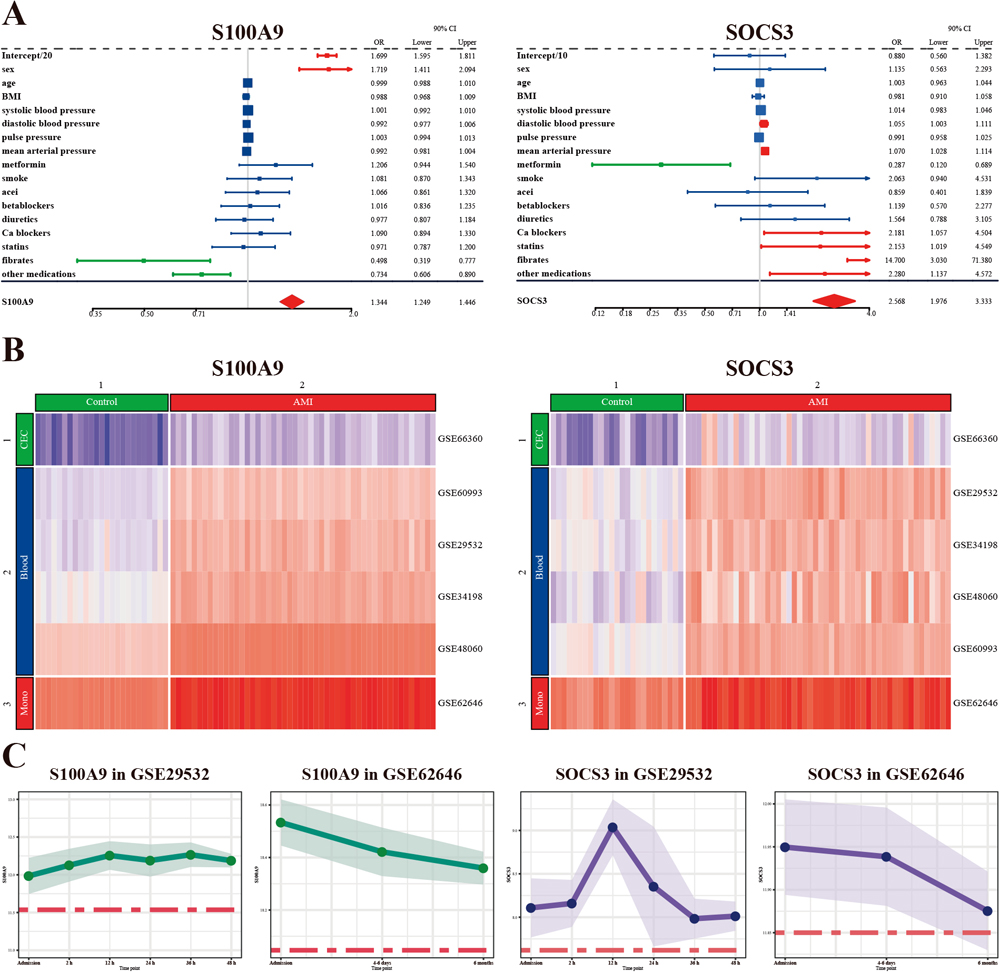
Our results (Fig. 5A) showed that S100A9 had a positive correlation with female gender (odds ratio (OR) = 1.719, 95% confidence interval (95%CI): 1.595–1.811), but a negative correlation with fibrates (OR = 0.498, 95%CI: 0.319–0.777) and other medications (OR = 0.734, 95%CI: 0.606–0.890) mentioned in GSE34198. SOCS3 had a positive correlation with diastolic blood pressure (OR = 1.055, 95%CI: 1.003–1.111), mean arterial pressure (OR = 1.070, 95%CI: 1.028–1.114), calcium blockers (OR = 2.181, 95%CI: 1.057–4.504), statins (OR = 2.153, 95%CI: 1.019–4.549), fibrates (OR = 14.700, 95%CI: 3.030–71.380) and other medication (OR = 2.280, 95%CI: 1.137–4.572), and a negative correlation with metformin (OR = 0.287, 95%CI: 0.120–0.689).
Gene expression in various cell types
As shown in Fig. 5B, the expression of both S100A9 and SOCS3 was qualitatively cell type-specific, and they could basically distinguish AMI patients from normal individuals. Circulating endothelial cells (CECs) had the lowest S100A9 and SOCS3 expression, while peripheral blood had intermediate expression, and monocytes had the highest expression.
Gene expression at different time points
The expression of both S100A9 and SOCS3 seemed to decrease over a period of 6 months (Fig. 5C). Compared to SOCS3, S100A9 seemed more stable within the first 48 h after patient admission, whereas SOCS3 reached its peak at 12 h.
DISCUSSION
Acute myocardial infarction is a life-threatening medical emergency with a poor prognosis resulting from the difficulty of early diagnosis. This study aimed to identify efficient diagnostic biomarkers for AMI.
We first identified nine modules containing 1,016 genes, which underwent further gene selection using LASSO regression and SVM–RFE. A total of 11 genes consistently selected by both algorithms were considered as candidate genes. We then constructed a series of diagnostic models, each containing different genes, and managed to identify a simple diagnostic model incorporating two genes, S100A9 and SOCS3, with a high accuracy of over 90% in the training sets. In addition, immune infiltration analysis revealed that eight cell types were differentially infiltrated, suggesting their potential pathophysiological roles in AMI; S100A9 had the most significant correlation with neutrophils, while SOCS3 had the most significant correlation with MSCs. Finally, the association of S100A9 and SOCS3 with clinical traits was also assessed.
Methodology
Module preservation analysis is usually carried out to determine whether a set of entities that co-occur among individuals or tissues changes under different conditions (Langfelder and Horvath, 2008). We implemented module preservation analysis of data from peripheral blood, monocytes and CECs to find potential biomarkers reproducibly among cell types, because factors other than infarction-related inflammation might influence the expression of biomarkers due to the complex composition of the blood (Carter, 2018). For example, altered cell proportions in the blood due to hematological diseases are likely to influence the mean expression value of biomarkers, and expression in CECs may therefore be more informative because they are not hematopoietic cells and have an extremely low count in the blood (Lin et al., 2000).
Gene selection is a conventional dimension reduction problem in machine learning. LASSO regression is a powerful ML method for variable selection for high-dimensional data when the number of variables is much greater than the sample size, adding an L1 penalty to the usual regression objective function. SVM–RFE, a simple and efficient algorithm, has also been widely implemented in analyzing high-dimensional data, for instance, conducting gene selection in a backward elimination procedure (Ding and Wilkins, 2006).
Inflammation and immune infiltration
Our GO, KEGG and GSEA functional enrichment analyses revealed that genes associated with inflammatory biological processes were significantly enriched (Fig. 3), suggesting that inflammation might play a critical role in AMI. These results corroborated a great deal of previous work indicating that inflammation is an essential part of pre-infarction atherosclerosis and post-infarction myocardial repair (Frangogiannis et al., 2002; Melamed and Goldhaber, 2014; Daskalopoulos et al., 2014; Ong et al., 2018).
For further investigation of changes in the microenvironment, we examined immune infiltration, which showed that eight cell types were variably infiltrated between AMI patients and the control group (Fig. 4A), as follows. (1) Elevated numbers of monocytes, epithelial cells and neutrophils, which were positively correlated with the immune score. In accordance with our present results, previous studies have demonstrated pivotal roles for these cells in plaque formation, inflammation regulation and post-infarction adverse cardiac events (Daskalopoulos et al., 2014). (2) Elevated CD8+ T cells, which reflected the findings of Zhang et al. (2018) that the frequency of CD8+CD28+ T cells was independently associated with AMI, positively correlated with cardiac troponin I concentration, and negatively associated with left ventricular ejection factor. (3) Reduced Th2 cells, which agreed with the results of Engelbertsen et al. (2013) that T-helper 2 immunity was associated with reduced risk of myocardial infarction and stroke, as well as TH1/TH2 functional imbalance after AMI due to coronary arterial or myocardial inflammation. (4) Decreased NK and NKT cells, consistent with the findings of considerable previous work that patients with coronary artery disease have a reduced number of NK cells (Backteman et al., 2014; Kumrić et al., 2020). (5) Elevated platelets; previous studies have suggested that high platelet count and mean platelet volume are associated with a higher rate of adverse clinical outcomes (Paul et al., 2010; Tian et al., 2018).
S100A9
This study suggests that S100A9 and SOCS3 serve as diagnostic biomarkers for AMI and play a crucial role in inflammation and the immune microenvironment.
Among the various S100 proteins, S100A9 (MRP-14, calgranulin B) has been shown to be the most important of all the DAMP (damage-associated molecular pattern) proteins in sterile inflammatory conditions, including infarction-related inflammation (Schiopu and Cotoi, 2013). S100A9 plays both detrimental and protective roles in AMI. For instance, short-term S100A9 blockade showed an effect in improving cardiac function for AMI patients by inhibiting systemic and cardiac inflammation post-myocardial infarction (Marinković et al., 2019; Cai et al., 2020). In contrast, long-term S100A9 blockade negatively impacted cardiac recovery and counterbalanced the beneficial effects of short-term therapy by inhibiting cardiac repair (Marinković et al., 2020). These results suggest a therapeutic time window for optimal S100A9 blockade as a potential immunomodulatory treatment in AMI.
Our results showed that S100A9 was significantly positively correlated with (1) neutrophils (Fig 4C), in agreement with those of Marinković et al. (2019), who also found that the level of circulating S100A9 was significantly related to blood neutrophil counts; (2) eosinophils, which played a cardioprotective role in post-MI hearts (Liu et al., 2020); (3) epithelial cells, corroborating the findings of Averill et al. (2012) that S100A9 was associated with the cytokine secretion and permeability of epithelial cells in AMI; and (4) platelets, in which Healy et al. (2006) also reported that S100A9 was elevated in patients presenting with AMI. Meanwhile, S100A9 was significantly negatively correlated with NK and NKT cells. Narumi et al. (2015) suggested that S100A9 engages in crosstalk with NK cells via RAGE (receptor for advanced glycation end products), contributing to myocardial necrosis (Fracasso et al., 2019).
We also observed that a history of fibrate use was associated with reduced expression of S100A9, supporting the results of Averill et al. (2012) and Cotoi et al. (2014) that the levels of circulating S100A9 had a strong correlation with traditional cardiovascular risk factors such as smoking, obesity, hyperglycemia and dyslipidemia.
Additionally, we discovered that the expression of S100A9 was tissue-specific. Conventionally, S100A9 expression is limited to monocytes and neutrophils except under inflammation conditions (Crowe et al., 2019). However, mounting evidence has indicated an association of S100A9 with cancer, which may influence its use to detect post-infarction inflammation. For example, leukemia cells and aberrant cells from myelodysplastic syndromes have high S100A9 expression and release (Mondet et al., 2021). In such exceptional conditions, S100A9 expression in CECs may be marginally affected because CECs are not hematopoietic cells and have an extremely low count in the blood (Damani et al., 2012; Li et al., 2013).
Finally, our findings indicated that the expression of S100A9 was relatively stable with time, being elevated in AMI patients in both the short term and long term. Apart from acting as an early diagnostic biomarker, S100A9 may also serve as an indicator for chronic inflammation, supported by the observation from Müller et al. (2020) that a fall in serum S100A9 was associated with reduced cardiac inflammation.
SOCS3
SOCS3 contributes to the STAT3–JAK–SOCS3 pathway, which is usually activated by pro-inflammatory cytokines and switched off by SOCS3 (Murphy et al., 2016) and plays a prominent role in adipose regulation and leptin signaling (Scarpace et al., 2001; Gurzov et al., 2016). Emerging evidence indicates that JAK–STAT3 has a protective role in AMI by elevating the sensitivity of ischemic preconditioning (Yasukawa et al., 2012; Nohara et al., 2021), and the blockage of SOCS3 shows an effect on prevention of myocardial damage and ventricular reconstruction (Eid et al., 2018).
Figure 4E proposes a cooperative interaction between S100A9 and SOCS3 through pro-inflammatory cytokines such as IL-6 (Lee et al., 2012; Rodriguez-Barrueco et al., 2015). Other mechanisms for their interaction have also been uncovered. For instance, SOCS3 downregulates the activation of Akt, an inhibitor of S100A9 (Khan et al., 2020). It has also been discovered that SOCS3 can inhibit IL-1-induced NF-κB by targeting the TRAF-6/TAK1 complex, counterbalancing the effect of S100A9 (Frobøse et al., 2006).
Additionally, our findings showed that lower blood pressure and increased use of lipid-regulating drugs were related to SOCS3, which reflected the results of do Carmo et al. (2018) in model mice lacking SOCS3.
We observed that the expression of SOCS3 was less stable than that of S100A9 with time (Fig. 5C), reaching a peak 12 h after admission and starting to decline after that. SOCS3 expression was not appreciably different from control six months after AMI, suggesting its usefulness to detect recurrent infarction. This finding was consistent with that of Dhar et al. (2013), who discovered a significant reduction in SOCS3 expression in coronary artery smooth muscle cells of atherosclerotic swine.
Biomarkers in clinical practice
This study identified two possible diagnostic biomarkers of AMI, which were significantly up-regulated in the pathogenesis of AMI. Usually, blood samples are easily obtainable to measure the expression of biomarkers. However, when altered expression of biomarkers is observed, we should carefully exclude other factors affecting their expression other than post-infarction inflammation. For instance, blood cell proportions change in patients with infectious or hematological diseases. Besides, leukemia cells display increased expression and secretion of S100A9, and squamous carcinomas cells have up-regulated S100A9 expression (Li et al., 2019). Different from S100A9, which is only expressed by hematopoietic cells, SOCS3 is also expressed by non-hematopoietic cells such as neurons, muscle cells, hepatocytes, fibroblasts and adipocytes; thus, certain pathophysiological processes like neuron growth, leptin resistance and muscle stem cell responses may influence the expression of SOCS3 (Carow and Rottenberg, 2014). In these exceptional conditions, we should consider isolating monocytes or CECs from blood as samples for measurement.
Limitations
We acknowledge that our study has some limitations. Statistically, the robustness of the results was limited by the small number of samples. Moreover, further research is required to validate results obtained by bioinformatics.
MATERIALS AND METHODS
Data source
We retrieved publicly available datasets from the GEO (Gene Expression Omnibus, http://www.ncbi.nlm.nih.gov/geo) (Clough and Barrett, 2016) using the key searching terms “acute myocardial infarction” and filter “Homo sapiens”. Notably, we required that the GSE datasets contained both patients with AMI and normal people as a control group.
We retrieved six GSE datasets, GSE29532 (Silbiger et al., 2013), GSE34198 (Valenta et al., 2012), GSE48060 (Suresh et al., 2014), GSE60993 (Park et al., 2015), GSE62646 (Kiliszek et al., 2012) and GSE66360 (Muse et al., 2017) (Table 1), and initially treated GSE48060 and GSE66360 as training sets and the other four as test sets. We chose GSE48060 and GSE66360 as training sets for two reasons. On the one hand, we hoped to decrease technical bias as they were obtained from the same GPL platform. On the other hand, we preferred to identify biomarkers that were reproducible in various sample types by subsequent module preservation analysis, which necessitated two datasets from different sample types (Gibson, 2016). To confirm the reliability of our results even if the training and test datasets were replaced with others, we used every combination of two datasets as training sets, which yielded similar results (Supplementary Table S6).
Data pre-processing
Clinical data
We included only patients diagnosed with AMI and normal people as a control group. Specifically, GSE34198 provided concrete clinical information, including age, gender, weight, height, blood pressure, history of smoking and medication. Missing values in height, weight and blood pressure were imputed using the missForest function in the missForest package in R (Stekhoven and Bühlmann, 2012). All the clinical data were packed and uploaded as a supplementary file entitled “clin.zip”.
Gene expression matrix
We mapped microarray probes to the corresponding gene symbols according to the annotation information of the platform. For platforms GPL570 (GSE48060 and GSE66360), GPL6102 (GSE34198) and GPL6244 (GSE62646), we performed the mapping procedure with the AnnoProbe package (https://github.com/jmzeng1314/AnnoProbe/, accessed on 13 August 2021), for GPL6244 (GSE62646) with the idmap2 package (https://github.com/jmzeng1314/idmap2/, accessed on 13 August 2021), and for GPL5175 (GSE29532) with the SOFT file provided by the platform (https://ftp.ncbi.nlm.nih.gov/geo/series/GSE29nnn/GSE29532/soft/GSE29532_family.soft.gz, accessed on 13 August 2021). Probes without corresponding gene symbols were removed. Additionally, if two or more probes mapped to the same gene symbol, the maximum value of all probes was interpreted as the final expression value of the gene (Geng et al., 2020).
After the annotation of probes, we normalized each expression matrix using the limma package (Ritchie et al., 2015).
Identification of differentially expressed genes
As preliminary screening, we identified DEGs from expression profiles between AMI and control groups using the lmFit and eBayes functions in the limma package (Ritchie et al., 2015). FDR (P-value adjusted by the false discovery rate) less than 0.05 was considered statistically significant.
Weighted gene correlation network analysis
Module preservation analysis, one of the functions of WGCNA, is usually carried out to observe differences or reproducibility between various conditions (Langfelder et al., 2011). Here we describe in detail each of the steps performed by the WGCNA package (Langfelder and Horvath, 2008).
First, we excluded unqualified samples and genes that contained too many missing values, using the goodSamplesGenes function. We also detected and excluded outlier samples based on cluster analysis using the hclust and cutreeStatic function. Second, we obtained a proper soft threshold power value using the pickSoftThreshold function, which met the scale-free topology criterion (Zhang and Horvath, 2005), and tested the comparability of the two training datasets. Third, we constructed networks based on gene co-expression and identified modules of each training dataset. Finally, we carried out module preservation analysis of these two networks using the modulePreservation function, and obtained the correlation between modules using the corPvalueStudent function.
Identification of candidate genes
No consensus has been reached regarding the best ML algorithms (Li and Yang, 2005; Haury et al., 2011; Ogutu et al., 2012). To test which algorithm had the highest accuracy and should be used for gene selection, prior to data processing, we ran a pilot study of the diagnostic accuracy of nine common algorithms using 10% of the data and the caret package, and found that LASSO regression and SVM–RFE yielded the highest diagnostic accuracy (Supplementary Table S7). Thus, LASSO regression (Tibshirani, 1996), with 10-fold cross-validation (Browne, 2000) using cv.glmnet in the glmnet package (https://cran.r-project.org/web/packages/glmnet/), along with the SVM–RFE algorithm, with 10-fold cross-validation using the msvmRFE.R script (Zhou and Tuck, 2007), was used for further gene selection. To alleviate the small sample size problem, we implemented bootstrap aggregation in model training and validation. By the two ML methods, we obtained overlapping genes selected by both methods, which further underwent ROC analysis. Genes with a high harmonic mean (Ferger, 1931) of AUCs were considered candidate genes.
In an attempt to simplify the diagnostic model, we included several top candidate genes that made the model achieve at least 90% accuracy for the training sets.
Functional enrichment analysis
GO and KEGG pathway functional enrichment analysis of preserved modules
Aiming to explore the biological function and pathways of genes in the preserved modules, we applied GO (Gene Ontology Consortium, 2004) and KEGG pathway enrichment analysis (Kanehisa and Goto, 2000) using the clusterProfiler package (Yu et al., 2012). The results were visualized using the ggplot2 package (Wickham, 2011).
GSEA
To investigate biological states or processes involved in the pathogenesis of AMI, we conducted GSEA (Subramanian et al., 2005) using the Hallmark gene sets and the GSEA function in the clusterProfiler package. Gene sets with an adjusted P-value less than 0.05 were considered to be significantly enriched. Visualization of GSEA was achieved using the gseaplot2 function in the enrichplot package (https://bioconductor.org/packages/release/bioc/html/enrichplot.html, accessed on 15 August 2021).
Immune infiltration
To better understand changes of the immune microenvironment in AMI, we analyzed immune infiltration using the deconvolute_xcell function in the immunedeconv package (Sturm et al., 2020), a function that performs cell type enrichment analysis from gene expression data. Immune infiltration was visualized using the geom_half_violin function in the gghalves package (https://cran.r-project.org/web/packages/gghalves/index.html) and the corrplot.mixed function in the corrplot package (https://cran.r-project.org/web/packages/corrplot/index.html). In addition, we investigated the correlation between identified markers and infiltrating immune cells using the cor.test function, and implemented the visualization with the ggplot2 package.
Uncovering factors affecting gene expression
Clinical traits and gene expression
To assess how clinical traits affected gene expression, we used the glm function to achieve generalized linear regression and the forestplot function in the forestplot package for visualization (https://cran.r-project.org/web/packages/forestplot/, accessed on 15 August 2021). In addition, multicollinearity was evaluated using the vif function in the car package (https://cran.r-project.org/web/packages/car/index.html).
Tissue-specific expression
We detected qualitatively tissue-specific expression using the Heatmap function in the ComplexHeatmap package (Gu et al., 2016).
Time-dependent expression
We used the time-point information provided by GSE29532 and GSE62646 to assess gene expression at various time points.
CONCLUSION
In this study, by implementing several novel bioinformatics strategies, we identified S100A9 and SOCS3 as potential diagnostic biomarkers of AMI. Additionally, we demonstrated that inflammation and eight types of differently infiltrated cells (monocytes, epithelial cells, neutrophils, CD8+ T cells, Th2 cells, NK cells, NKT cells and platelets) were likely to play a key role in AMI. Furthermore, we assessed the correlation of the biomarkers with biological pathways involved in AMI, clinical traits, tissues and time points. These biomarkers and mechanisms warrant further exploration for improving the diagnosis and clinical management of AMI.
ACKNOWLEDGMENTS
We sincerely acknowledge the contributors to the GEO database who generously shared their valuable datasets. We also thank Dr. Jianming Zeng (University of Macau) and the members of his bioinformatics team for kindly sharing their coding experience. This research was funded by the National Natural Science Foundation of China (Grant No. 81871593 and No. 81701931) and by the Natural Science Foundation of Tianjin City (Grant No. 18JCQNJC10500).
REFERENCES
- Averill, M. M., Kerkhoff, C., and Bornfeldt, K. E. (2012) S100A8 and S100A9 in cardiovascular biology and disease. Arterioscler. Thromb. Vasc. Biol. 32, 223–229.
- Backteman, K., Ernerudh, J., and Jonasson, L. (2014) Natural killer (NK) cell deficit in coronary artery disease: no aberrations in phenotype but sustained reduction of NK cells is associated with low-grade inflammation. Clin. Exp. Immunol. 175, 104–112.
- Braunwald, E. (2012) Unstable angina and non-ST elevation myocardial infarction. Am. J. Respir. Crit. Care Med. 185, 924–932.
- Browne, M. W. (2000) Cross-validation methods. J. Math. Psychol. 44, 108–132.
- Cai, Z., Xie, Q., Hu, T., Yao, Q., Zhao, J., Wu, Q., and Tang, Q. (2020) S100A8/A9 in myocardial infarction: a promising biomarker and therapeutic target. Front. Cell Dev. Biol. 8, 603902.
- Carow, B., and Rottenberg, M. E. (2014) SOCS3, a major regulator of infection and inflammation. Front. Immunol. 5, 58.
- Carter, C. M. (2018) Alterations in blood components. Comprehensive Toxicology 12, 249–293.
- Clough, E., and Barrett, T. (2016) The gene expression omnibus database. Methods Mol. Biol. 1418, 93–110.
- Cotoi, O. S., Dunér, P., Ko, N., Hedblad, B., Nilsson, J., Björkbacka, H., and Schiopu, A. (2014) Plasma S100A8/A9 correlates with blood neutrophil counts, traditional risk factors, and cardiovascular disease in middle-aged healthy individuals. Arterioscler. Thromb. Vasc. Biol. 34, 202–210.
- Crowe, L. A. N., McLean, M., Kitson, S. M., Melchor, E. G., Patommel, K., Cao, H. M., Reilly, J. H., Leach, W. J., Rooney, B. P., Spencer, S. J., et al. (2019) S100A8 & S100A9: alarmin mediated inflammation in tendinopathy. Sci. Rep. 9, 1463.
- Dai, X., Wiernek, S., Evans, J. P., and Runge, M. S. (2016) Genetics of coronary artery disease and myocardial infarction. World J. Cardiol. 8, 1–23.
- Damani, S., Bacconi, A., Libiger, O., Chourasia, A. H., Serry, R., Gollapudi, R., Goldberg, R., Rapeport, K., Haaser, S., Topol, S., et al. (2012) Characterization of circulating endothelial cells in acute myocardial infarction. Sci. Transl. Med. 4, 126ra33.
- Daskalopoulos, E. P., Hermans, K. C. M., van Delft, L., Altara, R., and Blankesteijn, W. M. (2014) The role of inflammation in myocardial infarction. In Inflammation in Heart Failure. (eds.: Blankesteijn, M., and Altara, R.), pp. 39–65. Academic Press, London.
- de Vreede, J. J. M., Gorgels, A. P. M., Verstraaten, G. M. P., Vermeer, F., Dassen, W. R. M., and Wellens, H. J. J. (1991) Did prognosis after acute myocardial infarction change during the past 30 years? A meta-analysis. J. Am. Coll. Cardiol. 18, 698–706.
- Ding, Y., and Wilkins, D. (2006) Improving the performance of SVM-RFE to select genes in microarray data. BMC Bioinformatics 7, Suppl 2, S12.
- do Carmo, J. M., da Silva, A. A., Freeman, J. N., Wang, Z., Moak, S. P., Hankins, M. W., Drummond, H. A., and Hall, J. E. (2018) Neuronal suppressor of cytokine signaling 3: role in modulating chronic metabolic and cardiovascular effects of leptin. Hypertension 71, 1248–1257.
- Eid, R. A., Alkhateeb, M. A., Eleawa, S., Al-Hashem, F. H., Al-Shraim, M., El-Kott, A. F., Zaki, M. S. A., Dallak, M. A., and Aldera, H. (2018) Cardioprotective effect of ghrelin against myocardial infarction-induced left ventricular injury via inhibition of SOCS3 and activation of JAK2/STAT3 signaling. Basic Res. Cardiol. 113, 13.
- Engelbertsen, D., Andersson, L., Ljungcrantz, I., Wigren, M., Hedblad, B., Nilsson, J., and Björkbacka, H. (2013) T-helper 2 immunity is associated with reduced risk of myocardial infarction and stroke. Arterioscler. Thromb. Vasc. Biol. 33, 637–644.
- Ferger, W. F. (1931) The nature and use of the harmonic mean. J. Am. Stat. Assoc. 26, 36–40.
- Fracasso, B. d. M., Rangel, J. O., Machado, A. G., Curuja, F. S., Lopes, A., Olsen, V., Clausell, N., Biolo, A., Rohde, L. E., and Andrades, M. (2019) Characterization of advanced glycation end products and their receptor (RAGE) in an animal model of myocardial infarction. PLoS One 14, e0209964.
- Frangogiannis, N. G., Smith, C. W., and Entman, M. L. (2002) The inflammatory response in myocardial infarction. Cardiovasc. Res. 53, 31–47.
- Friedman, J., Hastie, T., Tibshirani, R., Narasimhan, B., Tay, K., Simon, N., and Qian, J. (2021) Package ‘glmnet’. CRAN R Repositary.
- Frobøse, H., Rønn, S. G., Heding, P. E., Mendoza, H., Cohen, P., Mandrup-Poulsen, T., and Billestrup, N. (2006) Suppressor of cytokine Signaling-3 inhibits interleukin-1 signaling by targeting the TRAF-6/TAK1 complex. Mol. Endocrinol. 20, 1587–1596.
- Gan, S. C., Beaver, S. K., Houck, P. M., MacLehose, R. F., Lawson, H. W., and Chan, L. (2000) Treatment of acute myocardial infarction and 30-day mortality among women and men. N. Engl. J. Med. 343, 8–15.
- Gene Ontology Consortium (2004) The Gene Ontology (GO) database and informatics resource. Nucleic Acids Res. 32, D258–D261.
- Geng, Z., Liu, J., Hu, J., Wang, Y., Tao, Y., Zheng, F., Wang, Y., Fu, S., Wang, W., Xie, C., et al. (2020) Crucial transcripts predict response to initial immunoglobulin treatment in acute Kawasaki disease. Sci. Rep. 10, 17860.
- Gibson, G. (2016) On the evaluation of module preservation. Cell Syst. 3, 17–19.
- Graff, L. G., Wang, Y., Borkowski, B., Tuozzo, K., Foody, J. M., Krumholz, H. M., and Radford, M. J. (2006) Delay in the diagnosis of acute myocardial infarction: effect on quality of care and its assessment. Acad. Emerg. Med. 13, 931–938.
- Gu, Z., Eils, R., and Schlesner, M. (2016) Complex heatmaps reveal patterns and correlations in multidimensional genomic data. Bioinformatics 32, 2847–2849.
- Gurzov, E. N., Stanley, W. J., Pappas, E. G., Thomas, H. E., and Gough, D. J. (2016) The JAK/STAT pathway in obesity and diabetes. FEBS J. 283, 3002–3015.
- Haury, A.-C., Gestraud, P., and Vert, J.-P. (2011) The influence of feature selection methods on accuracy, stability and interpretability of molecular signatures. PLoS One 6, e28210.
- Healy, A. M., Pickard, M. D., Pradhan, A. D., Wang, Y., Chen, Z., Croce, K., Sakuma, M., Shi, C., Zago, A. C., Garasic, J., et al. (2006) Platelet expression profiling and clinical validation of myeloid-related protein-14 as a novel determinant of cardiovascular events. Circulation 113, 2278–2284.
- Ibanez, B., James, S., Agewall, S., Antunes, M. J., Bucciarelli-Ducci, C., Bueno, H., Caforio, A. L. P., Crea, F., Goudevenos, J. A., Halvorsen, S., et al. (2018) 2017 ESC Guidelines for the management of acute myocardial infarction in patients presenting with ST-segment elevation: The Task Force for the management of acute myocardial infarction in patients presenting with ST-segment elevation of the European Society of Cardiology (ESC). Eur. Heart. J. 39, 119–177.
- Kanehisa, M., and Goto, S. (2000) KEGG: kyoto encyclopedia of genes and genomes. Nucleic Acids Res. 28, 27–30.
- Karam, N., Bataille, S., Marijon, E., Tafflet, M., Benamer, H., Caussin, C., Garot, P., Juliard, J.-M., Pires, V., Boche, T., et al. (2019) Incidence, msortality, and outcome-predictors of udden cardiac arrest complicating myocardial infarction prior to hospital admission. Circ. Cardiovasc. Interv. 12, e007081.
- Khan, M. G. M., Ghosh, A., Variya, B., Santharam, M. A., Ihsan, A. U., Ramanathan, S., and Ilangumaran, S. (2020) Prognostic significance of SOCS1 and SOCS3 tumor suppressors and oncogenic signaling pathway genes in hepatocellular carcinoma. BMC Cancer 20, 774.
- Kiliszek, M., Burzynska, B., Michalak, M., Gora, M., Winkler, A., Maciejak, A., Leszczynska, A., Gajda, E., Kochanowski, J., and Opolski, G. (2012) Altered gene expression pattern in peripheral blood mononuclear cells in patients with acute myocardial infarction. PLoS One 7, e50054.
- Krumholz, H. M., Merrill, A. R., Schone, E. M., Schreiner, G. C., Chen, J., Bradley, E. H., Wang, Y., Wang, Y., Lin, Z., Straube, B. M., et al. (2009) Patterns of hospital performance in acute myocardial infarction and heart failure 30-day mortality and readmission. Circ. Cardiovasc. Qual. Outcomes 2, 407–413.
- Kumrić, M., Tičinović Kurir, T., Borovac, J. A., and Božić, J. (2020) The role of natural killer (NK) cells in acute coronary syndrome: a comprehensive review. Biomolecules 10, 1514.
- Langfelder, P., and Horvath, S. (2008) WGCNA: an R package for weighted correlation network analysis. BMC Bioinformatics 9, 559.
- Langfelder, P., Luo, R., Oldham, M. C., and Horvath, S. (2011) Is my network module preserved and reproducible? PLoS Comput. Biol. 7, e1001057.
- Lee, M. J., Lee, J.-K., Choi, J. W., Lee, C.-S., Sim, J. H., Cho, C.-H., Lee, K.-H., Cho, I.-H., Chung, M.-H., Kim, H.-R., et al. (2012) Interleukin-6 induces S100A9 expression in colonic epithelial cells through STAT3 activation in experimental ulcerative colitis. PLoS One 7, e38801.
- Li, C., Wu, Q., Liu, B., Yao, Y., Chen, Y., Zhang, H., Wang, C., Cao, J., and Ge, S. (2013) Detection and validation of circulating endothelial cells, a blood-based diagnostic marker of acute myocardial infarction. PLoS One 8, e58478.
- Li, F., and Yang, Y. (2005) Analysis of recursive gene selection approaches from microarray data. Bioinformatics 21, 3741–3747.
- Li, Y., Kong, F., Jin, C., Hu, E., Shao, Q., Liu, J., He, D., and Xiao, X. (2019) The expression of S100A8/S100A9 is inducible and regulated by the Hippo/YAP pathway in squamous cell carcinomas. BMC Cancer 19, 597.
- Lin, Y., Weisdorf, D. J., Solovey, A., and Hebbel, R. P. (2000) Origins of circulating endothelial cells and endothelial outgrowth from blood. J. Clin. Invest. 105, 71–77.
- Liu, J., Yang, C., Liu, T., Deng, Z., Fang, W., Zhang, X., Li, J., Huang, Q., Liu, C., Wang, Y., et al. (2020) Eosinophils improve cardiac function after myocardial infarction. Nat. Commun. 11, 6396.
- Marinković, G., Grauen Larsen, H., Yndigegn, T., Szabo, I. A., Mares, R. G., de Camp, L., Weiland, M., Tomas, L., Goncalves, I., Nilsson, J., et al. (2019) Inhibition of pro-inflammatory myeloid cell responses by short-term S100A9 blockade improves cardiac function after myocardial infarction. Eur. Heart J. 40, 2713–2723.
- Marinković, G., Koenis, D. S., de Camp, L., Jablonowski, R., Graber, N., de Waard, V., de Vries, C. J., Goncalves, I., Nilsson, J., Jovinge, S., et al. (2020) S100A9 links inflammation and repair in myocardial infarction. Circ. Res. 127, 664–676.
- Melamed, K. H., and Goldhaber, S. Z. (2014) Cardiology Patient Page: inflammation and myocardial infarction. Circulation 130, e334–e336.
- Mondet, J., Chevalier, S., and Mossuz, P. (2021) Pathogenic roles of S100A8 and S100A9 proteins in acute myeloid and lymphoid leukemia: clinical and therapeutic impacts. Molecules 26, 1323.
- Müller, I., Vogl, T., Kühl, U., Krannich, A., Banks, A., Trippel, T., Noutsias, M., Maisel, A. S., van Linthout, S., and Tschöpe, C. (2020) Serum alarmin S100A8/S100A9 levels and its potential role as biomarker in myocarditis. ESC Heart Fail. 7, 1442–1451.
- Murphy, J. M., Babon, J. J., Nicola, N. A., and Nicholson, S. E. (2016) The JAK–STAT–SOCS signaling cascade. In Encyclopedia of Cell Biology. (eds.: Bradshaw, R. A., and Stahl, P. D.), pp. 136–152. Academic Press, Waltham.
- Muse, E. D., Kramer, E. R., Wang, H., Barrett, P., Parviz, F., Novotny, M. A., Lasken, R. S., Jatkoe, T. A., Oliveira, G., Peng, H., et al. (2017) A whole blood molecular signature for acute myocardial infarction. Sci. Rep. 7, 12268.
- Narumi, K., Miyakawa, R., Ueda, R., Hashimoto, H., Yamamoto, Y., Yoshida, T., and Aoki, K. (2015) Proinflammatory proteins S100A8/S100A9 activate NK cells via interaction with RAGE. J. Immunol. 194, 5539–5548.
- Neumann, J. T., Sörensen, N. A., Schwemer, T., Ojeda, F., Bourry, R., Sciacca, V., Schaefer, S., Waldeyer, C., Sinning, C., Renné, T., et al. (2016) Diagnosis of myocardial infarction using a high-sensitivity troponin I 1-hour algorithm. JAMA Cardiol. 1, 397–404.
- Nohara, S., Yamamoto, M., Yasukawa, H., Nagata, T., Takahashi, J., Shimozono, K., Yanai, T., Sasaki, T., Okabe, K., Shibata, T., et al. (2021) SOCS3 deficiency in cardiomyocytes elevates sensitivity of ischemic preconditioning that synergistically ameliorates myocardial ischemia reperfusion injury. PLoS One 16, e0254712.
- Ogutu, J. O., Schulz-Streeck, T., and Piepho, H.-P. (2012) Genomic selection using regularized linear regression models: ridge regression, lasso, elastic net and their extensions. BMC Proc. 6, Suppl 2, S10.
- Ong, S.-B., Hernández-Reséndiz, S., Crespo-Avilan, G. E., Mukhametshina, R. T., Kwek, X.-Y., Cabrera-Fuentes, H. A., and Hausenloy, D. J. (2018) Inflammation following acute myocardial infarction: multiple players, dynamic roles, and novel therapeutic opportunities. Pharmacol. Ther. 186, 73–87.
- Park, H.-J., Noh, J. H., Eun, J. W., Koh, Y-.S., Seo, S. M., Park, W. S., Lee, J. Y., Chang, K., Seung, K. B., Kim, P.-J., et al. (2015) Assessment and diagnostic relevance of novel serum biomarkers for early decision of ST-elevation myocardial infarction. Oncotarget 6, 12970–12983.
- Paul, G. K., Sen, B., Bari, M. A., Rahman, Z., Jamal, F., Bari, M. S., and Sazidur, S. R. (2010) Correlation of platelet count and acute ST-elevation in myocardial infarction. Mymensingh Med. J. 19, 469–73.
- Reed, G. W., Rossi, J. E., and Cannon, C. P. (2017) Acute myocardial infarction. Lancet 389, 197–210.
- Ritchie, M. E., Phipson, B., Wu, D., Hu, Y., Law, C. W., Shi, W., and Smyth, G. K. (2015) limma powers differential expression analyses for RNA-sequencing and microarray studies. Nucleic Acids Res. 43, e47.
- Rodriguez-Barrueco, R., Yu, J., Saucedo-Cuevas, L. P., Olivan, M., Llobet-Navas, D., Putcha, P., Castro, V., Murga-Penas, E. M., Collazo-Lorduy, A., Castillo-Martin, M., et al. (2015) Inhibition of the autocrine IL-6–JAK2–STAT3–calprotectin axis as targeted therapy for HR−/HER2+ breast cancers. Genes Dev. 29, 1631–1648.
- Scarpace, P. J., Matheny, M., and Tümer, N. (2001) Hypothalamic leptin resistance is associated with impaired leptin signal transduction in aged obese rats. Neuroscience 104, 1111–1117.
- Schiopu, A., and Cotoi, O. S. (2013) S100A8 and S100A9: DAMPs at the crossroads between innate immunity, traditional risk factors, and cardiovascular disease. Mediators Inflamm. 2013, 828354.
- Silbiger, V. N., Luchessi, A. D., Hirata, R. D., Lima-Neto, L. G., Cavichioli, D., Carracedo, A., Brión, M., Dopazo, J., García-García, F., dos Santos, E. S., et al. (2013) Novel genes detected by transcriptional profiling from whole-blood cells in patients with early onset of acute coronary syndrome. Clin. Chim. Acta 421, 184–190.
- Stekhoven, D. J., and Bühlmann, P. (2012) MissForest—non-parametric missing value imputation for mixed-type data. Bioinformatics 28, 112–118.
- Sturm, G., Finotello, F., and List, M. (2020) Immunedeconv: an R package for unified access to computational methods for estimating immune cell fractions from bulk RNA-sequencing data. Methods Mol. Biol. 2120, 223–232.
- Subramanian, A., Tamayo, P., Mootha, V. K., Mukherjee, S., Ebert, B. L., Gillette, M. A., Paulovich, A., Pomeroy, S. L., Golub, T. R., Lander, E. S., et al. (2005) Gene set enrichment analysis: a knowledge-based approach for interpreting genome-wide expression profiles. Proc. Natl. Acad. Sci. USA 102, 15545–15550.
- Suresh, R., Li, X., Chiriac, A., Goel, K., Terzic, A., Perez-Terzic, C., and Nelson, T. J. (2014) Transcriptome from circulating cells suggests dysregulated pathways associated with long-term recurrent events following first-time myocardial infarction. J. Mol. Cell. Cardiol. 74, 13–21.
- Thygesen, K., Alpert, J. S., Jaffe, A. S., Simoons, M. L., Chaitman, B. R., White, H. D., and Task Force for the Universal Definition of Myocardial Infarction (2012) Third universal definition of myocardial infarction. Eur. Heart J. 33, 2551–2567.
- Tian, C., Song, J., He, D., Wu, J., Sun, Z., and Sun, Z. (2018) Predictive value of mean platelet volume/platelet count for prognosis in acute myocardial infarction. Int. Heart J. 59, 286–292.
- Tibshirani, R. (1996) Regression shrinkage and selection via the lasso. J. R. Statist. Soc. B 58, 267–288.
- Valenta, Z., Mazura, I., Kolář, M., Grünfeldová, H., Feglarová, P., Peleška, J., Tomečková, M., Kalina, J., Slovák, D., and Zvárová, J. (2012) Determinants of excess genetic risk of acute myocardial infarction - a matched case-control study. Eur. J. Biomed. Inform. 8, 34–43.
- Wickham, H. (2011) ggplot2. Wiley Interdiscip. Rev. Comput. Stat. 3, 180–185.
- Yasukawa, H., Nagata, T., Oba, T., and Imaizumi, T. (2012) SOCS3: a novel therapeutic target for cardioprotection. JAKSTAT 1, 234–240.
- Yu, G., Wang, L.-G., Han, Y., and He, Q.-Y. (2012) clusterProfiler: an R package for comparing biological themes among gene clusters. OMICS 16, 284–287.
- Zhang, B., and Horvath, S. (2005) A general framework for weighted gene co-expression network analysis. Stat. Appl. Genet. Mol. Biol. 4, Article17.
- Zhang, L., Wang, Z., Wang, D., Zhu, J., and Wang, Y. (2018) CD8+ CD28+ T cells might mediate injury of cardiomyocytes in acute myocardial infarction. Mol. Immunol. 101, 74–79.
- Zhou, X., and Tuck, D. P. (2007) MSVM-RFE: extensions of SVM-RFE for multiclass gene selection on DNA microarray data. Bioinformatics 23, 1106–1114.