INTRODUCTION
RNA silencing refers comprehensively to gene silencing phenomena that are induced by nucleotide sequence-specific interactions involving RNA (Voinnet, 2002; Matzke et al., 2004). RNA silencing was discovered first in transgenic petunia plants, in which both a transgene and its homologous endogenous gene are downregulated (Napoli et al., 1990; van der Krol et al., 1990). Later studies, including the discovery of RNA interference (Fire et al., 1998), demonstrated that double-stranded RNA (dsRNA) is a trigger for reactions responsible for RNA silencing. The reactions involve processing of dsRNA into short interfering RNAs (siRNAs) that are 21–24 nt long by RNaseIII-type dsRNA endonuclease, called Dicer or Dicer-like, and cleavage of target RNA by the RNA-induced silencing complex that contains a member of the Argonaute proteins. In addition, RNA-dependent RNA polymerase forms dsRNA using single-stranded RNA to trigger or amplify the reactions (Baulcombe, 2004). Pathways of RNA silencing also include induction of epigenetic changes in nuclei via cytosine methylation and histone modification, and downregulation of gene expression mediated by microRNAs (Bologna and Voinnet, 2014; Matzke et al., 2015). Although first discovered in a transgenic plant, RNA silencing has been detected in endogenous genes in non-transgenic plants. Some altered phenotypes of plants, including those manifested as visibly altered phenotypes, are ascribed to such natural RNA silencing (Kanazawa, 2008). The earliest known phenomena of natural RNA silencing were those manifested in the presence or absence of pigmentation in soybean seed coats (Senda et al., 2004; Tuteja et al., 2004), in various parts of maize plants (Della Vedova et al., 2005) and in specific portions of petunia petals (Koseki et al., 2005).
Seed coat color of soybean is controlled by three loci, I, R and T. While the R and T loci determine the types of anthocyanin pigments and proanthocyanidins in seed coats, the I locus determines the spatial distribution and presence or absence of the pigments (Senda et al., 2012). Four alleles have been found for the I locus, namely I, ii, ik and i. The presence and absence of pigments in the entire seed coat are conferred by the i and I alleles, respectively. The ii and ik alleles are responsible for lack of pigmentation in specific portions of seed coats, namely portions other than the hilum and a saddle-shaped region, respectively. The inhibition of pigmentation by the I and ii alleles is caused by RNA silencing of chalcone synthase (CHS) genes (Senda et al., 2004; Tuteja et al., 2004), which encode a key enzyme in the biosynthesis of anthocyanins and proanthocyanidins. A wild ancestor of cultivated soybean produces brown or black seed coats, and the phenotypes caused by natural CHS RNA silencing were generated during or after domestication of soybean. The CHS genes in soybean constitute a multigene family. Early studies identified nine family members (CHS1–CHS9) (Akada and Dube, 1995; Tuteja and Vodkin, 2008). A phylogenetic analysis of the nucleotide sequences of these genes indicated that they were classified into two subfamilies, one comprising CHS7 and CHS8 and the other CHS1–CHS6 and CHS9 (Kurauchi et al., 2009). A recent in silico analysis detected five additional genes, CHS10–CHS14. A phylogenetic analysis indicated that CHS10–CHS12 were grouped with CHS1–CHS6 and CHS9, while CHS13 and CHS14 were grouped into distinct clades (Anguraj Vadivel et al., 2018). Among the multiple CHS genes, CHS7/CHS8 transcripts constitute most CHS transcripts in pigmented seed coats (Kasai et al., 2004; Tuteja et al., 2004).
On the basis of structural analysis of the I locus, models that explain the induction of CHS RNA silencing in seed coats of soybean, and in particular the production of CHS dsRNAs, have been proposed. The ii allele of the I locus contains a 10.4-kb inverted repeat (IR) comprising a CHS4-CHS3-CHS1 gene cluster (Clough et al., 2004). In a proposed model, the promoter of a subtilisin gene adjacent to the CHS gene cluster produces antisense transcripts of CHS1, which then form dsRNA with CHS1 sense transcripts in the ii allele (Xie et al., 2019). Similarly, in another proposed model, chimeric transcripts comprising the subtilisin gene, antisense-CHS1 and sense-CHS3 fragments form dsRNA through base pairing between the CHS1 and CHS3 regions of the transcripts in the ii allele (Jia et al., 2020).
On the other hand, the I allele of the I locus contains a gene called GmIRCHS comprising a 1,087-bp IR of a pseudoCHS gene sequence, ΔCHS3, and the 5′ portion of GmJ1 encoding a type III DnaJ-like protein (Kasai et al., 2007). An RNase protection assay demonstrated that the IR of ΔCHS3 is transcribed and intramolecular dsRNA is formed (Kurauchi et al., 2011). In a model for the induction of RNA silencing by the I allele, dsRNA that is formed by GmIRCHS transcripts provides primary siRNAs via processing with a Dicer-like protein(s), which subsequently induce secondary siRNA production from multiple CHS transcripts, whereby CHS mRNAs are extensively degraded (Senda et al., 2012). Subsequent analysis of spontaneous mutants that had pigmented seed coats derived from cultivars that produce nonpigmented seed coats revealed that these plants underwent structural changes that involve complete or partial loss of GmIRCHS, which indicates the plausibility of the model (Senda et al., 2013).
In the present study, we newly analyzed a mutant that has pigmented seed coats and was derived from a population of mutagenized cv. Suzuyutaka, a cultivar that has nonpigmented seed coats characteristic of the I allele. We characterized the reverted, pigmented phenotype and found that CHS mRNA is degraded in the original cultivar but not in the mutant. Our data indicate that a structural change at the I locus eliminates IR structure and causes the reversion to pigmented seed coats, and that the change occurs at a position close to, but different from, those previously identified in the spontaneous mutants discussed above. We also profiled small RNAs, revealing a commonality in RNA degradation of natural CHS RNA silencing between different plant species.
RESULTS
Changes in the expression of CHS genes in a mutant with pigmented seed coats
The mRNA levels of CHS genes were analyzed in the seed coat tissues of the wild type and the seed coat-pigmented mutant (Fig. 1A). Among the CHS family members, CHS7 and CHS8 are known to be highly expressed in pigmented seed coats of soybean and are silenced in nonpigmented seed coats (Kasai et al., 2004; Tuteja et al., 2004); we thus focused our analysis on these genes. Quantitative reverse transcription-PCR (qRT-PCR) analyses using primers that specifically amplify the CHS7 gene and those that amplify both the CHS7 and CHS8 genes were done (Fig. 1B, 1C). In both experiments, the mRNA level was significantly higher in the mutant than in the wild type, which indicates that restoration of pigmentation in seed coats is associated with restoration of the CHS mRNA level from the state caused by RNA silencing. Next, we analyzed structural changes involving the CHS genes that prevented induction of RNA silencing of the CHS genes in seed coats.

Fig. 1. Seed coat phenotypes and CHS expression in wild-type and mutant cv. Suzuyutaka. (A) Seed coats. (B, C) mRNA levels in seed coats for CHS7 (B) and CHS7 and CHS8 (C). mRNA levels of the CHS genes are relative to that of the F-box gene in the wild type, which was set as 1. Data are means and standard errors obtained from five biological replicates. * P < 0.05, ** P < 0.01, Mann–Whitney U test. W, wild type; M, mutant.
Structural changes in the genomic DNA regions that contain the CHS genes in the mutant
Structural changes in DNA regions that contain CHS genes were examined by DNA gel blot analysis (Fig. 2). Using probes that can detect CHS1–CHS9 of the CHS gene family (Senda et al., 2002, 2013), we found a 1.2-kb BclI-digested fragment in the mutant instead of the 6.1-kb fragment that characterizes the wild type, suggesting structural changes around a CHS gene located in this fragment.

Fig. 2. Structural changes involving CHS genes assessed by DNA gel blot analysis. Total DNA from the wild type and mutant was digested with BclI, and after electrophoresis the gel blot was probed with labeled DNA fragments that hybridize with CHS1–CHS9. Estimated sizes of hybridized fragments are indicated. Note that the 1.2-kb fragment was specific to the mutant DNA. W, wild type; M, mutant.
Because of the obvious phenotypic change, we assumed that the structural changes detected by the CHS probe involve the GmIRCHS-ICHS1 cluster, which includes a candidate causal gene of the CHS RNA silencing by allele I. We focused on specific structural changes that were previously identified during the generation of spontaneous mutant plants that produce pigmented seed coats (Senda et al., 2013) and tested whether the mutant here had similar changes. A structural change previously identified was a deletion of the DNA region that contains the GmIRCHS–ICHS1 cluster. One end of the deleted region was within the GmIRCHS–ICHS1 cluster and the other was either within or flanking a cytochrome P450 gene (Senda et al., 2013). Although the boundaries of the deletion vary, the deletion always results in the loss of the IR in GmIRCHS.
We tested for the deletion in this region using a primer set that was designed to anneal to ICHS1 and the flanking region of the cytochrome P450 gene (Fig. 3A). We obtained a PCR product from the mutant but not from the wild type, which suggests that the mutant did indeed have the deletion in this region (Fig. 3B). Nucleotide sequence analysis of the PCR-amplified product showed that the DNA sequence comprises the 5′ portion of ICHS1 and the flanking sequence of the cytochrome P450 gene (Fig. 3D). The positions in ICHS1 and in the flanking region of cytochrome P450 gene differed from those previously identified, but were near them (Supplementary Fig. S1).
Amplification of a DNA region encompassing ICHS1 and its surrounding regions from the mutant and subsequent digestion by BclI generated DNA fragments including a 1.2-kb fragment (Fig. 3C). This result explained the generation of the hybridization signal of the same size in the DNA gel blot analysis of the mutant DNA (Fig. 2).
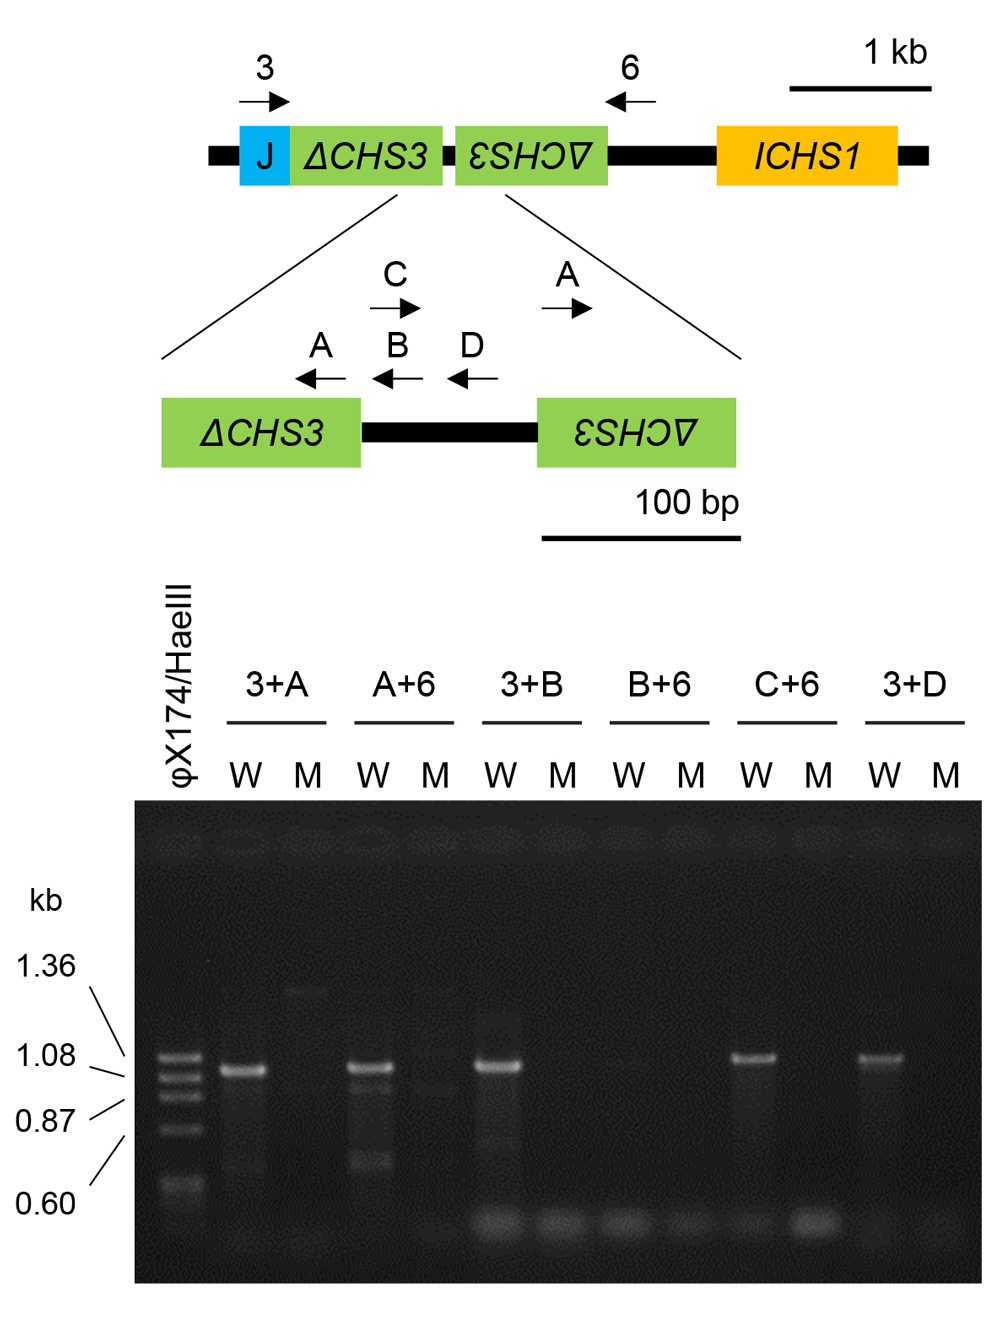
Using PCR with primers designed to anneal to the interior or regions adjacent to ΔCHS3 of GmIRCHS, we also confirmed that this structural change accompanied the lack of GmIRCHS in the mutant (Fig. 4). Amplification using all primer sets, except for the combination of primers B and 6 used for a negative control, generated a product from the wild type but not from the mutant, which indicated that GmIRCHS was missing in the mutant.
Characterization of CHS RNA degradation in seed coat tissues in terms of siRNA production
Because production of siRNA is a hallmark of RNA silencing, we analyzed siRNAs in seed coats of the wild type and mutant by deep sequencing. Of 41,297,244 reads, 63,427 reads matched the CHS7 gene region in the wild type (Supplementary Table S1). The size distribution of siRNAs mapped to the CHS7 gene revealed the predominance of siRNA of 21 nt for both sense and antisense strands among 21–24-nt size classes of siRNAs (Fig. 5). siRNAs were mostly mapped to exon 2 (Fig. 6). The level of siRNAs corresponding to CHS7 was very low in the mutant, consistent with the restoration of pigmentation from the silenced phenotype (Figs. 5, 6). We also mapped siRNAs on ΔCHS3 of GmIRCHS. While abundant 21-nt siRNAs were mapped on the ΔCHS3 sequence, the level of 22-nt siRNA mapped on the ΔCHS3 sequence was also high in the wild type (Fig. 7; discussed later in detail). As expected from the IR structure, siRNAs were mapped widely on the ΔCHS3 sequence in the wild type. In parallel with the lack of GmIRCHS, few siRNAs were mapped on the ΔCHS3 sequence in the mutant (Figs. 7, 8); these are likely derived from CHS3 and/or other CHS genes, given the presence of nucleotide sequence similarity between CHS3 and these genes (Kurauchi et al., 2009).
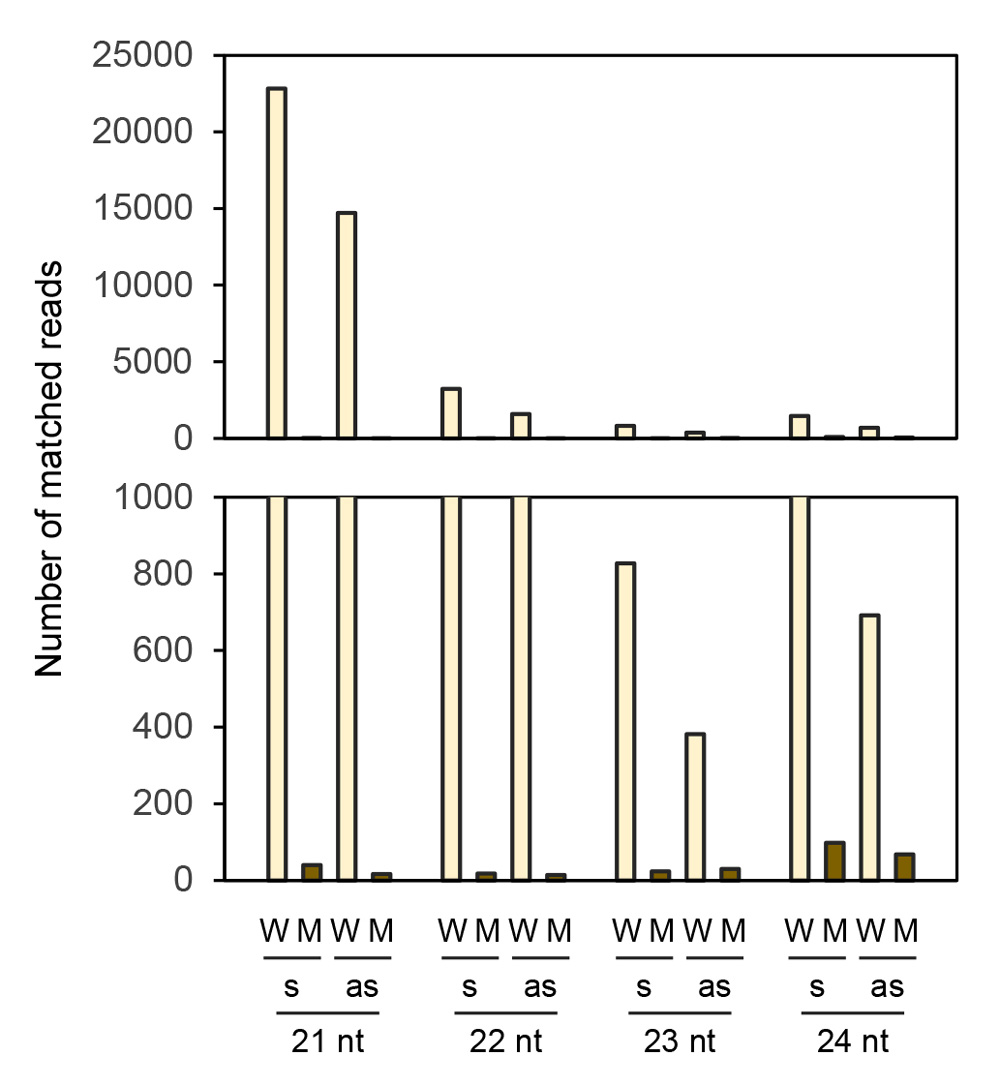
Fig. 5. Frequency of siRNAs between 21 and 24 nt mapped on the CHS7 gene. Numbers of siRNAs mapped on the sense (s) and antisense (as) strands are indicated. An enlargement of the region from 0–1,000 reads is shown below. W, wild type; M, mutant.
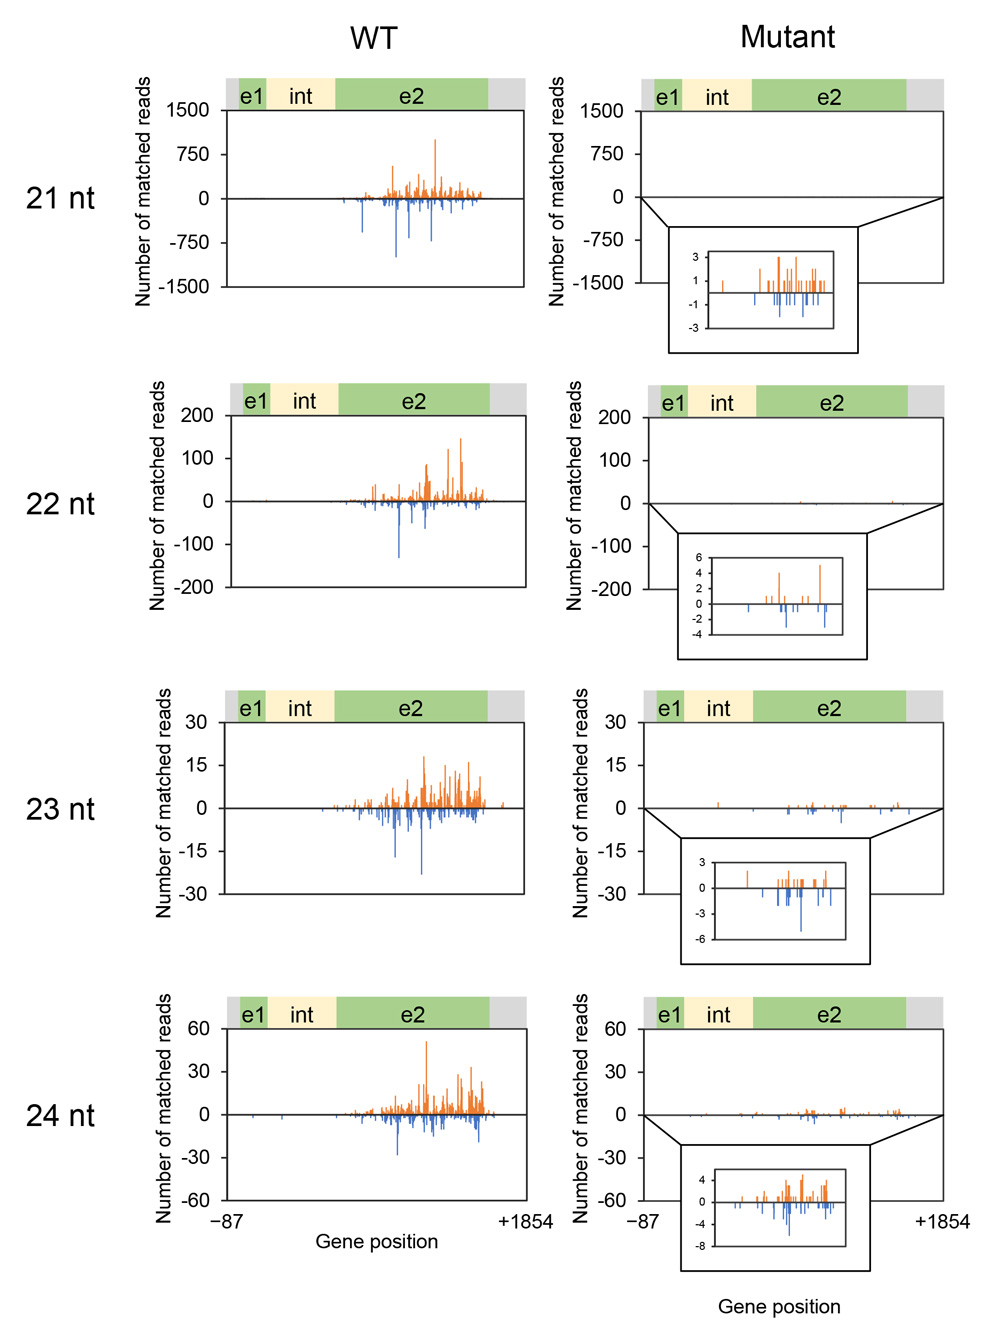
Fig. 6. Position and abundance of siRNAs mapped on the CHS7 gene region. Data for 21-nt, 22-nt, 23-nt and 24-nt siRNAs in the wild type and mutant are shown. The x-axis indicates positions in the CHS7 gene. Bars above (with plus value) and below (with minus value) the x-axis indicate siRNAs mapped on the sense and antisense strands, respectively. A detail of the siRNA data is inserted when the level was very low. Nucleotide positions are numbered relative to the first nucleotide of the ATG codon. e1, exon 1; e2, exon 2; int, intron.
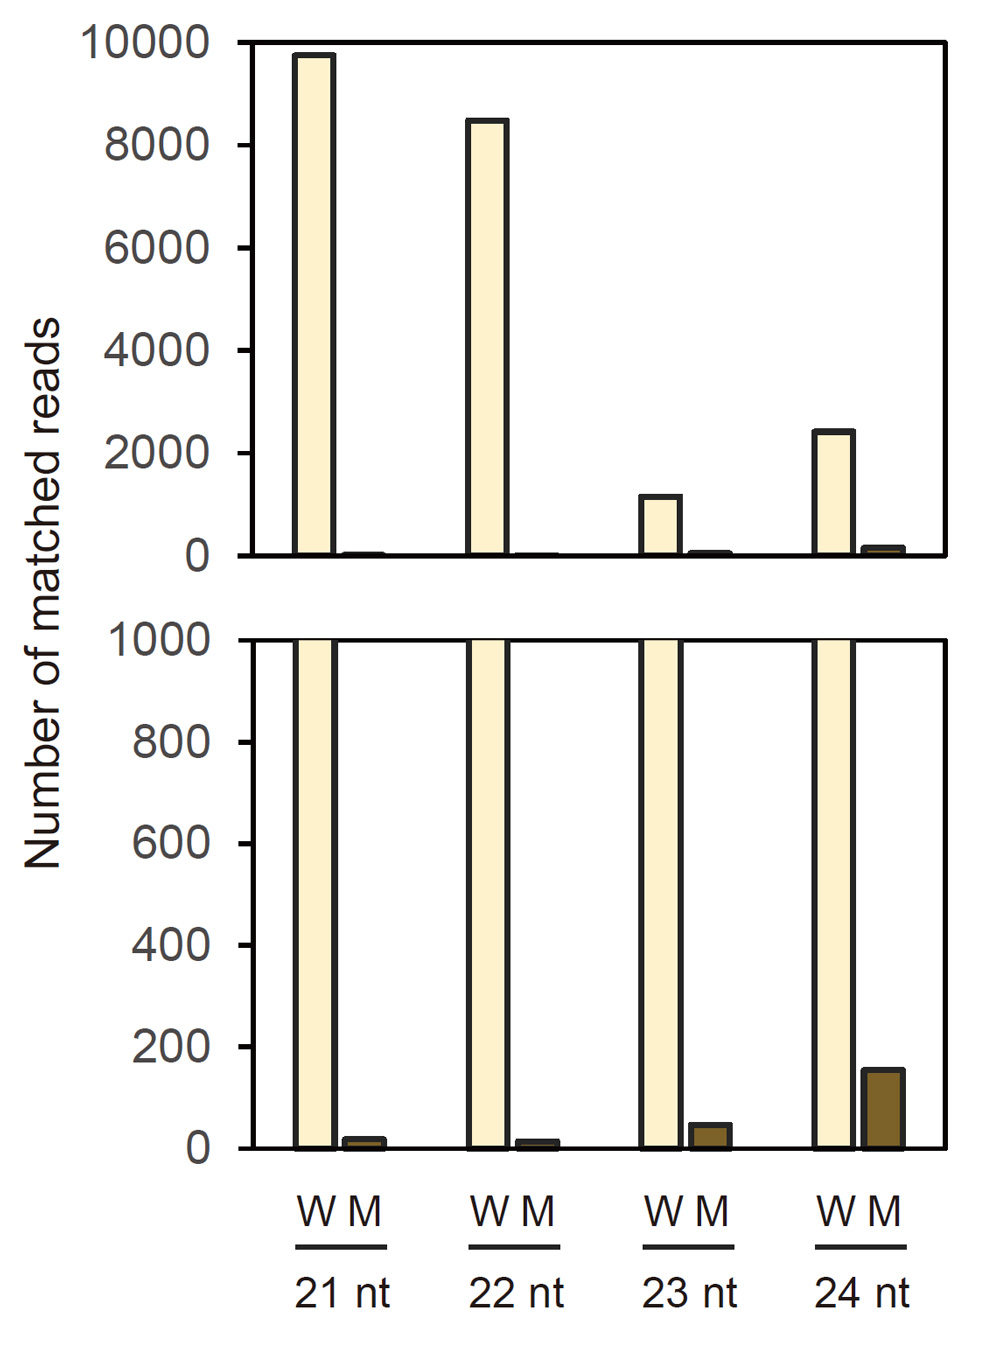
Fig. 7. Frequency of siRNAs between 21 and 24 nt mapped on GmIRCHS. Numbers of siRNAs mapped are indicated. An enlargement of the region from 0–1,000 reads is shown below. Only sense strand data are shown because of the inverted repeat organization of ΔCHS3. W, wild type; M, mutant.
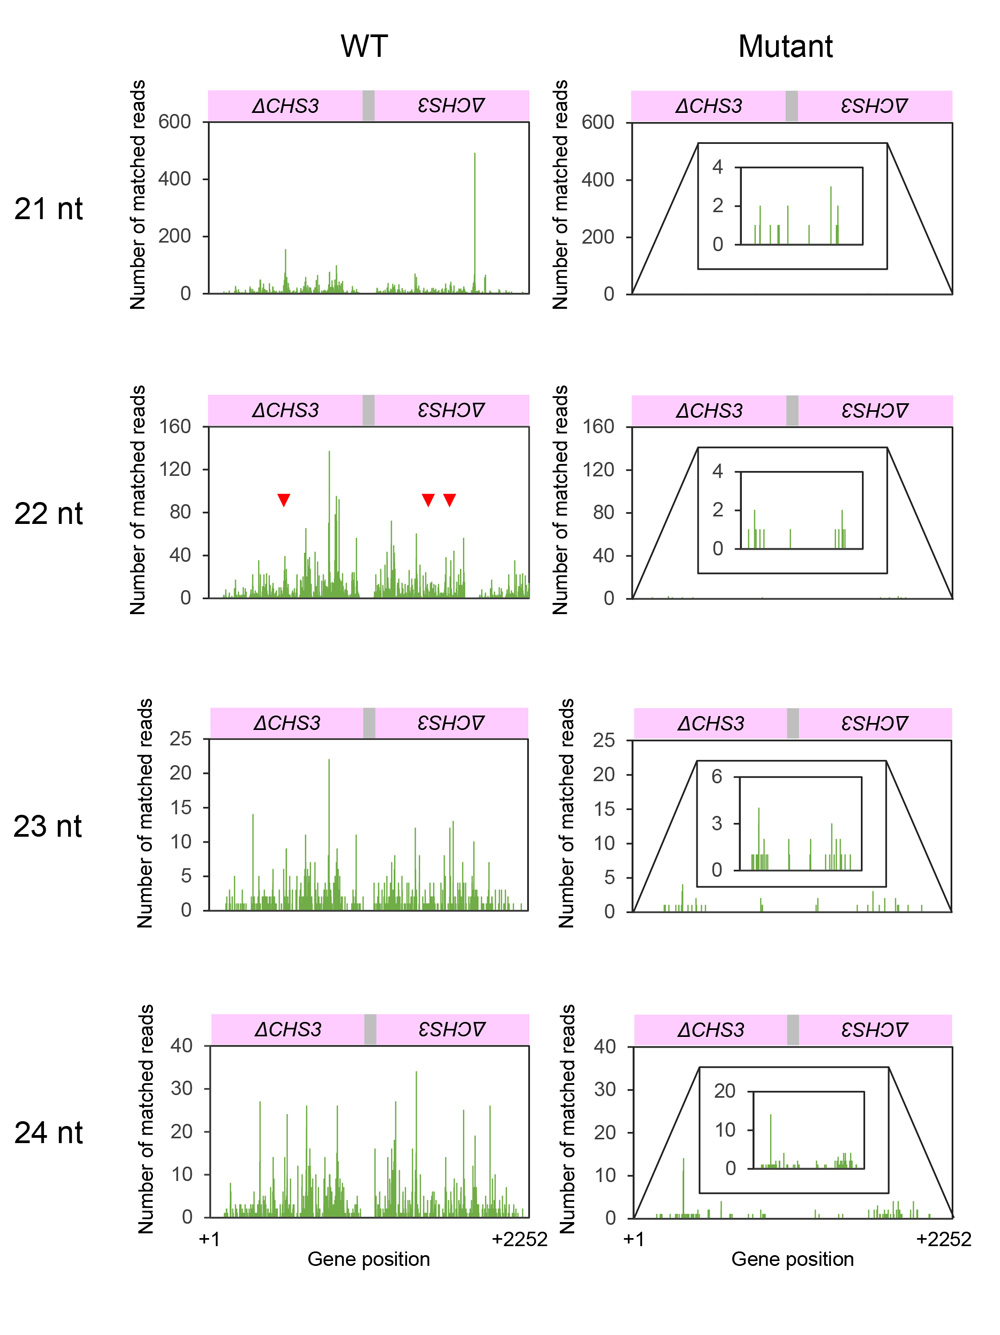
Fig. 8. Position and abundance of siRNAs mapped on GmIRCHS. Data for 21-nt, 22-nt, 23-nt and 24-nt siRNAs in the wild type and mutant are shown. The x-axis indicates positions in the ΔCHS3 inverted repeat. A detail of the siRNA data is inserted when the level was very low. Only sense strand data are shown because of the inverted repeat organization of ΔCHS3. Positions of 22-nt siRNAs mapped to the terminal positions of the regions producing phased siRNAs of the CHS7 gene are indicated by red arrowheads. Nucleotide positions are numbered relative to the first nucleotide of the ΔCHS3 inverted repeat.
In Arabidopsis, cleavage of transcripts by a small RNA can result in in-phase generation of 21-nt secondary siRNAs by DICER-LIKE (DCL) 4 after production of dsRNA by RNA-DEPENDENT RNA POLYMERASE (RDR) 6 (Vazquez et al., 2004; Allen et al., 2005). Such in-phase generation of 21-nt siRNAs was also detected in natural RNA silencing and co-suppression of the CHS-A genes in petunia (Kasai et al., 2013). To detect phased siRNAs, we mapped siRNAs of the CHS7 gene in 21 different phases. Figure 9 shows the distribution of 21-nt phased siRNAs that are contiguous for three or more units in each phase in the CHS7 gene. These phased siRNAs were detected in all 21 phases in wild-type plants for both sense and antisense strands (Fig. 9).
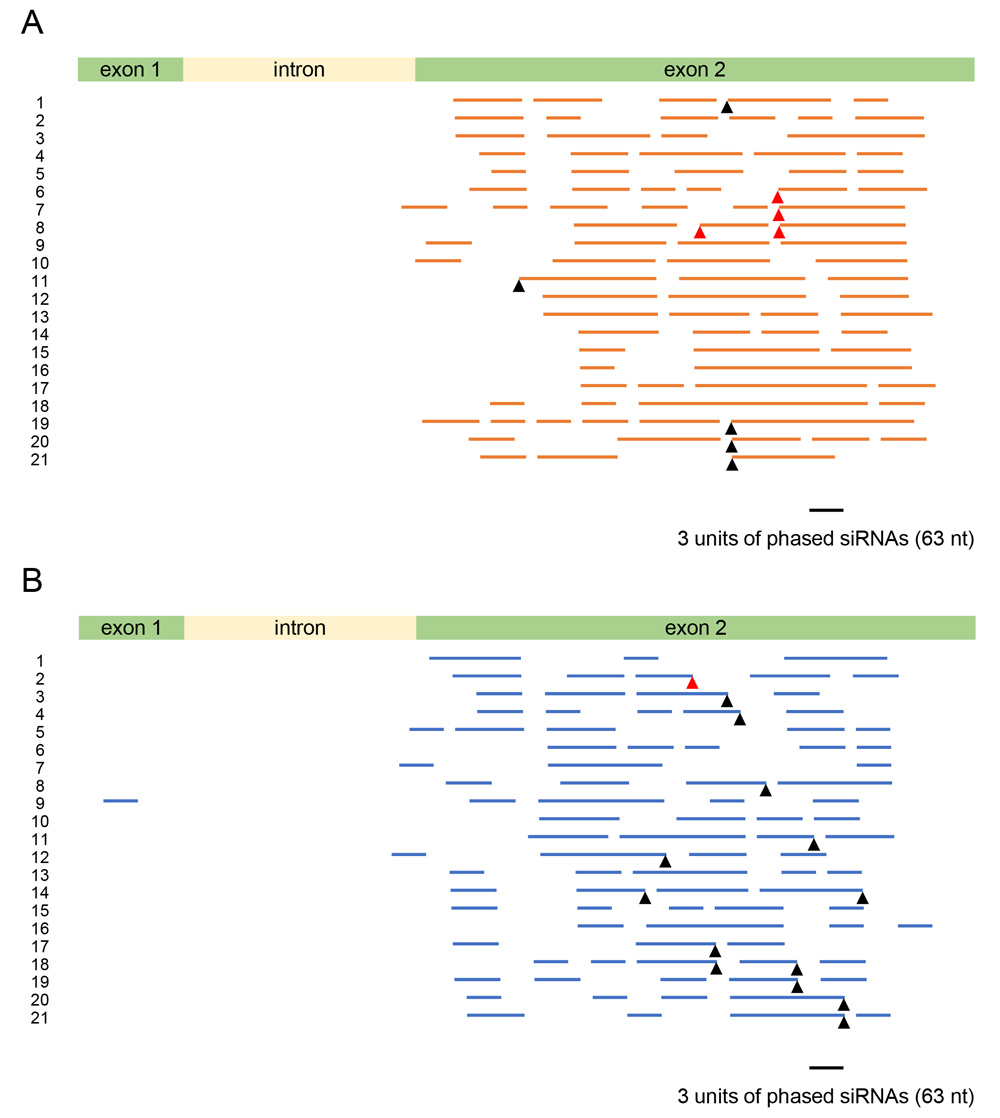
The phased siRNA-producing region encompassed a large portion of exon 2 of the CHS7 coding region. The maximum number of contiguous units was 20, covering a 420-nt region, for the sense strand (phase No. 18) and 12, covering a 252-nt region, for the antisense strand (phase No. 12) (Fig. 9). Overall, these data indicate that phased siRNAs were produced in multiple phases at multiple sites over exon 2 in the wild-type plants. We calculated the phasing score of Howell et al. (2007), which reflects both siRNA abundance and number of positions occupied by siRNA reads in a given phase. The values were as high as 40 (Fig. 10A–10D), comparable to the scores found in natural RNA silencing and co-suppression in petunia (30–40; Kasai et al., 2013).

A decrease in the levels of 22-nt siRNAs after knockout of DCL2 orthologs caused the seed coats to change from yellow to brown in a soybean line carrying the ii allele (Jia et al., 2020). Considering that 22-nt microRNAs trigger the production of phased, secondary siRNAs (Chen et al., 2010), Jia et al. (2020) suggested that the 22-nt CHS siRNAs induce the production of 21-nt CHS siRNAs. Prompted by this finding, we investigated whether 22-nt siRNAs were mapped to the terminal positions of the regions producing phased siRNAs.
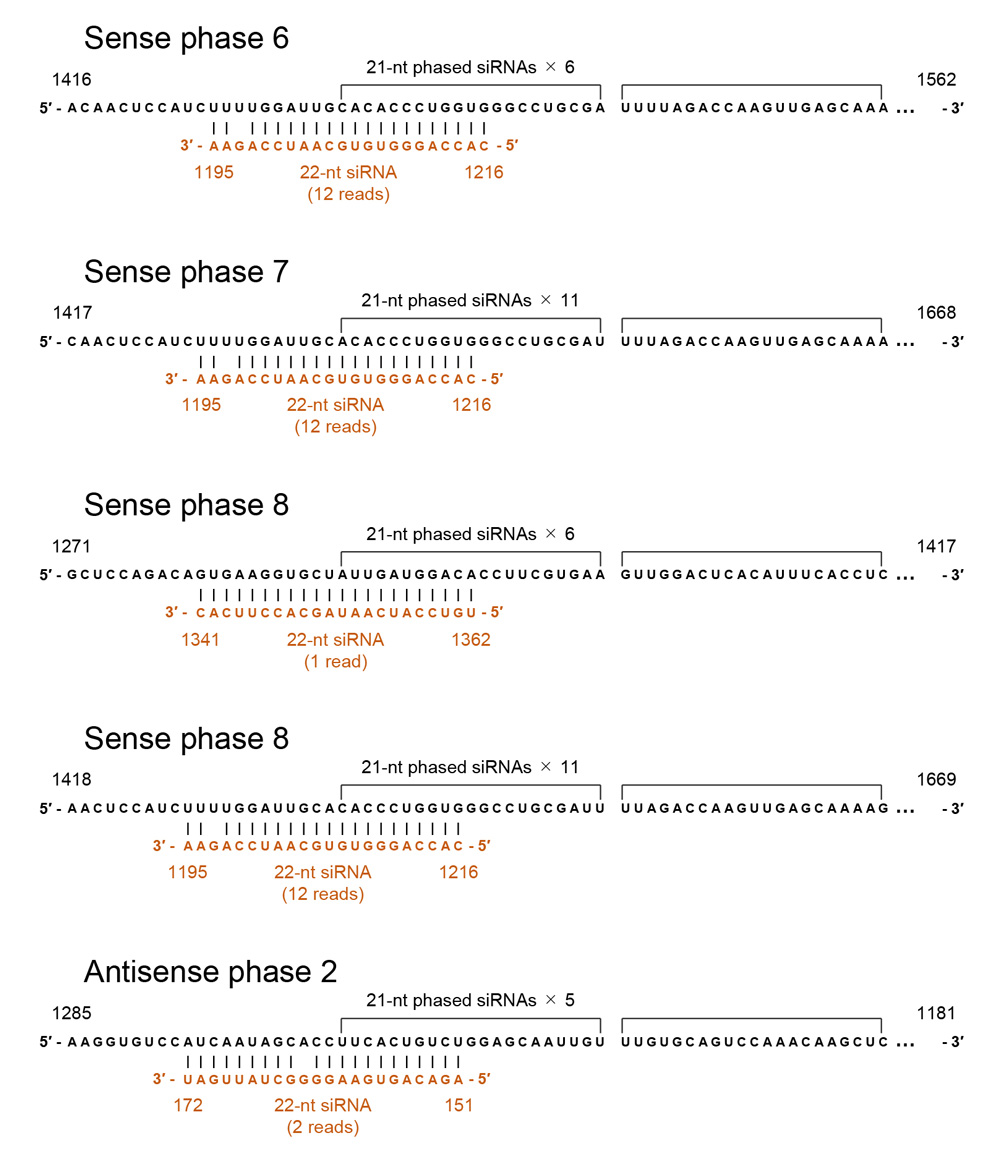
When phased siRNA production is induced via RNA cleavage by 22-nt small RNAs (microRNAs or trans-acting siRNAs), the RNA cleavage normally occurs at the opposite position between the 10th and 11th nucleotides from the 5′ end of the small RNAs (Chen et al., 2010). Meanwhile, RNA cleavage by siRNAs often appeared to occur at multiple nucleotide positions (e.g., Yoshikawa et al., 2005). Taking into account these possibilities, we examined the presence or absence of 22-nt siRNAs whose central or adjacent positions correspond to potential RNA cleavage sites that were located at the terminal positions of phased siRNA arrays. Such 22-nt siRNAs were indeed detected (shown by triangles in Fig. 9) and, moreover, among the siRNAs that were mapped at the ΔCHS3 sequence of GmIRCHS (shown by red triangles in Fig. 9), consistent with the notion that ΔCHS3 RNA provides siRNAs to trigger massive production of 21-nt secondary siRNAs of the CHS7 gene. These siRNAs, together with their potential target sequences, are shown in Figure 11; an example of a phased siRNA array is shown in Supplementary Figure S2. The data shown in the 1st, 2nd and 4th examples in Figure 11 suggest that phased siRNAs were produced from neighboring phases, the 5′ end of which was mapped at positions that differed by one nucleotide, while the same 22-nt siRNA was mapped at the terminal positions of phased siRNA arrays. These observations may indicate that phase setting via RNA cleavage occurs at multiple nucleotide positions by the same siRNA. Similar production of phased siRNAs from neighboring phases was suggested in natural RNA silencing and co-suppression in petunia (Kasai et al., 2013). These observations may also be relevant to a 1-nt shift of siRNA production relative to the phase set by a trans-acting siRNA detected in Arabidopsis (Chen et al., 2007). Taken together, these data suggest commonality in the pattern of siRNA production in natural CHS RNA silencing between distantly related species and that the altered DNA structure abolished phased siRNA production.
DISCUSSION
Through a comparative analysis of genomic DNA regions that contain the CHS genes between the seed coat-pigmented mutant and wild type, we found a deletion in the mutant and that one end of the deletion is located in the ICHS1 gene and the other end in an upstream portion of the cytochrome P450 gene. Although the mutant was found in a plant population obtained by mutagenesis, whether the mutation is a direct consequence of the mutagenesis is not known. Considering that the sites of structural change were close to those found in spontaneous mutants, the structural change is likely related to an intrinsic feature associated with the chromosomal regions. We found that these regions have two notable properties. First, most of the end positions of the deletions were present in regions that can form secondary structures (Supplementary Figs. S3, S4). Second, these DNA regions are AT-rich: the 300-bp DNA regions shown in Supplementary Figures S3 and S4 have an AT content of 76% in the upstream portion of the cytochrome P450 gene and 66% in the ICHS1 gene. Although these features may be neither necessary nor sufficient for inducing the structural changes, it is likely that these regions are less stable and may be vulnerable to rearrangements.
We have not been able to determine the internal region of the deletion using a PCR-based approach, being hindered by the presence of duplicated segments in the genome. A recent pan-genome analysis of soybean indeed indicated the presence of repeated DNA segments as a consequence of multiple structural rearrangements at the I locus that could have occurred during evolution (Liu et al., 2020). Our ongoing analysis of advanced resequencing data of a cultivar that confers the I allele will reveal the entire picture of the structural changes that occurred in the process of reversion to the pigmented seed coat phenotype.
We found that siRNAs were mostly produced from exon 2 of the CHS7 gene. This feature was also detected previously in CHS RNA silencing in soybean (Kurauchi et al., 2009; Tuteja et al., 2009). We also found that 21-nt siRNAs were predominant and produced in all 21 phases. Both these features are essentially common to those detected in natural RNA silencing and co-suppression in petunia (Kasai et al., 2013) and differ from those detected in trans-acting siRNA production triggered by microRNAs, in which production of phased siRNAs is confined to one or a small number of phases (Axtell et al., 2006). The predominance of 21-nt siRNA in these RNA silencing systems also differs from the feature of siRNAs produced from transposable elements, in which 24-nt siRNA is predominant (Kasschau et al., 2007). A unique observation in the case of the CHS RNA silencing in soybean is that more siRNAs were produced in a particular phase (phase 11) for antisense RNA, which was evident in the phasing registers (Fig. 10E, 10F). We found that the three most abundant siRNAs of the antisense strand were produced in this phase. These data indicate that phased siRNAs of the antisense strand were somehow produced unequally between different phases.
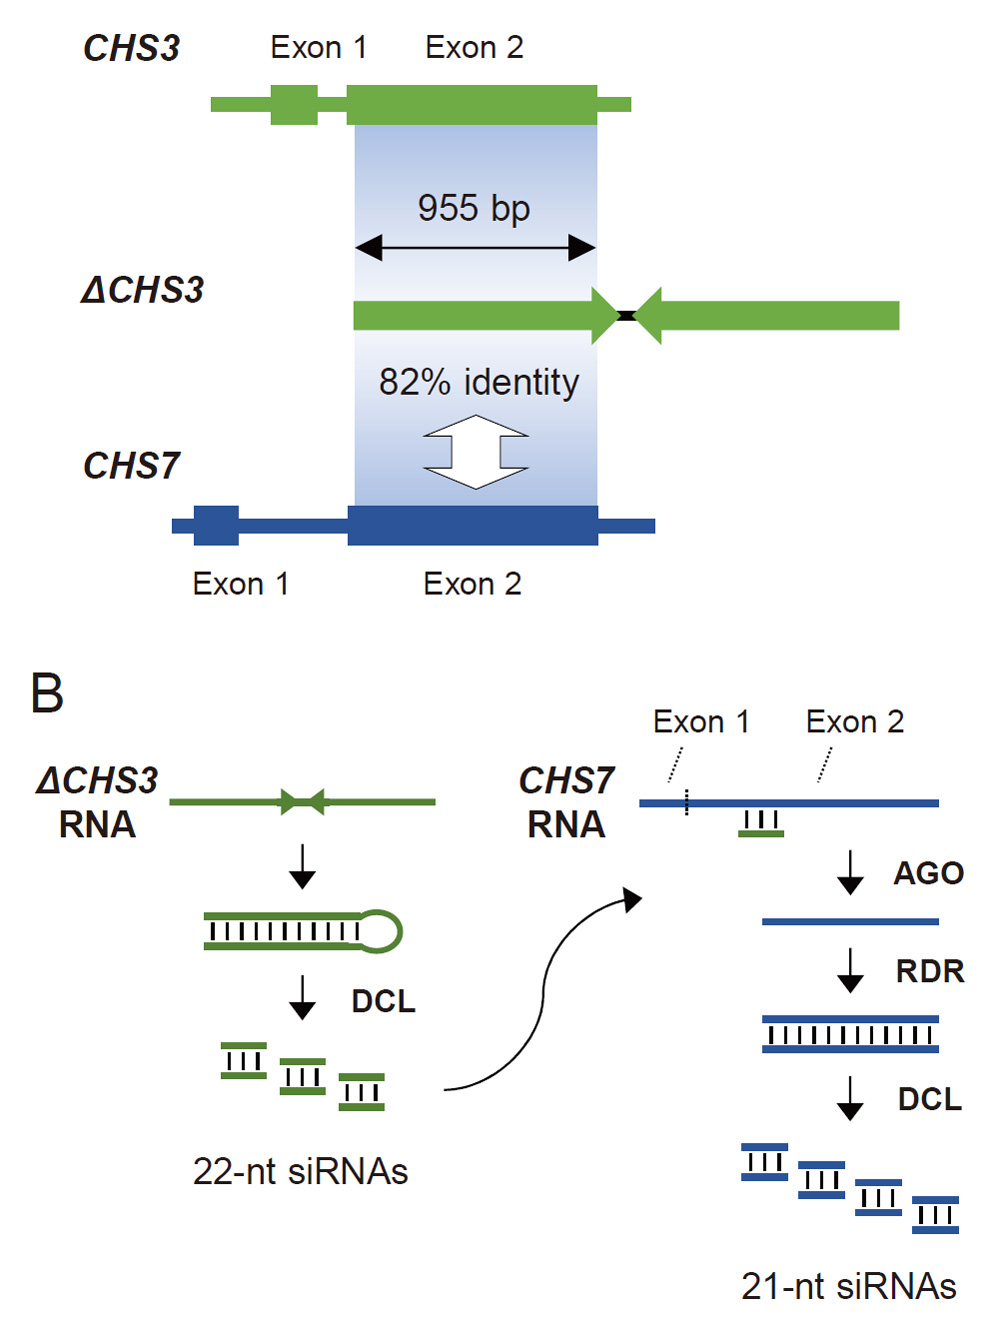
We also found that 22-nt siRNAs were mapped to the terminus of the region that produced phased siRNAs. Moreover, those 22-nt siRNAs contained siRNAs that were also mapped to ΔCHS3 (Figs. 9, 11). Jia et al. (2020) suggested that the 22-nt primary siRNAs that trigger massive production of phased 21-nt siRNAs are produced from a long IR that contains the CHS1 and CHS3 genes in the ii allele. Similarly, the locations of siRNAs in our data are consistent with the notion that 22-nt siRNAs produced from ΔCHS3 can trigger phased 21-nt siRNA production in trans in the I allele. The nucleotide sequence of ΔCHS3 contains a large portion of exon 2 and the 3′ untranslated region of the CHS3 gene (Kasai et al., 2007; Fig. 12A). Transcripts of GmIRCHS can thus form dsRNAs that serve as a substrate of DCL protein(s) to produce siRNAs (Fig. 12B). The exon 2 sequence of ΔCHS3 and the corresponding region of CHS7 share extensive sequence identity (82%) (Kurauchi et al., 2009; Fig. 12A), so that the exon 2 region of CHS7 transcripts could be a target of ΔCHS3-derived siRNAs. Such structural correspondence between ΔCHS3 and CHS7 may explain the preferential production of 21-nt siRNAs from exon 2 of CHS7 as suggested previously (Senda et al., 2012; Fig. 12B). Furthermore, the ratio of 22-nt siRNAs to 21-nt siRNAs was much higher in ΔCHS3 (Fig. 7) than in CHS7 (Fig. 5). These data are reminiscent of the substrate preference for DCL proteins associated with IR size, which was recently suggested in soybean (Jia et al., 2020). The sizes of siRNAs generated from long IRs (e.g., 1.3 kb) and short IRs (e.g., 0.3 kb) tend to be 22 nt and 21 nt, respectively, which suggests that long and short IR transcripts are favored substrates of DCL2 and DCL4, respectively (Jia et al., 2020). The size of the identical sequence of ΔCHS3 IR is 1,087 bp (Kasai et al., 2007), which is consistent with the production of 22-nt siRNAs at a high level via DCL2-mediated cleavage. Overall, GmIRCHS thus has features to trigger phased siRNA production from exon 2 of CHS7 and consequent degradation of CHS7 transcripts in trans.
One triggering mechanism of natural RNA silencing involves the production of dsRNA either by read-through transcription of duplicated and rearranged genes (Melquist and Bender, 2003; Kasai et al., 2007) or by convergent transcription of an overlapping gene pair (Borsani et al., 2005). RNA silencing mediated by transcription of rearranged genes was also detected in a mutant generated by mutagenesis (Kusaba et al., 2003). Soybean plants that had structural rearrangements that allowed the production of CHS dsRNA and its concomitant RNA silencing in seed coats were generated during or after domestication, and these plants have been maintained by humans. Independent and repeated generation of revertant mutants from cultivated soybeans that had CHS RNA silencing indicates that the altered DNA structures that induce CHS RNA silencing could be prone to further structural changes, leading to the absence of the IR structure that produces dsRNA upon transcription. This vulnerability of CHS RNA silencing is consistent with the notion that there is no obvious advantage in seed coats that lack flavonoids produced downstream of the process catalyzed by CHS in their biosynthetic pathway; rather, this trait may be neutral or confer lower fitness to the plant.
MATERIALS AND METHODS
Plant materials
The M1-2-3 mutant line, derived from soybean cv. Suzuyutaka, and wild-type plants were used. This mutant line was originally produced in Shonai Regional Center for Biotechnology, Yamagata, Japan, and was obtained from Professor Hikoyuki Yamaguchi. Plants were grown in the experimental field of Hokkaido University, Sapporo, Japan. Seeds were sown in paper pots, and after seedlings had grown for one week in a greenhouse they were transplanted to a field and grown as described previously (Mikuriya et al., 2017).
DNA gel blot analysis
DNA was isolated from leaf tissue essentially as described by Yamada et al. (2002), digested with BclI, and then fractionated by agarose gel electrophoresis. The DNA was transferred to nylon membranes and allowed to hybridize with labeled probes. Labeling of probes and hybridization were done using AlkPhos Direct (GE Healthcare). A 530-bp DNA fragment was amplified by PCR as described previously (Senda et al., 2002, 2013) and used as a probe to detect CHS1–CHS9. Hybridization signals were detected by chemiluminescence on X-ray film.
Analysis of gene expression by qRT-PCR
RNA was isolated from seed coat tissues of developing seeds by the method of Nakashima et al. (2018) but without repeating the DNaseI treatment of the nucleic acids. cDNA synthesis and subsequent qRT-PCR were done as described previously (Kasai et al., 2012). The F-box gene was used as an internal control as described previously (Shiroshita et al., 2021). Primers for qRT-PCR are listed in Supplementary Table S2.
Small RNA deep sequencing and mapping
Low-molecular-weight RNA was isolated from seed coat tissues for deep sequencing of siRNAs essentially as described previously (Kasai et al., 2012, 2013). Ligation of adapters to the RNA, reverse transcription followed by PCR amplification, and analysis of the nucleotide sequence of amplified cDNA were done using a Small RNA Sample Prep Kit and Illumina Genome Analyzer (Illumina). From the sequence reads obtained, adapter sequences and low-quality reads were removed using Trimmomatic (v. 0.39) (Bolger et al., 2014) with default settings, requiring a minimum length of 14 nt. Quality control was performed with FastQC (v. 0.11.9) (Wingett and Andrews, 2018) before and after trimming. Reads were then mapped to the nucleotide sequence of CHS7 (Glyma.01G228700) obtained from the cv. Williams 82 reference genome sequence (Wm82.a2.v1; Schmutz et al., 2010) or the ΔCHS3 sequence of GmIRCHS (AB264311; Kasai et al., 2007) using Bowtie 2 (v. 2.4.5) (Langmead and Salzberg, 2012).