原著論文
不安定な花色を示す複色花ダリア‘結納’において,花弁色と葉のフラボノイド蓄積には関連がある
2016 年 85 巻 2 号 p. 177-186

詳細
2016 年 85 巻 2 号 p. 177-186
Bicolor flowering dahlias generally produce inflorescences with bicolor petals characterized by a colored basal part and a white tip; however, they frequently produce single-colored petals. This petal color lability prevents uniform production of cut or pot flowers of bicolor dahlias and reduces the economic value of bicolor cultivars. In this study, to reveal the underlying mechanism and control color lability, the pattern of occurrence of single-colored petals was characterized in a red–white bicolor flowering cultivar ‘Yuino’. ‘Yuino’ produced inflorescences with bicolor petals, red petals, and both red and bicolor petals. Red petals occurred almost always at the outer whorls or sectorally in a mixed inflorescence, similar to a chimera or a lateral mutant. The occurrence of red petals was higher in field experiments during May to December than in greenhouse experiments during October to next July. We identified the “R-line” plant, which produced red petals with high frequency during the winter to spring cultivation; this characteristic to produce red petals with high frequency was retained through vegetative propagation. There were strong relationships between inflorescence color and leaf phenotype; red petal-producing plants accumulated flavonoids in leaves, whereas only bicolor petal-producing plants tended not to accumulate flavonoid in leaves. This suggests that petal color of ‘Yuino’ is associated with flavonoid synthetic potential in shoot. Therefore, a phenotypic difference is observed not only in petal colors but also at the whole plant level.
Dahlia (Dahlia variabilis) is one of the most popular ornamental Asteraceae plants due to the huge variations in flower traits, such as shapes, sizes, and colors. In particular, the flower colors are highly diverse, and there are many cultivars with red, purple, pink, yellow, ivory white, black, variegated, and bicolor petals. This huge variation in flower traits is due to the high polyploidy of dahlias. Dahlia is believed to be an autoallooctaploid with a chromosome number of 2n = 8x = 64 (Gatt et al., 1998), having a large genome size (2C value = 8.27–9.62 pg; Temsch et al., 2008), and more than 50000 cultivars have been bred during the last century (McClaren, 2009). Pigments accumulated in petals are flavonoids, such as anthocyanins, flavones and buteins, and several genes associated with flavonoid biosynthesis have been isolated (Deguchi et al., 2013; Ohno et al., 2011a, b, 2013). In addition to propagation from tuberous roots, dahlias are easily propagated vegetatively; cuttings are typically used for winter cut flower production (Konishi and Inaba, 1964; Naka et al., 2007).
Bicolor dahlia cultivars are attractive cultivars that produce inflorescences with petals characterized by a colored basal part and a white tip (Fig. 1A). The tip is pure white with an absence of flavonoids (Ohno et al., 2011b). The prominent common characteristic of bicolor dahlia cultivars is the lability or instability of petal colors; in addition to bicolor petals, they frequently produce single-colored petals without a white tip (Fig. 1B). This petal color lability is observed irrespective of the basal color. In some cases, an inflorescence has only single-colored petals, and in other cases, an inflorescence has both bicolor and single-colored petals. Loss of the white area in single-colored petals is independently observed by the increase or decrease of the white area, and it is clearly distinguished from the change of picotee pattern observed in a eustoma [Eustoma grandiflorum (Raf.) Shinn.] (Fukuta and Nakayama, 2008). Because this petal color lability prevents uniform production of cut or pot flowers of bicolor dahlias, and reduces the economic value of bicolor cultivars, it is important to control the occurrence of single-colored petals.

A red–white bicolor flowering cultivar ‘Yuino’. A: Predominant red–white bicolor petal. B: Red single-colored petal. C: Predominant bicolor inflorescence constituted only by bicolor petals. D: Single red colored inflorescence constituted only by red petals. E: Mixed inflorescence with outer whorl red petal occurrence. F: Mixed inflorescence with sectorally occurring red petals. A and B were sampled from the same inflorescence.
Although the causal factors of petal color lability in bicolor flowering dahlia are largely unknown, there are two common observations. First, single-colored petals are generally observed during summer. Second, the frequency of single-colored petal occurrence increases with iterations of cultivation. For example, the explanation of a red–white bicolor flowering dahlia ‘Yuino’ in a catalog produced by the A. A. A. Garden System (Tokyo, Japan) stated that “recently, single-colored petals were often observed”. Because farmers recognize the occurrence of single-colored petal as a mutation, plants that once had single-colored petals are thrown away (personal communication). These facts indicate that some feature(s) of petal color determinant factor(s) can vary among vegetatively propagated siblings.
In the current study, for future control of petal color lability, we characterized the occurrence pattern of single-colored petals in a red–white bicolor flowering cultivar ‘Yuino’ (Fig. 1C), a cultivar displaying white tips in red petals, which produced red petals with a relatively higher frequency among bicolor flowering cultivars in the preliminary experiment. We selected the plant with a high frequency of red petal production, and examined the possibility of whether plants that once had single-colored petals continued to produce single-colored petals. Finally, we analyzed the relationship between petal colors and leaf flavonoid accumulation.
A red–white bicolor flowering dahlia cultivar ‘Yuino’ (informal decorative, approximately 20 to 25 cm in diameter, bred by Yusaku Konishi in 1994 from ‘Zorro’ × ‘Holland Festival’) was used for the experiment. ‘Yuino’ plants were obtained from Nara Prefectural Agricultural Research and Development Center. The leaf primordia-free shoot apical meristem (SAM) domes of ‘Yuino’ plants were cultured during 2005 according to the method of Hosokawa et al. (2004), and maintained in vitro by subculture at intervals of one to three months on modified Murashige and Skoog (MS) medium (Murashige and Skoog, 1962). The in vitro plants were placed ex vitro for use as mother plants for cuttings in April 2008, February 2009, September 2009, December 2010, and February 2012, and mother plants were named the 08-line, 09-line, 10-line, 11-line, and 12-line, respectively. All mother plants were kept under night break condition, and cut back to prevent flowering. All cuttings were placed into a 24-hole plug tray filled with vermiculite until sufficient rooting and were placed under a mist condition, if necessary. Plants used within experiments during each year and the detailed date for taking cuttings and transplanting to the field are shown in Table 1.
Plant materials and date of the experiment.
For the analysis of petal color lability during summer cultivation in 2009–2013, cuttings were taken from one or several lines shown in Table 1. In 2009, cuttings were obtained from shoots sprouted from tuberous roots of mother plants after 1-year cultivation of the 08-line. Rooted cuttings were planted 30–50 cm intervals, and grown in the field of the experimental farm of Kyoto University (Kyoto, Japan). During 2009 and 2010, lateral shoots were removed until the first inflorescence bloomed, and then the plants were left to develop naturally, and nearly full bloomed inflorescences were collected for evaluation of petal color. During 2011, 2012, and 2013, all plants were left to develop naturally from the beginning, and nearly full bloomed inflorescences were collected.
For the analysis of petal color lability during winter cultivation, cuttings of 11-line were obtained during September to October 2011, and transplanted in October 27th and November 24th 2011, respectively, to 24 cm pots filled with mixed soil, mainly composed of Metro-Mix 360 (Sun Gro Horticulture, Agawam, MA), and situated in the greenhouse (warmed to maintain minimum temperature > 5°C from November to April) of the experimental farm of Kyoto University (Kyoto, Japan). Light condition of greenhouse in winter was natural light condition without any supplemental lighting.
For the analysis of leaf flavonoid accumulation, cuttings were obtained from February to June 2014 from each two mother plants of the 09-line (09-1 and 09-2), 12-line (12-1 and 12-2), and R-line (R-1 and R-2), and transplanted to the field from April to September 2014, and cuttings were obtained during November 20th to December 2nd 2014 from 09-2, 12-2, and R-3, and transplanted to the 24 cm pots situated in the greenhouse. All plants were left to develop naturally from the beginning and nearly full bloomed inflorescences, and collected for the analysis.
Evaluation of petal colorThe “red petal ratio” was used as an index for evaluation of petal color. This score was calculated as [(number of red petals)/(number of total petals)]. If all petals are red, the score would equal 1, whereas if all petals are bicolor, this score would equal 0. To avoid biases (for example, red petals are produced only in a plant having many inflorescences), the average score of all inflorescences of the plant was used for comparison among individuals, and the average score of individuals was used for comparison among populations.
The R-lineCuttings of 09-line plants were obtained in September 28th 2011, and stored at 30°C in a growth chamber (NS360; Takayama, Kyoto, Japan) for a month with 16 h photoperiod under light intensity 190 μmol·m−2·s−1 using cool white fluorescent lights. Subsequently, these plants were transplanted to a 24 cm pot filled with mixed soil mainly composed of Metro-Mix 360 situated in the greenhouse. Among 46 plants, one plant showing the highest average red petal ratio was selected, and named the R-line. Subsequently, cuttings were obtained from the R-line to use as a mother plant.
To assess the characteristics of the R-line to produce red petals with high frequency, the R-line was continued through vegetative propagation, and cuttings were obtained from the R-line and the 12-line and planted in the field in June 2013. In addition, cuttings were obtained from the R-line and 12-line in October 2013, and planted in a 24 cm pot filled with mixed soil mainly composed of Metro-Mix 360 and situated in the greenhouse. The average red petal ratio of inflorescences fully opened from September to November 2013 in the field and from February to June 2014 in the greenhouse, respectively, was compared between these lines.
To determine the characteristics of the R-line that was maintained after experience of the in vitro condition, node sections were collected from the R-line, 11-line and 12-line in July 2013. These nodes were sterilized with 70% ethanol and then 10% antiformin (Wako Pure Chemical Industries, Osaka, Japan), and placed in MS solid medium. After propagation in vitro, they were placed outdoors in October 2013, and planted in 24 cm pots filled with mixed soil and situated in the greenhouse in January 2014. Average red petal ratio of inflorescences fully opened from March to June 2014 was compared between these lines.
Analysis of flavonoid accumulation in leavesFor the analysis of uppermost leaf flavonoid accumulation, uppermost leaves were collected from field grown plants in 2014. When there were two uppermost leaves, both leaves were mixed and then extracted. For the analysis of whole plant leaf flavonoid accumulation, leaves in all nodes were collected as they developed. Leaves of field grown plants were collected during August 6th to November 21st 2014, and leaves of greenhouse grown plants were collected during January 7th to April 15th 2015. Since dahlia has opposite leaf arrangement, two leaves from each node were collected and separately extracted. For the analysis of leaf flavonoid accumulation in each mother plant, a leaf in the middle of plant was collected during March 12th to March 27th after taking some cuttings.
High performance liquid chromatography (HPLC) was used to analyze flavonoid accumulation. A total of 50–200 mg of leaves were homogenized in liquid nitrogen, and 1 mL of extraction buffer (acetic acid:methanol:water = 1:4:5 v/v) was added. The extracted samples were centrifuged for 10 min at 20600 × g, and the supernatant was collected for HPLC analysis. HPLC analysis was performed according to Ohno et al. (2013). The absorption spectrum of each peak was measured by photodiode array detector appurtenant to HPLC.
To simplify the analysis of flavonoid accumulation, 50–200 mg of leaves were homogenized in liquid nitrogen, and 1 mL of extraction buffer was added. Extracted samples were centrifuged for 10 min at 20600 × g, and the supernatant was collected. The absorption of this supernatant at 200–600 nm was measured using a double beam spectrophotometer (U-2000A; Hitachi, Tokyo, Japan), or a UV spectrophotometer (UV-1800; Shimadzu, Kyoto, Japan), and the score of ABS400/ABS370 was calculated. When leaf extract with rich flavonoid confirmed by HPLC was measured by a spectrophotometer, the score of ABS400/ABS370 exceeded 0.8 in a preliminary experiment. Thus, when the score of ABS400/ABS370 exceeded 0.8, the leaf was determined to be a rich flavonoid accumulator.
Statistical analysisData of uppermost leaf flavonoid accumulation and petal colors were analyzed with the independent chi-square test using Microsoft Excel 2013.
The predominant petal color of ‘Yuino’ is a red–white bicolor (Fig. 1A), but it frequently produced red single-colored petals (Fig. 1B). ‘Yuino’ predominantly produced inflorescences with only bicolor petals (Fig. 1C), but often produced inflorescences with only red petals (Fig. 1D), or mixed inflorescences with both red petals and bicolor petals (Fig. 1E, F). In a mixed inflorescence, red petals were located in the outer whorls (Fig. 1E), or sectorally (Fig. 1F) in many cases. From the observation of > 10000 inflorescences, bicolor petals were invariably located at the inner whorls, and red petals were located at the outer whorls of the inflorescence (Fig. 1E).
For analyzing the frequency of red petal production, the red petal ratio, (the number of red petals)/(the number of total petals), was used as an index of petal color change. Among total 4271 inflorescences in the field experiment from May to December in 2009, 2010, 2011, 2012, and 2013, 3201 inflorescences (75.0%) showed the score of red petal ratio 0, and 1070 inflorescences (25.0%) showed the score of red petal ratio more than 0. Here, 194 inflorescences (4.5%) showed the score of red petal ratio more than 0 but less than 0.8, and 876 inflorescences (20.5%) showed the score of red petal ratio not less than 0.8 (Fig. 2A–E). The mean score of red petal ratio varied from year to year, ranging from 0.02 in 2010 to 0.30 in 2013 (Fig. 2A–E). On the other hand, in the greenhouse experiment from October 2011 to July 2012, the mean score of red petal ratio was 0.01 (Fig. 2F), thus red petal occurrence was lower than that in the field experiment.

Red petal ratio of inflorescences in field-grown plants in 2009 (A), 2010 (B), 2011 (C), 2012 (D), and 2013 (E) and greenhouse-grown plants during 2011–2012 (F).
In the winter greenhouse cultivation of 2011–2012, while almost all cuttings maintained at 30°C until transplantation produced only bicolor petals, one plant consistently produced red petals at a high ratio. This plant scored the highest average red petal ratio of 0.57, while the average of all plants was 0.06 (Fig. 3). This plant was designated as the “R-line”. To determine whether this characteristic of high red petal production was maintained by vegetative propagation, the R-line was propagated by cutting.

Average red petal ratio of 30°C stored 09-line plants. One circle indicates the average red petal ratio of one plant. A big black circle of the highest average red petal ratio (0.57) indicates the R-line original plant.
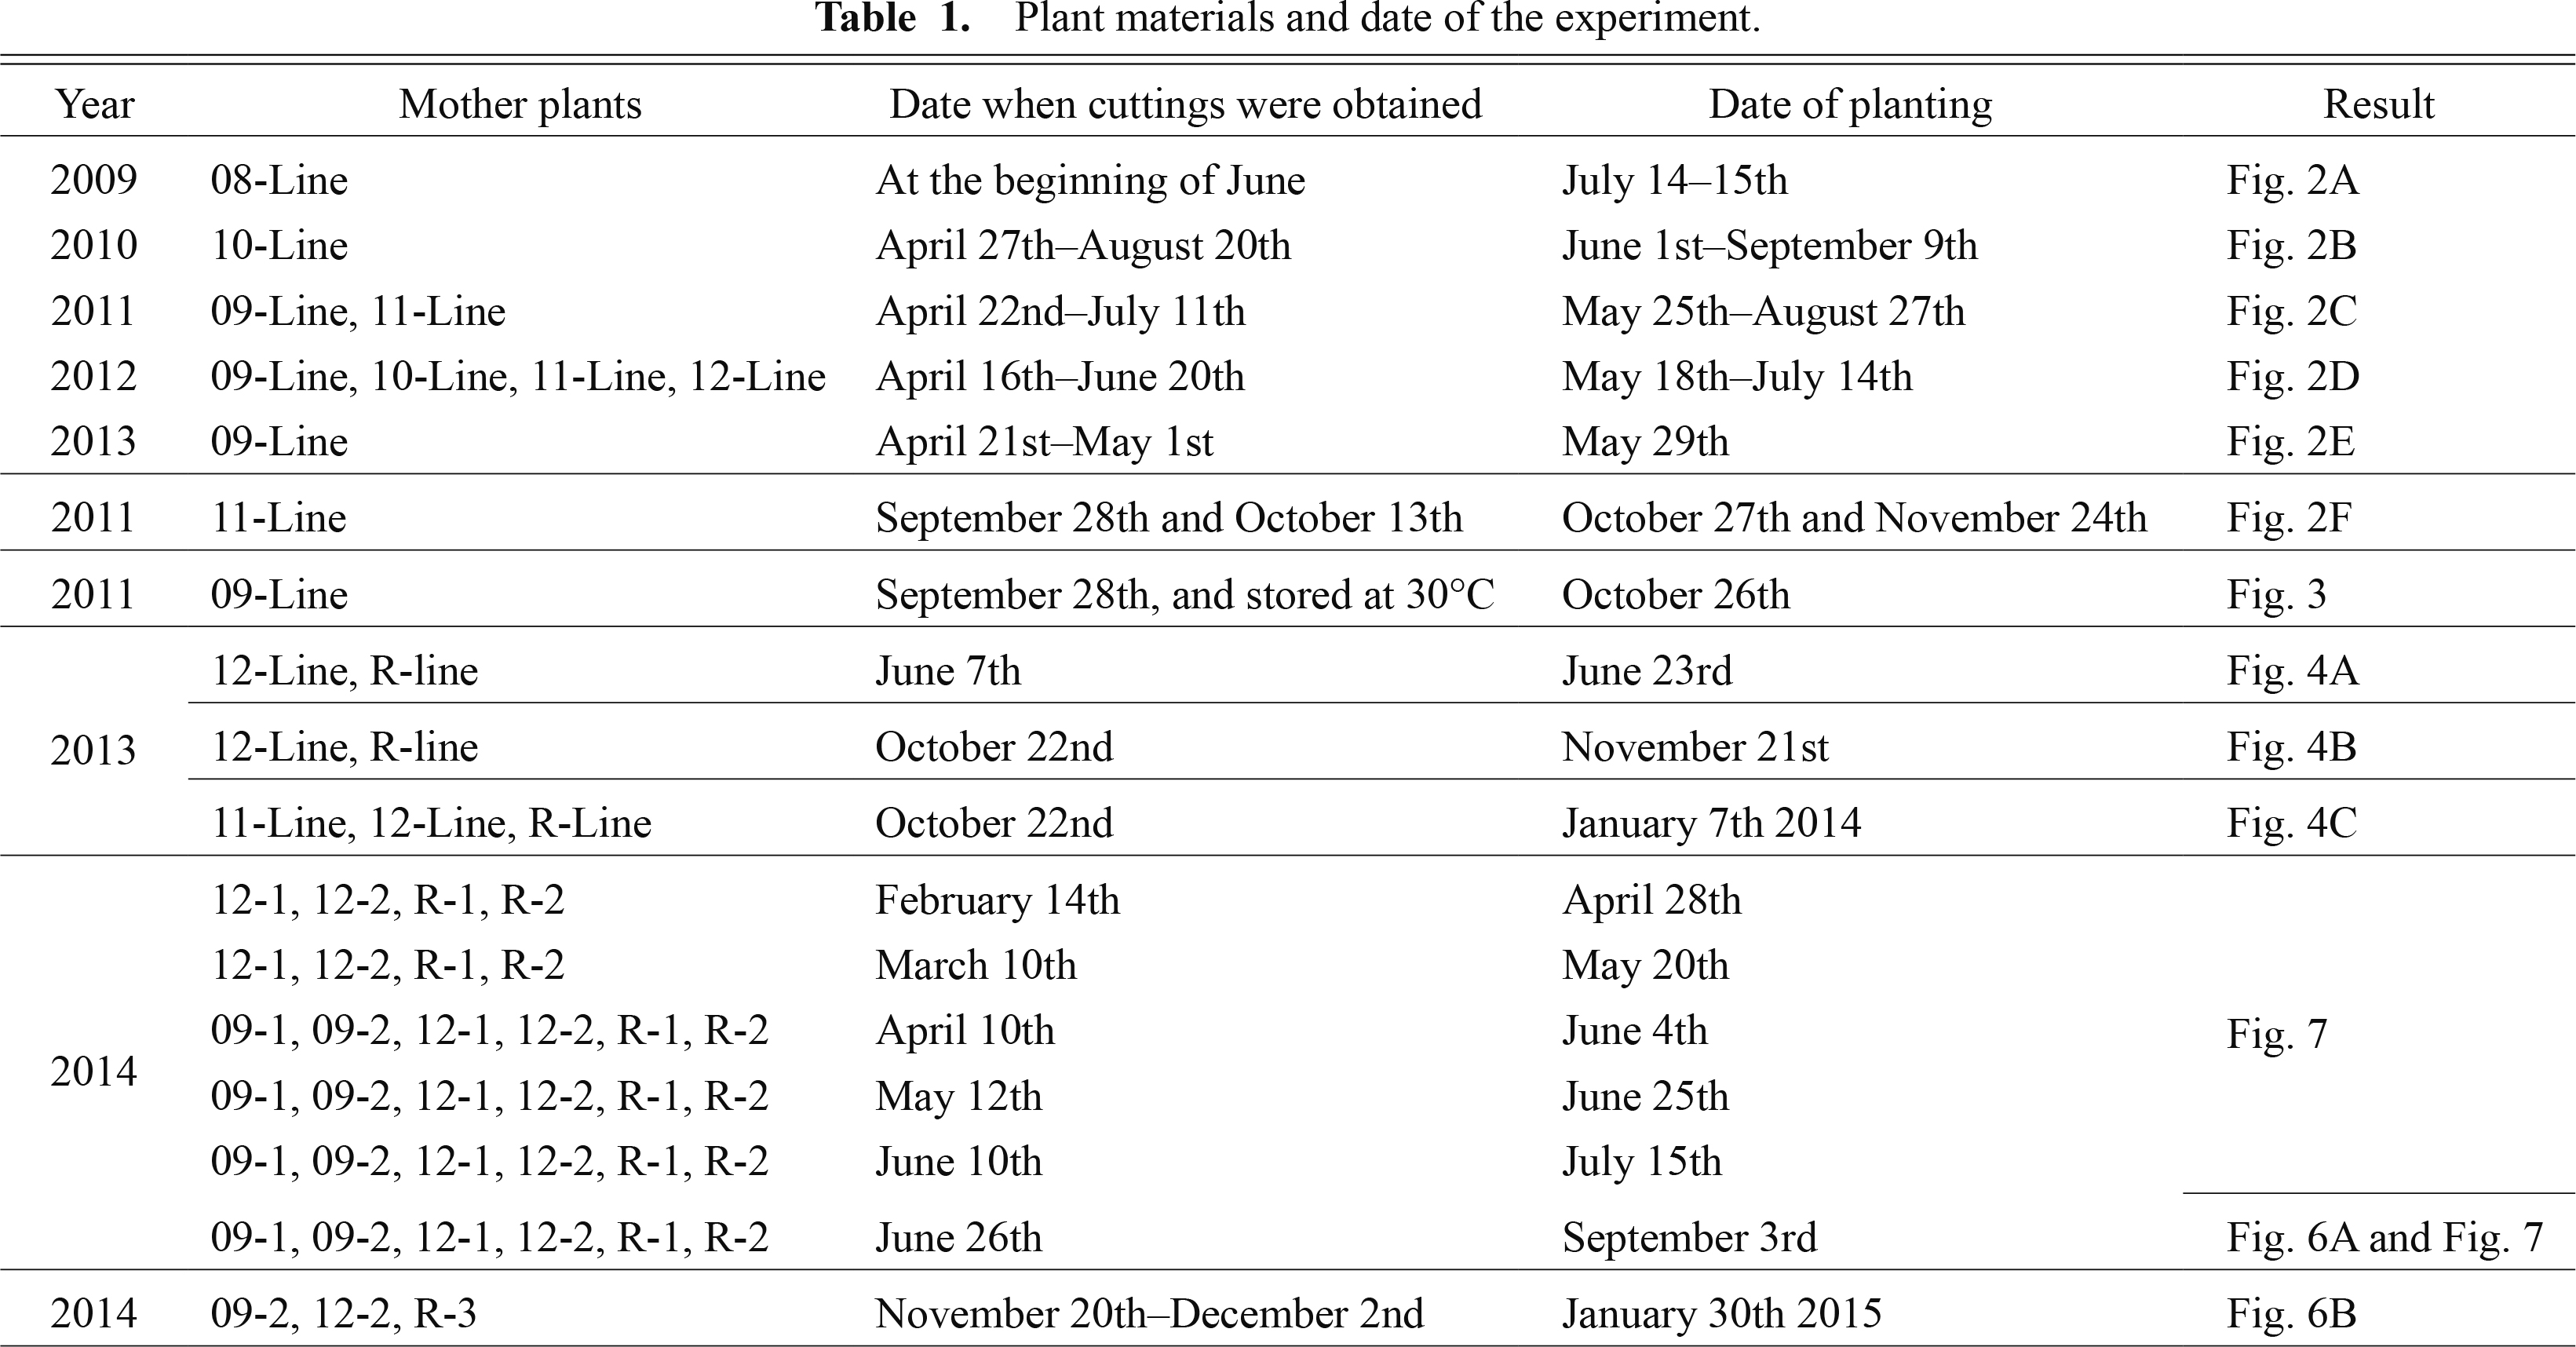
When the R-line plants were grown in the field during the summer of 2013, 133 out of 135 inflorescences of all 23 plants had red petals. The average red petal ratio was 0.96 in the R-line, whereas 0.45 in the 12-line as a control (Fig. 4A). When the R-line plants were grown in a greenhouse during winter in 2013–2014, a much more striking result was obtained, where the average red petal ratio was 0.71 in the R-line and 0.05 in the 12-line (Fig. 4B). After the experience of the in vitro environment, the R-line showed a higher average red petal ratio (0.91) than the 12-line (0.69) and 11-line (0.03) (Fig. 4C).
Average red petal ratio after vegetative propagation in R-line plants. A: The field experiment during the 2013 summer. Total inflorescence number of R-line and 12-line were 135 and 143, respectively. B: The greenhouse experiment during the 2013–2014 winter. Total inflorescence number of R-line and 12-line were 200 and 201, respectively. C: The greenhouse experiment during the 2013–2014 winter using in vitro experienced plants. Total inflorescence number of R-line, 12-line, and 11-line were, 90, 57, and 108, respectively.
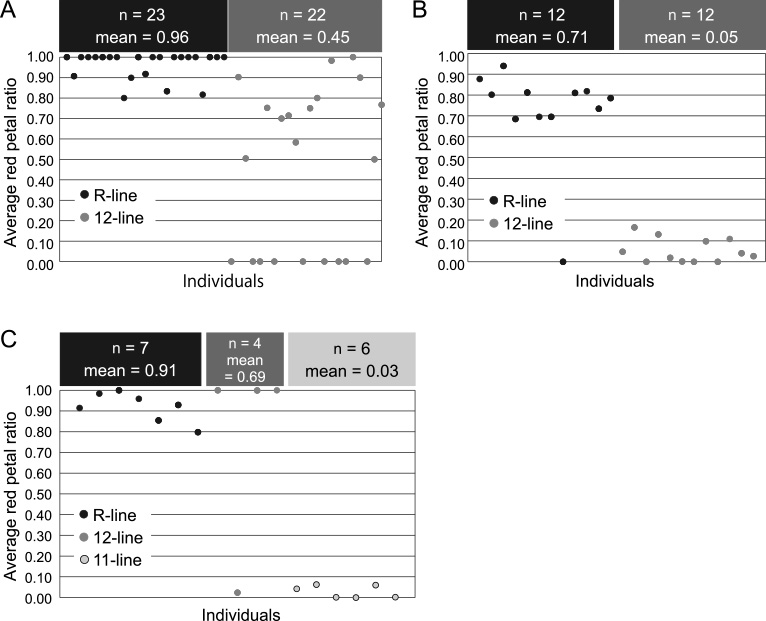
In a mixed inflorescence, bicolor petals were located at an outer whorls (Fig. 1E) or sectorally (Fig. 1F) in an inflorescence. This indicated that red petals occurred in a similar fashion to a chimera or lateral mutant, and it was expected that some difference is observed not only in petal colors, but also in other characteristics of the shoot. Because the formation of a white tip in a petal is as a result of loss of flavonoid synthetic capacity (Ohno et al., 2011b), the relationship between inflorescence color and flavonoid accumulation in the uppermost leaves was analyzed. For this analysis, the score of ABS400/ABS370 of leaf extract was measured by a spectrophotometer. This score was used as an indicator of flavonoid accumulation, because absorbance at 400 nm is detected only from a flavonoid accumulating leaf (Fig. 5A), and not from a non-flavonoid accumulating leaf (Fig. 5B) using a photodiode array detector adjunct to HPLC. Most peaks having absorbance at 400 nm differed between the flavonoid and non-flavonoid accumulating leaves had a maximum absorbance at 368 nm by a photodiode array detector (Table 2). These peaks were presumed to be derived from chalcone derivatives.
Photo diode array detection in leaves. A: Flavonoid accumulating leaf. B: Non-flavonoid accumulating leaf. Only in flavonoid accumulating leaves, peaks which had absorbance spectrum to approximately 420 nm were detected. The number below the peaks were corresponded with Table 2.

Photo diode array analysis of leaf extracts.
Among 185 field-grown individuals including 66 R-line plants, when an inflorescence had at least one red petal, the uppermost leaf accumulated flavonoids, whereas when an uppermost leaf did not accumulate flavonoids, the inflorescences inevitably were composed of all bicolor petals except for one plant (Table 3). The independent chi-square test indicated significant (P < 0.001) relationship between uppermost leaf flavonoid accumulation and petal color.
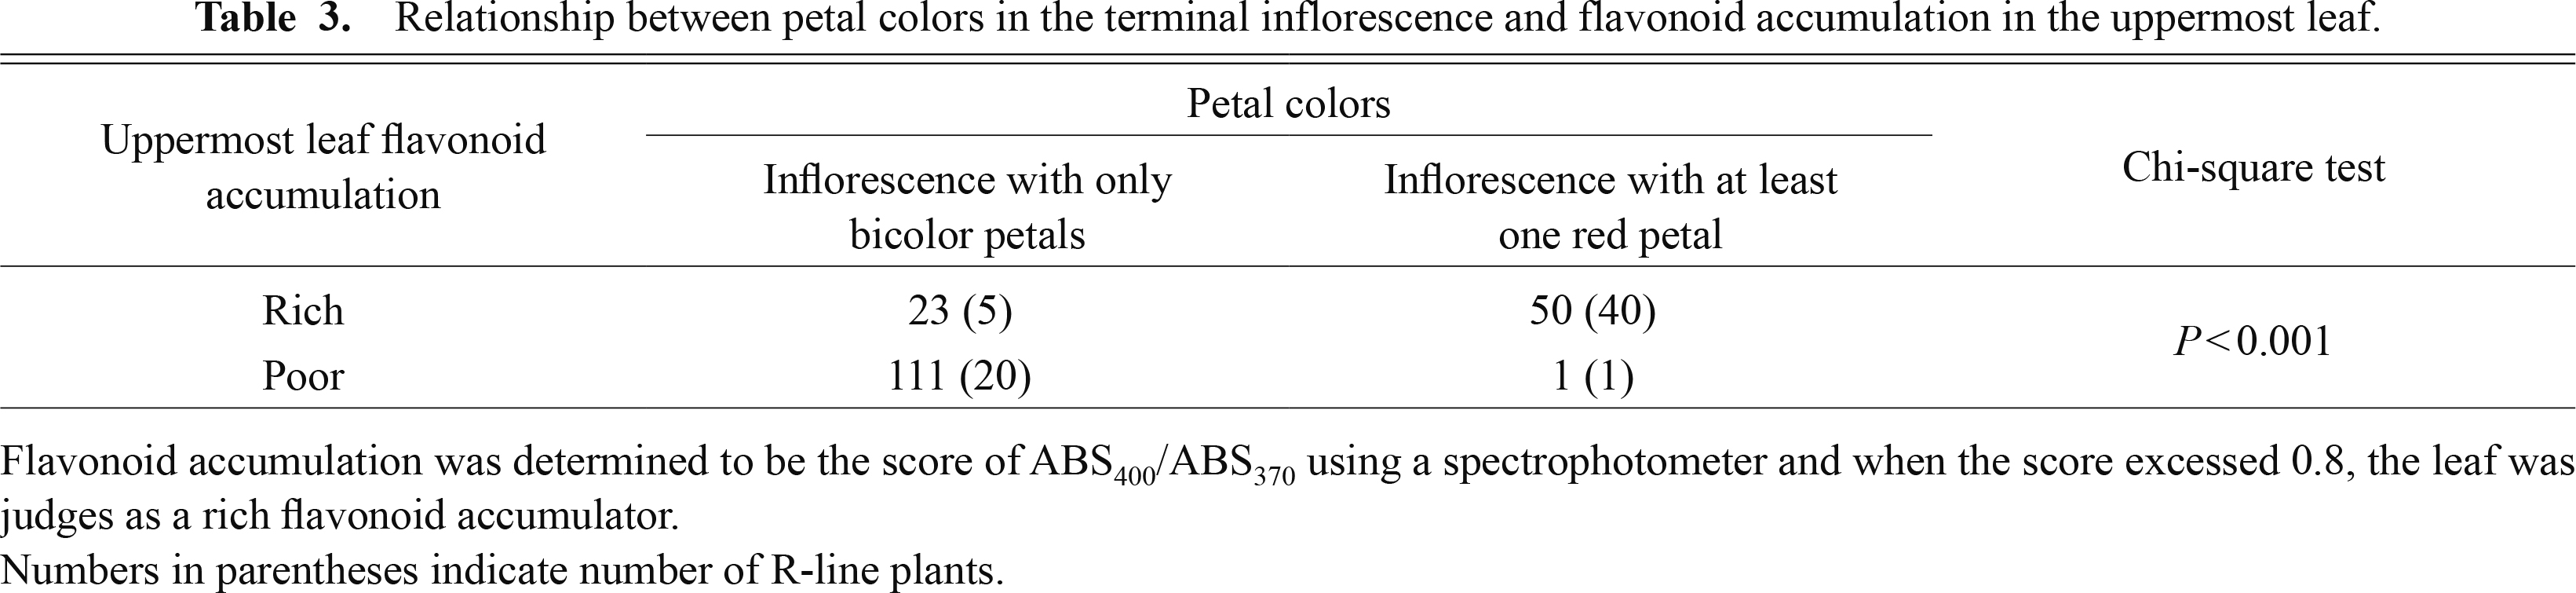
Relationship between petal colors in the terminal inflorescence and flavonoid accumulation in the uppermost leaf.
For further analysis, the relationship between petal color and flavonoid accumulation of whole plant leaves were analyzed. Among total 21 plants in the field experiment, eight plants including seven R-line plants produced at least one red petals, whereas thirteen plants including three R-line plants produced only bicolor petals. Scores of ABS400/ABS370 in leaves among thirteen nodes from the bottom were higher in plants with red petals than in plants without red petals (Fig. 6A). Similarly, in the winter greenhouse experiment, scores of ABS400/ABS370 in leaves among ten nodes from the bottom were higher in plants with red petals than in plants without red petals (Fig. 6B). Thus, these indicated that red-petal producing plants accumulated more abundant flavonoid in leaves than only bicolor-petal producing plants. Therefore, not only petal colors but also shoot phenotype differed between red-petal producing plants and bicolor-petal producing plants.
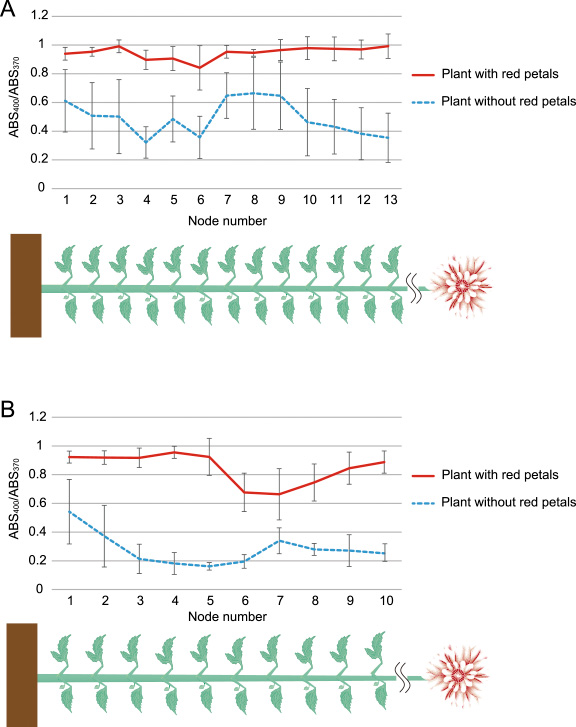
ABS400/ABS370 scores of leaf extract at whole plant level measured by a spectrophotometer in plants with red petals or without red petals. Scores of two leaves in the same node of each plant were averaged. A: The field experiment in 2014 summer to autumn. n = 8 for plant with red petals and n = 13 for plant without red petals. All flowered inflorescences were examined and plants with at least one red petal were classified into “plant with red petals”. B: The greenhouse experiment in 2014–2015 winter to spring. n = 8 for plant with red petals and n = 10 for plant without red petals. Node numbers were given from the bottom. Vertical bars indicate standard deviations.
To assess the difference of mother plants in the red petal producing property, cuttings were temporally obtained from the same six mother plants, composed of two 12-lines (12-1 and 12-2), two 09-lines (09-1 and 09-2), and two R-lines (R-1 and R-2) over six dates (Table 1), and the average red petal ratio was examined. These mother plants were selected based on flavonoid accumulation in leaves determined by thin layer chromatography (data not shown), and then confirmed by a spectrophotometer. The scores of ABS400/ABS370 in leaves collected in March 2015 from the middle of the plant were 0.450, 0.976, 1.009, 0.457, 0.944, and 0.930 for 12-1, 12-2, 09-1, 09-2, R-1, and R-2, respectively. Namely, 12-2, 09-1, R-1, and R-2 did accumulate flavonoids in leaves, whereas 12-1 and 09-2 did not.
While, only one plant produced red petals in cutting siblings of 12-1 (Fig. 7A), 18 out of 38 plants produced red petals in cutting siblings of 12-2 (Fig. 7B). Both 09-1 and 09-2 produced only bicolor petals (Fig. 7C, D). For R-line plants, 37 out of 42 plants produced red petals in R-1 cutting siblings (Fig. 7E), while 15 out of 40 plants produced red petals in R-2 cutting siblings (Fig. 7F). The average red petal ratio of 12-1, 12-2, 09-1, 09-2, R-1, and R-2 was 0.01, 0.18, 0.00, 0.00, 0.82, and 0.34, respectively. Therefore, the frequency of red petal occurrence differed between mother plants although in the same line.

Comparison of red petal occurrence property by mother plants. Average red petal ratio of cutting siblings from 12-1 (A), 12-2 (B), 09-1 (C), 09-2 (D), R-1 (E), and R-2 (F) mother plants are shown. Cutting plants were obtained in six dates from 12-1, 12-2, R-1, and R-2, and in four dates from 09-1 and 09-2. One plot indicates average red petal ratio of one cutting plant. The date under each graph indicates the date cuttings were obtained. Total inflorescence number of 12-1, 12-2, 09-1, 09-2, R-1, and R-2 lines were, 396, 340, 124, 122, 279, and 354, respectively.
Petal color lability is a common feature of bicolor dahlias, with the loss of the pure white tip from an original bicolor petal resulting in production of a single-colored petal. In some cases, all petals of an inflorescence develop into single color, and in other cases, partial petals of an inflorescence develop into single color. There are some species showing unstable flower color expression such as eustoma (Fukuta and Nakayama, 2008), but these cases of unstable flower color expression are obviously discriminated from petal color lability in bicolor dahlias. In other words, the former is considered as a quantitative organ specific phenomenon, whereas the latter is considered as a qualitative phenomenon. Since petal color lability prevents uniform production and reduces the economic value of bicolor cultivars, we used a red–white bicolor cultivar ‘Yuino’ (Fig. 1C) to reveal the underlying mechanism. Similar to other bicolor flowering cultivars, ‘Yuino’ showed petal color lability (Fig. 2). The white tip in its petals (Fig. 1A) disappeared and single-colored petals (Fig. 1B) were formed entirely (Fig. 1D), or partially in an inflorescence (Fig. 1E, F).
We could identify particular features of red petals from the observation among > 10000 inflorescences. One observation was that frequency of red petal occurrence was higher in the field experiment during spring to winter than in the greenhouse experiment during autumn to next summer (Figs. 2 and 4). This indicates the involvement of environmental factor(s) in petal color lability; however, strictly regulated condition will be required for further analysis. Another observation was the localization pattern of red petals in an inflorescence. When an inflorescence had > 10 red petals, red petals occurred in the outer whorls and/or sectorally, and not randomly in an inflorescence in almost all cases (Fig. 1E, F). Red petals were never observed at the inner side of bicolor petals, coinciding with the results of the study by Tammes and Groeneveld-Huisman (1939). Not only petals (ray floret) but also disk florets showed the specific localization. Lawrence (1931) reported that when disk florets of ‘Union Jack’, a bicolor single flower cultivar, were fumed with ammonia, disc florets were dark colored in the outer whorls and/or sectorally corresponded to petal colors in a labile inflorescence in many cases. Here dark coloring by fuming with ammonia indicated accumulation of flavonoids. Thus, these results suggested that not only petals but the whole inflorescence itself was labile, and behaved in a similar fashion to a chimera or a lateral mutant. If so, it was assumed that some kind of SAM state was labile, and that some characteristic(s) not only in an inflorescence but also at whole plant level differed between red petal producing plants and bicolor petal producing plants. The difference between a bicolor petal and a single-colored petal was the presence or absence of the white area on the petals, where no flavonoids were accumulated. Therefore, it was expected that flavonoid accumulation in leaves should be a valuable indicator to reflect state of SAM, and we therefore further analyzed the relationship between petal colors and leaf flavonoid accumulation.
When an inflorescence had at least one red petal, all except for one plants accumulated flavonoids, or putative chalcones, in the uppermost leaf (Table 3). The ABS400/ABS370 score of this exceptional plant was 0.708, suggesting that this plant accumulated a small amount of flavonoids. Regarding the contrapositive, when an uppermost leaf did not accumulate any flavonoids, the inflorescence inevitably had only bicolor petals (Table 3). Therefore, there was a distinct relationship between petal color and flavonoid accumulation in the uppermost leaf. This indicated the strong link of phenotypes between petal color and leaf flavonoid accumulation, suggesting petal color lability does not solely involve petal color change but also SAM status change. From the results of whole plant analysis of leaf flavonoid accumulation, red-petal producing plants were rich flavonoid accumulator, while only bicolor-petal producing plants were poor or no flavonoid accumulator (Fig. 6A, B). This suggested that leaf flavonoid synthetic potential was varied at whole plant level corresponding to petal colors. From these results, it is suggested that petal color lability of ‘Yuino’ results from a change in state of SAM in flavonoid synthetic potential which is visualized as a petal color. This coincided with the interpretation by Jorgensen (1995) that multiple meristem states existed in a transgenic cosuppression petunia.
The R-line plant was selected from the plant which had the highest average red-petal ratio (Fig. 3). The feature of producing red petals with high frequency was maintained by cuttings or after an experience of in vitro environment (Fig. 4). Therefore, it was suggested that the high red frequency characteristic of the R-line was maintained by vegetative propagation. However, this does not mean that the R-line plant was a mutant incapable of producing bicolor petals, because some R-line plants still produced bicolor petals (Figs. 4 and 7) and interestingly, some R-line cutting siblings produced only bicolor petals. Not only R-line plants, but also three out of four in vitro 12-line plants produced red petals at a high frequency (Fig. 4C). This indicated that, although the underlying mechanism was unknown, not merely the R-line but also other plants with a high red petal ratio could occur. Therefore, it is likely that propagation of these plants caused the increase of the frequency of single-colored petals.
Although in the same line, the 12-line and R-line plants showed clear difference in average red petal ratio of cutting siblings between mother plants (Fig. 7). The finding that 12-2 and R-1 plants clearly showed a higher average red petal ratio than 12-1 and R-2 plants, respectively, suggested that there was ‘mother plant effect’. The 12-1 mother plant had been selected as a no leaf flavonoid accumulation plant and the 12-2 mother plant had been selected to show leaf flavonoid accumulation. The feature of leaf flavonoid synthesis was somewhat transferred to cutting siblings, with all four plants showing poor leaf flavonoid accumulation in 12-1, while three out of four showed rich flavonoid accumulation in 12-2 (data not shown). Therefore, the property of leaf flavonoid synthesis in a cutting sibling might be affected by the property of its mother plant.
Vegetative propagation is the most powerful tool to achieve mass propagation, and siblings of cuttings or division of tuberous roots are generally recognized as having the same property. However, from our results of bicolor flowering dahlia, siblings did not necessarily have the same property, and some kind of visible or invisible feature might have changed. In the case of ‘Yuino’, this is the flavonoid synthetic (non-synthetic) potential. However, at the same time, our data also suggested a method to regulate petal color lability. We could not identify the red petal only plant line, but we could identify the bicolor petal only plant line (09-1 and 09-2). One candidate method for selecting bicolor flowering plants is to select poor or no flavonoid accumulating plants like 09-2. Even if it was cutting siblings from a mother plant with high single-colored petal frequency such as the R-line, poor or no flavonoid accumulating plants persisted and produced only bicolor petals (data not shown). Although the underlying mechanism still remains unknown, it might be possible to select plants producing only bicolor petals.