ORIGINAL ARTICLES
Identification of Soluble Carbohydrates and Their Subcellular Concentrations in Petals during Flower Opening in Eustoma grandiflorum
2016 Volume 85 Issue 3 Pages 238-247

Details
2016 Volume 85 Issue 3 Pages 238-247
Petal growth associated with flower opening is due to cell expansion. To elucidate the role of soluble carbohydrates in expansion of petal cells in Eustoma grandiflorum, its soluble carbohydrates were identified, and changes in their subcellular concentrations during flower opening were investigated. In addition to glucose, fructose, sucrose, and myo-inositol, d-bornesitol was identified using 1H-NMR. d-Bornesitol was the major soluble carbohydrate in leaves and stems. Given that cyclitols are known to be the translocated carbohydrates in alfalfa, phloem exudate was analyzed. However, the translocated carbohydrate was suggested to be sucrose, and not d-bornesitol. In the petals, glucose and sucrose content increased whereas d-bornesitol and myo-inositol contents were almost constant during flower opening. The fructose content in petals was very low. Glucose, sucrose, myo-inositol, and d-bornesitol were found mainly in the vacuole, although sucrose was also found in the cytoplasm. In the petals of open flowers, glucose and sucrose concentrations in the vacuole increased to 60 and 53 mM. Inorganic ion concentrations in the symplast and apoplast did not increase during flower opening. The osmotic potential of the symplast and apoplast in the petals was lower at the open stage than the potential of those at the bud stage, and this difference was mainly attributed to increases in glucose and sucrose concentrations. The results suggest that the accumulation of glucose and sucrose in the vacuole reduces the symplastic osmotic potential, which appears to be involved in the cell expansion associated with flower opening, but that the contribution of d-bornesitol as an osmoticum to cell expansion is limited in Eustoma.
Eustoma grandiflorum (Raf.) Shinn. is mainly used as a cut flower. Many cultivars with various petal colors and diverse flower forms have been cultivated. Findings from physiological studies on flowering have enabled year-round production (Katsutani, 2006). Thus, Eustoma has become a very popular cut flower. Cut Eustoma inflorescence has many flowers with different developing stages, and tight buds usually do not completely open (Shimizu and Ichimura, 2005). Application of sugars, such as sucrose, to cut flowers promotes flower opening (Shimizu and Ichimura, 2005; Shimizu-Yumoto and Ichimura, 2009), suggesting that sugar is also important for flower opening of cut Eustoma. Glucose and sucrose have been found to be present as major soluble carbohydrates in the petals of Eustoma (Shimizu and Ichimura, 2005). In a preliminary experiment, we detected an unidentified carbohydrate in various organs, including Eustoma petals.
The process of flower bud development and subsequent flower opening is associated with petal growth, during which petal cells divide and expand. In Gaillardia grandiflora (Koning, 1984) and the carnation (Kenis et al., 1985), petal cell division has been shown to stop at an early stage of flower development. Similarly, flower opening in the rose (Yamada et al., 2009b) and Tweedia caerulea (Norikoshi et al., 2013) is mainly due to cell expansion. Also, the final stage of petal growth associated with flower opening is due to cell expansion in Eustoma (Norikoshi et al., 2016). Cell expansion requires accumulation of osmotically active compounds, which facilitate water influx to the cell. In the petals of many flowers, including the carnation (Ichimura et al., 1998) and chrysanthemum (Ichimura et al., 2000), glucose and fructose contents increased during flower opening. In Gladiolus and Hemerocallis flowers, a decrease in osmotic potential induced by sugar accumulation is associated with flower opening (Bieleski, 1993; Yamane et al., 1991). Application of sugars, such as glucose or sucrose promotes petal growth (Ichimura et al., 2003). These findings suggest that soluble carbohydrates act as osmotically active compounds for petal cell expansion.
During cell expansion in some plant tissues, including apple fruit (Yamaki and Ino, 1992) and tulip petals (Wagner, 1979), soluble carbohydrates accumulate in the vacuole. To maintain osmotic balance with the vacuole, some soluble carbohydrates, including mannitol and pinitol, accumulate in the cytoplasm (Keller and Matile, 1989; Paul and Cockburn, 1989). Moreover, soluble carbohydrates accumulate in the apoplast in some sink organs, such as tomato fruit (Damon et al., 1988) and sugarcane stalks (Welbaum and Meinzer, 1990), suggesting that the apoplast is also an important location for storing soluble carbohydrates. Thus, determination of subcellular carbohydrate concentrations contributes to the understanding of petal cell expansion associated with petal growth.
Nonaqueous fractionation has been shown to be appropriate for the evaluation of subcellular metabolite distribution in the cells of spinach leaves (Gerhardt and Heldt, 1984). Apoplastic substances are usually collected by an infiltration-centrifugation method (Cosgrove and Cleland, 1983; Speer and Kaiser, 1991). Previously, we developed a method to evaluate subcellular carbohydrate concentrations by nonaqueous fractionation combined with infiltration-centrifugation (Yamada et al., 2009a). In rose petals, glucose and fructose accumulate in the apoplast, cytoplasm, and vacuole during flower opening (Yamada et al., 2009a). Determination of subcellular concentrations of soluble carbohydrates would help us to understand the role of soluble carbohydrates in petal cell expansion.
In the present study, we isolated an unidentified compound in Eustoma, and identified it as d-bornesitol. We also investigated changes in the subcellular concentrations of carbohydrates including d-bornesitol during flower opening in Eustoma to identify the role of soluble carbohydrates in petal growth.
Eustoma grandiflorum ‘Asuka-no-Nami’ were grown in a greenhouse under natural day length. As shown in Figure 1, petals at the following five stages were sampled: stage 1, buds ca. 25 mm in length; stage 2, buds ca. 32 mm in length; stage 3, buds ca. 43 mm in length; stage 4, pigmentation of petals began to start; and stage 5, on the day of anthesis. The flowers were transported to the laboratory, and used within 2 h. At each stage, fresh weights (FW) of petals were determined. Petals collected from five flowers were then dried in an oven at 120°C for more than 3 days, and dry weight (DW) was determined.

Developmental stages (A), petal FW, DW, and FW/DW (B), and soluble carbohydrate and starch content of petals (C) during flower opening. The scale bar represents 2 cm. Values are means of five independent experiments for FW and three independent experiments for carbohydrate ± SE.
Leaves (40 g FW) were immersed in 200 mL of 80% ethanol at 75°C for 30 min, and then homogenized. The homogenate was centrifuged at 3000 × g for 10 min. The supernatant was concentrated in vacuo below 50°C. The concentrate was passed through a Sep-Pak C18 cartridge (Millipore, Milford, MA, USA) to remove hydrophobic compounds. The eluate was concentrated, and purified using a high-performance liquid chromatography (HPLC) system (JASCO, Tokyo, Japan) equipped with a refractive-index detector. The sample was applied to a Shodex NH2 column (5E; Showa Denko, Tokyo, Japan), which was eluted with 75% acetonitrile at a flow rate of 3 mL·min−1. After removal of the acetonitrile, a fraction containing the unidentified substance was purified on a Shodex SUGAR SP0810 column (Showa Denko), which was kept at 80°C, and eluted with water at a flow rate of 0.8 mL·min−1 to yield 19 mg. The purified compound was lyophilized, and analyzed using NMR. The spectra of 1H-NMR were measured in D2O at 500 MHz using a JNM-A500 instrument (JEOL, Tokyo, Japan). Acetone was used as an internal standard. Specific rotation was measured with a polarimeter (DIP-1000; JASCO).
Carbohydrate extraction and determinationTo determine soluble carbohydrate contents in various organs, petals, the other floral parts that included stamens, pistils, receptacles and the calyx, stem and leaves were collected from flowering stems. The petals and the other floral parts were taken from flowers within 1 day after anthesis. Soluble carbohydrates and starch were extracted from the petals, and their contents were determined, as described in Yamada et al. (2009a). Water-soluble pectin was extracted by the method described by Terasaki et al. (2001), and uronic acid was estimated by the m-hydroxydiphenyl method (Blumenkrantz and Asboe-Hansen, 1973).
Carbohydrate analysis in phloem exudateTranslocated carbohydrate was determined based on the methods of Gilbert et al. (1997). Flower stems, which were 20 cm in length and had four leaves and several flower buds shorter than 1 cm, were cut from the plants, and the cut ends were placed in water. The stems were kept at 25°C under 250 µmol·m−2·s−1 from cool-white fluorescent lamps for 1 h, and then placed in a 27-L acrylic chamber. 14C-Sodium bicarbonate (NaH14CO3) (9.25 MBq, 74 MBq·mmol−1) was dissolved in water, and lactic acid was added to the solution to generate 14CO2. The cut stems were allowed to stand for 30 min for photosynthesis. Individual leaves were cut from the stems, after which the cut ends were placed in 20 mM EDTA solution, and kept at 20°C in darkness for 3 h. The resulting solutions were evaporated to dryness in vacuo below 50°C. The residue was dissolved in distilled water, and separated by HPLC equipped with a radio-analyzer (RLC-113; Aloca, Tokyo, Japan) on a Shodex SUGAR SP0810 column. The column was kept at 80°C, and eluted with water at a flow rate of 0.8 mL·min−1.
Nonaqueous fractionationNonaqueous fractionation was performed based on the method of Stitt et al. (1989) with slight modifications, as described in Yamada et al. (2009a). Petals were homogenized with a chilled mortar and pestle in liquid nitrogen, and the frozen powder was dried in a lyophilizer for more than 4 days. The dried powder was suspended in 20 mL of heptane, and ultrasonicated (450D; Branson, Danbury, CT, USA) for 90 s with alternating 5-s pulses and 15-s pauses. The suspension was then screened through an 80 μm nylon mesh, and centrifuged at 2000 × g for 10 min. The supernatant was discarded, and the sediment was resuspended in 2 mL of a tetrachloroethylene–heptane mixture (1.28 g·cm−3), and shaken well. The mixture was applied to a density gradient comprising a cushion of CCl4 overlaid with a linear gradient of a tetrachloroethylene-heptane mixture decreasing from 1.55 to 1.40 g·cm−3. The gradients were centrifuged at 15000 × g for 15 h, and the contents of the centrifuge tubes were removed from the top, and separated into seven fractions. Each fraction was divided into two equal portions, diluted 3-fold with heptane, and centrifuged at 10000 × g for 10 min, after which the fractions were evaporated to dryness in vacuo for 15 h, and the sediments were assayed for markers and carbohydrates.
Collection of apoplastic carbohydrates by infiltration centrifugationPetals (1 g FW) were cut into 5-mm squares, and washed in deionized water to remove soluble proteins and carbohydrates from the cut surfaces. The petal pieces were then vacuum-infiltrated in 5 mM MES-NaOH buffer (pH 6.0) for 20 min. The petal pieces were blotted dry, and placed vertically on 0.45-μm filters (Ultrafree CL; Millipore) in the upper compartments of disposable tubes to which 10 mM HEPES-NaOH buffer (pH 8.0) had been added in order to inhibit acid invertase activity. The tubes were centrifuged at 800 × g for 10 min. The soluble carbohydrate content of the resulting apoplastic fluid was determined by HPLC (JASCO). Recovery of apoplastic fluid was calculated by the method of Yamada et al. (2009a). The eluent was used to measure soluble marker enzyme activity.
Enzyme extraction and assayTo the dried sediments prepared by the nonaqueous method, 500 μL of 100 mM HEPES buffer (pH 8.0) containing 2 mM dithiothreitol, 1 mM EDTA, 10 mM sodium ascorbate and 2 mM phenylmethylsulfonyl fluoride was added, and the tubes were shaken vigorously before addition of another 500 μL of the same buffer. NADP-glucose-6-phosphate dehydrogenase (NADP-G6PDH; EC 1.1.1.49, cytoplasmic marker) and α-mannosidase (EC 3.2.1.24, vacuolar marker) activity were measured by the methods of Kornberg and Horecker (1955) and Stitt et al. (1989), respectively.
Electron microscopyPetals were fixed in a mixture of 3% glutaraldehyde and 1% paraformaldehyde in 0.1 M phosphate buffer (pH 7.2) for 5 h at room temperature. After washing with rinsing buffer (0.2 M phosphate buffer, pH 7.2), the samples were postfixed in 1% osmium tetroxide in 0.1 M phosphate buffer at 4°C for 2 h. The samples were dehydrated in a graded alcohol series, and embedded in epoxy resin. Ultrathin sections were prepared with diamond knives on a SUPER NOVA microtome (LKB, Stockholm, Sweden). The sections on grids were stained with 2% aqueous uranyl acetate for 15 min, followed by a lead electron staining solution (Hanaichi et al., 1986) for 10 min. The sections were observed using a transmission electron microscope (JEM 1200EX; JEOL). Forty micrographs were taken randomly from specimens at stages 2 and 5.
Procedure for calculation of carbohydrate concentrationsSubcellular distributions of soluble carbohydrates were determined by nonaqueous fractionation combined with infiltration-centrifugation, as described in Yamada et al. (2009a). First, carbohydrate content in the apoplast fraction was determined by infiltration-centrifugation. Carbohydrate content in the cytoplasm and the vacuole was then calculated from the distribution pattern of the two markers by the method of Riens et al. (1991).
To calculate subcellular carbohydrate concentrations, the area ratio of the vacuole, cytoplasm, cell wall, and air space was determined based on their area ratio using transmission electron micrographs according to the method of Yamada et al. (2009a). To determine petal volume equivalent to 1 g FW, a known FW of petals was submerged in distilled water in a graduated cylinder, and petal density was calculated. Carbohydrate concentrations were calculated by the equation described in Yamada et al. (2009a).
Measurement of osmotic potentialApoplastic and symplastic solutions were collected, and their osmotic potential was measured with a vapor pressure osmometer (VAPRO5520; WESCO, Logan, UT, USA), as previously described (Yamada et al., 2009a). Osmotic potential of the apoplastic solution was corrected for the volume of the cell wall and recovery of apoplastic solution. Symplastic osmotic potential was calculated based on vacuolar and cytoplasmic osmotic potential.
Measurement of inorganic ion concentration in symplastic and apoplastic fluidInorganic ion concentrations of apoplastic and symplastic fluid were determined by HPLC with an electroconductivity detector, as previously described by Yamada et al. (2009a).
The HPLC elution profile showed a peak corresponding to an unidentified compound (data not shown). The compound corresponding to this peak was isolated using HPLC, and subjected to 1H-NMR analysis for structural determination. The spectrum was completely identical to that of l-bornesitol isolated from sweet pea flowers (Ichimura et al., 1999), but the specific rotation of the purified compounds was
To determine whether d-bornesitol is a major soluble carbohydrate in various organs, soluble carbohydrate contents in petals, other floral organs, leaves, and stems were investigated. d-bornesitol was the most abundant carbohydrate in leaves (Table 1). The d-bornesitol content in the other organs was relatively high.
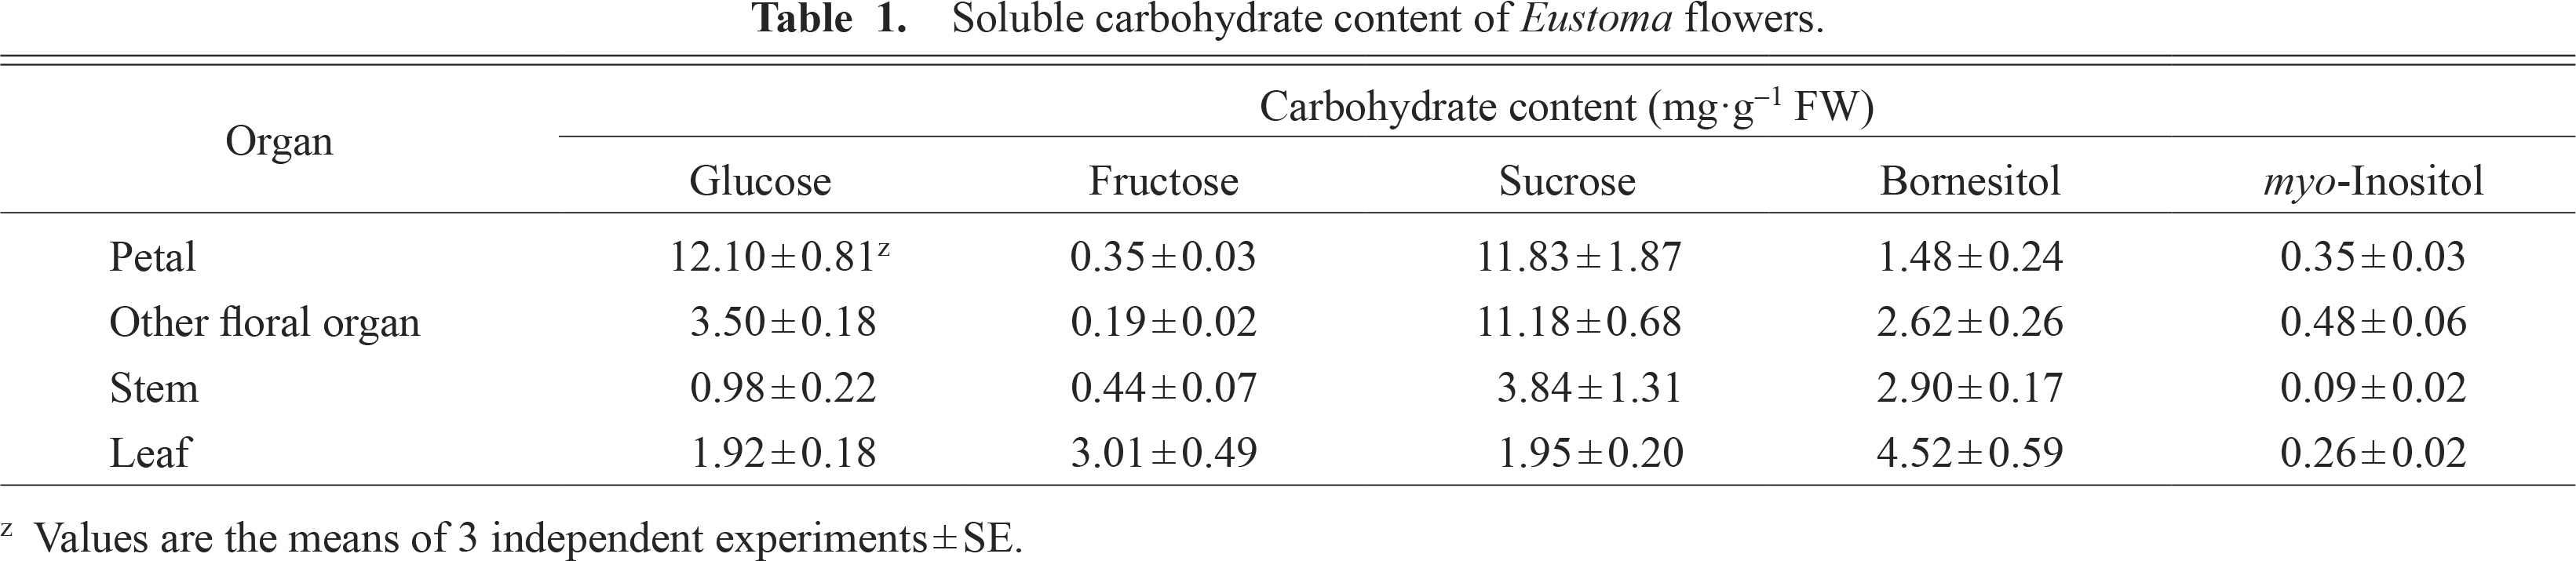
Soluble carbohydrate content of Eustoma flowers.
Leaves were exposed to 14CO2, and phloem exudates were collected from the cut ends of pedicels. The phloem exudates were separated by HPLC. A peak corresponding to sucrose was detected only in the phloem exudates (data not shown), suggesting that sucrose is the translocated carbohydrate in Eustoma.
Changes in FW, DW, and carbohydrate content during petal developmentFigure 1B shows petal FW, DW, and FW/DW ratios. The FW of petals at stage 1 was 235 mg per flower, and increased gradually to 865 mg per flower at stage 5. DW of petals increased during flower opening. FW/DW increased gradually until stage 4 but slightly decreased thereafter.
Figure 1C shows the carbohydrate content in the petals. At stage 1, d-bornesitol was the most abundant carbohydrate, followed by sucrose. Glucose and myo-inositol were also detected at a lower content at this stage. Glucose and sucrose contents did not markedly increase between stages 1 and 3, but increased 5-fold between stages 3 and 5. d-Bornesitol and myo-inositol contents did not increase during flower opening. Fructose content was less than 0.5 mg·g−1 FW at all stages (data not shown). Starch content increased slightly during flower opening. The maximum starch content was much lower than the glucose and sucrose contents.
Changes in subcellular carbohydrate concentrations during flower openingAll soluble carbohydrates were mainly found in the vacuole at stage 2 (Table 2). In stage 5, carbohydrates were found in all compartments. Sucrose was found mainly in the vacuole. Glucose and sucrose contents in the vacuole and apoplast were much higher at stage 5 than those at stage 2. The main carbohydrate in the cytoplasm at stage 5 was sucrose, although glucose and bornesitol were not distributed in the cytoplasm. d-Bornesitol and myo-inositol contents in the vacuole did not increase in stage 5.

Soluble carbohydrate content in the apoplast, cytoplasm, and vacuole during flower opening.
Volumes of vacuole, cell wall and cytoplasm and air space per flower were calculated (Fig. 2). Petal cells were occupied mainly by vacuoles at stage 2. Vacuole volume increased during petal growth. The vacuole volume at stage 5 was 375 mm3 per flower, which was approximately 2-fold as that at stage 2. The volumes of cytoplasm and cell wall were 22 and 37 mm3 per flower, respectively, at stage 2, and increased during flower opening. The volumes of air space increased markedly at stage 5.

Transmission electron micrographs of petals at stages 2 and 5 (A) and subcellular volumes (B). The scale bars represent 10 μm.
Soluble carbohydrate concentrations in each compartment in the petal cells were calculated from the carbohydrate content and the volumes of the compartments (Fig. 3). The glucose concentration was 6 mM in the vacuole at stage 2, and increased to 60 mM at stage 5. The glucose concentration in the apoplast showed a similar trend. Sucrose concentration was 14 mM in the vacuole at stage 2, and increased to 53 mM at stage 5. The sucrose concentration in the apoplast also increased at stage 5, but was much lower than the glucose concentration. The d-bornesitol concentration in the vacuole was highest at stage 2 but decreased at stage 5.

Subcellular soluble carbohydrate concentrations of petals at stages 2 and 5. Values are means of three independent experiments ± SE.
By HPLC analysis, NH4+, K+, Ca2+, Mg2+, and Na+ were detected as cations, whereas H2PO4−, SO42−, and Cl− were detected as anions in petal symplasts (Fig. 4). The concentration of K+ was highest, followed by Cl− at both stages. Total ion concentrations in the symplast were higher at stage 2 than those at stage 5. In the apoplast, in addition to these ions except for Na+, NO3− was detected. There were only small differences in the apoplastic ion concentrations between the stages. Although the concentrations of some ions, including H2PO4−, were higher in the apoplast than in the symplast, the total ion concentration was lower in the apoplast than in the symplast at both stages.

Inorganic concentrations of the apoplast and symplast in petals during flower opening. (A) Cation concentrations at stages 2 and 5. (B) Anion concentrations at stages 2 and 5. Values are the means of four independent experiments ± SE.
The total osmotic potential was lower in the symplast than in the apoplast in both stages (Fig. 5). Both osmotic potentials decreased from stages 2 to 5.

Osmotic potential during flower opening. (A) Total osmotic potential. (B) Osmotic potential due to soluble carbohydrates. (C) Osmotic potential due to inorganic ions. Values are the means of three independent experiments ± SE.
Osmotic potential due to soluble carbohydrates in both the symplast and apoplast was lower at stage 5 than at stage 2. Decreases in total osmotic potential in the symplast and apoplast from stages 2 to 5 were 273 and 303 kPa, respectively, with those due to soluble carbohydrates being 203 and 167 kPa, respectively. The decrease in osmotic potential was almost the same as the osmotic potential due to soluble carbohydrates. Osmotic potential due to inorganic ions in the symplast and apoplast decreased from stages 2 to 5 by 39 and 9 kPa, respectively.
In many flowers, including the daylily (Bieleski, 1993), rose (Evans and Reid, 1988), and T. caerulea (Norikoshi et al., 2013), the FW/DW ratio increases during flower opening. However, in our study, petal FW and DW increased during flower opening, but the FW/DW ratio decreased between stages 4 and 5 (Fig. 1). This result is consistent with that reported previously (Norikoshi et al., 2016). We observed that the basal parts of petals at stage 5 secreted an unknown sticky substance, which may be responsible for the marked increase in dry weight.
Petal growth associated with flower opening has been found to be due mainly to cell expansion in many plants including G. grandiflora (Koning, 1984), the rose (Yamada et al., 2009a), and T. caerulea (Norikoshi et al., 2013). Similarly, petal growth during flower opening was dependent on cell expansion in Eustoma (Norikoshi et al., 2016). Osmotic potential was lower in the symplast than in the apoplast in the petals at stage 2 (Fig. 5), facilitating water influx to petal cells. Soluble carbohydrate content in the petals increased during flower opening (Fig. 2) and the total osmotic potential of the symplast was lower at stage 5 than at stage 2 by 273 kPa (Fig. 5). In the symplast, the decrease in osmotic potential due to soluble carbohydrates from stages 2 to 5 was 203 kPa, whereas the osmotic potential due to inorganic ions increased by 39 kPa, showing that a decrease in osmotic potential in the symplast during flower opening can be attributed mainly to an increase in soluble carbohydrates. These findings suggest that gradual accumulation of soluble carbohydrate in the symplast contributes to petal cell expansion during flower opening under conditions in which osmotic potential is lower in the symplast than in the apoplast. This result is similar to that reported in rose petals (Yamada et al., 2009a).
Total carbohydrate concentration in the petals of open flowers was expected to decrease with water influx for cell expansion. However, total carbohydrate concentration in the petals was highest at stage 5 (Fig. 2). This discrepancy may be explained by the observation of Kawabata et al. (2011) that petal growth continues even after this stage. It should be noted that the difference in osmotic potential between the symplast and apoplast was smaller at stage 5 than at stage 2 (Fig. 5), and the decrease in this difference may be involved in the termination of cell expansion. Moreover, termination of cell expansion may be involved in the decrease in cell wall extensibility because cell expansion requires water influx and loosening of the cell wall (Boyer et al., 1985; Cosgrove, 2001).
In the present study, d-bornesitol was identified in Eustoma. d-Bornesitol has been detected in only two plant families, Apocynaceae and Rubiaceae (Plouvier, 1963). This is the first report showing the presence of d-bornesitol in the Gentianaceae family, although l-bornesitol is distributed in species in this family (Schilling, 1976). The d-bornesitol content in the leaf, stem, and other floral organs was relatively high, suggesting that d-bornesitol plays some important role as a reserve carbohydrate. Cyclitols including pinitol have been found to act as osmoregulators or compatible solutes (Ford, 1984; Keller and Ludlow, 1993; Paul and Cockburn, 1989; Sacher and Staples, 1985). Pinitol, an isomer of bornesitol, has been found mainly in the cytoplasm of Mesembryanthemum crystallinum leaves (Paul and Cockburn, 1989). In contrast, d-bornesitol was not found in the cytoplasm, but mainly in the vacuole in Eustoma petals (Fig. 3), suggesting that the role of d-bornesitol differs from that of pinitol. The d-bornesitol concentration in the vacuole was highest among carbohydrates at stage 2, suggesting that d-bornesitol is a major carbohydrate acting as an osmoticum. However, the d-bornesitol concentration in the vacuole did not increase during flower opening (Fig. 3), suggesting that its contribution to flower opening as an osmoticum is lower than that of glucose and sucrose. Deeper understanding of the role of d-bornesitol requires further study.
Glucose and sucrose were the major soluble carbohydrates in the petals of open Eustoma flowers (Fig. 2), as reported by Shimizu and Ichimura (2005) and Chuang and Chang (2013). Glucose and sucrose concentrations in the vacuole were much higher at stage 5 than at stage 2 (Fig. 3), suggesting that accumulation of these sugars in the vacuole largely contributes to the decrease in osmotic potential of the symplast. In the petals of many plants, including the rose (Yamada et al., 2009a), carnation (Ichimura et al., 1998), and chrysanthemum (Ichimura et al., 2000), however, glucose and fructose concentrations increase, while sucrose concentrations do not increase, during flower opening. In the vacuoles of rose petals, glucose and fructose concentrations increased, but sucrose concentration did not increase during flower opening (Yamada et al., 2009a). In these plants, hydrolysis of sucrose to glucose and fructose leads to a decrease in osmotic potential. Although the osmotic potential of a sucrose solution is higher than that of a glucose or fructose solution at the same percent concentration, the physiological significance in sucrose accumulation in Eustoma remains unclear.
Although sucrose has been shown to be a translocated carbohydrate in many plants (Zimmermann, 1960), pinitol, an isomer of bornesitol, is a translocated carbohydrate in alfalfa (Campbell and Binder, 1984). We accordingly sought to determine whether d-bornesitol is a translocated carbohydrate in Eustoma. However, sucrose, but not bornesitol, was suggested to be the translocated carbohydrate. The sucrose concentration was highest in the cytoplasm at stage 5 (Fig. 3). In other flower species such as the tulip (Wagner, 1979) and rose (Yamada et al., 2009a), sucrose also accumulates in the cytoplasm of petal cells. In higher plants, sucrose is known to be synthesized in the cytoplasm by sucrose phosphate synthase (Bird et al., 1974), and activity of insoluble invertase localized in the apoplast is relatively high (Sturm, 1999). Indeed, insoluble invertase activity has been detected in Eustoma petals (Harada et al., 2014). Thus, sucrose transported through the phloem may be hydrolyzed in the apoplast, and resynthesized in the cytoplasm.
The fructose content was at trace levels in the petals of open Eustoma flowers. This result is consistent with those reported by Shimizu and Ichimura (2005) and Chuang and Chang (2013). A similar finding in sweet pea petals has been reported (Ichimura et al., 1999). However, the fructose content in the leaves was relatively high (Table 1). In higher plants, fructose content is affected by fructokinase activity (Kanayama et al., 1998). The low concentrations of fructose in the petals of Eustoma may reflect this enzyme activity.
As reported in many plants, including the rose (Yamada et al., 2009a) and T. caurulea (Norikoshi et al., 2013) petals, K+ was a major cation as an osmoticum in the symplast and apoplast (Fig. 4). Moreover, Cl− levels were much higher in Eustoma petals than in the rose and T. caurulea petals (Norikoshi et al., 2013; Yamada et al., 2009a). In the cortex tissue of Eustoma stems and roots, lysigenous aerenchyma, which is developed specifically in aquatic plants, is observed (Yamashita and Imamura, 2007) and Cl− levels of aquatic plants are relatively high (Leigh and Tomos, 1993). Thus, high Cl− levels may be associated with this characteristic of Eustoma. However, inorganic ion concentrations in the symplast and apoplast did not increase (Fig. 5), suggesting that the role of inorganic ions in cell expansion is limited. Similar findings have been reported in the rose (Yamada et al., 2009a) and T. caurulea (Norikoshi et al. 2013).
It has been reported that the starch content in rose petals of cut flowers decreases during flower opening, accompanied by an increase in glucose and fructose contents (Evans and Reid, 1988; van Doorn et al., 1991), suggesting that an increase in monosaccharides may be attributed to degradation of starch. Indeed, most plastids, which were frequently observed in stage 2, disappeared at stage 5 (Norikoshi et al., 2016). However, the increase in glucose and sucrose contents during flower opening was much lower than the starch content (Fig. 2). Thus, the increase in glucose and sucrose contents during flower opening cannot be attributed to degradation of stored starch. Similar findings have been reported in the rose (Yamada et al., 2009a) and T. caerulea (Norikoshi et al., 2013). The increase in monosaccharide content is apparently due to photosynthate transported from leaves.
Given that the total osmotic potential of the symplast is lower than that due to soluble carbohydrates and inorganic ions, other compounds are expected to be involved in maintaining osmotic potential. Some organic acids, amino acids, and phenolic compounds may act as osmotica in Eustoma petals, given that these compounds have been shown to be osmotica in plants (Cram, 1976; Welbaum and Meinzer, 1990; Yamaki, 1984).
In conclusion, d-bornesitol has been identified as a major carbohydrate in Eustoma. Glucose and the sucrose content increased, while the d-bornesitol content was almost constant, during flower opening. In the petals of open flowers, glucose and sucrose concentrations in the vacuole increased to 60 and 53 mM, respectively. The osmotic potential in the symplast and apoplast decreased during flower opening, and this decrease was attributed partially to increases in glucose and sucrose concentrations. The osmotic potential of the symplast was much lower than that of the apoplast. The accumulation of glucose and sucrose in the vacuole at high concentrations appears to contribute to cell expansion, which is apparently involved in flower opening. d-Bornesitol was found mainly in the vacuole, but its role as an osmoticum in cell expansion is limited.
We thank Prof. N. Watanabe of Shizuoka University for measuring the optical rotation.