Abstract
Split-pit in peach fruit is a problematic disorder. Split-pit fruit cannot be detected based on external appearance, and contamination of fruit by split-pit reduces its reliability in the marketplace. Here, we demonstrate that split-pit fruit can be identified by a nondestructive acoustic vibration method and a unique approach based on the ratio of the third (f3) to the second (f2) resonant frequency. The response-resonant frequency spectra showed that the peaks of f2 frequencies in split-pit fruit were shifted to much lower values than those in normal fruit, whereas those of f3 frequencies showed only small shifts. The calculated f3/f2 ratios in most normal fruit were in the range of 1.35–1.4, whereas those in split-pit fruit were 1.45–2.0. Analysis of more than 300 fruit samples revealed that by setting the f3/f2 cut-off value at >1.45, 95% of split-pit fruit in the fruit samples were detected, whereas only 1.5% of normal fruit were missorted as split-pit fruit. A model for simulating the vibration properties of peach fruit was developed by using the finite element method. The simulated vibration patterns showed that f3/f2 values were increased by the insertion of split pit, indicating that, at least partially, the observed high f3/f2 values in split-pit fruit directly reflected split-pit occurrence. These results clearly demonstrate that the use of f3/f2 ratios obtained using an acoustic vibration method can effectively detect fruit with split-pit. The possibility of installing acoustic vibration devices in peach sorting lines and the application of portable devices to unpicked fruit on the tree are discussed.
Introduction
Split pit in peach fruit (Prunus persica Batsch) is a serious disorder recognized worldwide for centuries (Davis, 1941; Drogoudi et al., 2009; Evert et al., 1988; Miki, 1932; Ragland, 1934). Peach fruit contains a large lignified endocarp, called a stone or a pit, at its center (Dardick and Callahan, 2014). The pit develops rapidly, starting immediately after fertilization and continuing through stage I of fruit growth. The pit lignifies during stage II, which is a period of slow fruit growth. When lignification is complete, the final period of fruit swelling (stage III of fruit growth) is initiated. Pit splitting generally occurs during pit hardening in stage II through the separation and/or fracture of the pit along the ventral suture line. Early or severe pit splitting causes seed abortion and fruit drop (Davis, 1941; Fukuda et al., 2006). However, many split-pit fruit remain on the tree until harvest and do not present obvious differences in appearance from normal fruit, although these fruit reportedly show inferior qualities, such as cracking, shattering, and gumming of the pit, bitter taste, and reduced shelf life (Crisosto et al., 1997; Kubota et al., 1993). In processing peaches, contamination of flesh tissue by pit fragments is also an extremely severe problem (Drogoudi et al., 2009; Evert et al., 1988).
Efforts to reduce split pit in peach have proven difficult. Molecular research has been conducted to identify the genetic basis for split pit in order to breed resistant cultivars (Tani et al., 2007). However, information on the genetic mechanism(s) of split pit is limited. In addition, numerous environmental, tree, and cultivation factors have been suggested to influence pit splitting (e.g. Monet and Bastard, 1979; Woodbridge, 1978). One example is the application of specific production techniques to increase fruit size, such as thinning, N2 fertilization, and girdling of bearing branches, all of which may promote the occurrence of split pit (Claypool et al., 1972, Kubota et al., 1993, Nakano and Nakamura, 2001). However, in spite of efforts to identify the conditions for reducing split pit, including the optimization of crop load and the timing of thinning (Claypool et al., 1972; Drogoudi et al., 2009), the production of high-quality fruit with minimal split pit has proven difficult.
Depending on the cultivar and the growing season, as much as 30% of peach fruit develop split pit. However, most of the split-pit fruit cannot be detected from their outer appearance, which reduces market reliability. Nondestructive methods that effectively sort split-pit fruit from normal fruit are in high demand. Magnetic resonance imaging (MRI) and X-ray computed tomography (CT) are viable candidates for the detection of split-pit fruit through the nondestructive imaging of internal structures and fruit properties, and X-ray CT has proven successful in the detection of split pit (Han et al., 1992; Prasad, 2015). These methods, however, are not widely used because of high cost and the long time required for analysis in fruit sorting lines.
Acoustic vibration methods are based on the excitation of target material by acoustic waves and the characterization of response vibration signals in terms of resonant frequencies; the data obtained can be used to determine the internal properties of a broad range of materials. In recent years, various vibrators and sensors have been developed for acoustic research, including electrodynamic vibrators that generate swept sine waves, laser Doppler vibrometers, and piezoelectric films, as well as transformation algorithms to process the signals. Acoustic vibration methods have been applied to the nondestructive inspection of the internal properties of intact fruit (Taniwaki and Sakurai, 2010), using the second (f2) resonant frequency that represents the internal physical properties (such as elasticity) of fruit flesh (Cooke, 1972). This method has been developed to estimate fruit firmness (Taniwaki and Sakurai, 2010). The f2 frequency has also been used to evaluate flesh firmness and/or optimal ripeness of fruit, including melons (Taniwaki et al., 2009c, 2010), pears (Murayama et al., 2006; Oveisi et al., 2014; Taniwaki et al., 2009b; Terasaki et al., 2006), persimmons (Taniwaki et al., 2009a), kiwifruits (Terasaki et al., 2013), watermelons (Abbaszadeh et al., 2015), and grapes (Takahashi et al., 2010).
Acoustic vibration also offers opportunities for the detection of otherwise concealed internal defects that reduce fruit quality. The f2 frequency has been used to detect inner deterioration in Japanese pears caused by core rot fungal infection, which cannot be detected from the external appearance of the fruit (Kadowaki et al., 2012). Granulated fruit have also been detected in “Hyuganatsu” citrus (Citrus tamurana Hort. ex Tanaka) (Muramatsu et al., 1999). It has been suggested that modal properties derived from the vibration response could be used to detect internal defects or shifts in fruit structure, and that a method for the prediction of fruit quality could be developed based on modal parameters.
So far, fruit research using acoustic vibration methods has been based on mostly the single f2 frequency of acoustic data, which has been used to investigate the internal physical properties of fruit. In this study, we demonstrate that the acoustic vibration method based on not the single f2 frequency, but rather the ratio of the third (f3) to the second (f2) resonant frequency (f3/f2 ratio) effectively discriminates split-pit fruit from normal fruit with high reliability. The observed results were further confirmed by simulation with models created using the finite element method.
Materials and Methods
Plant materials
Peach fruit (Prunus persica Batsch. ‘Okayama Yumehakuto’) were harvested on the commercial harvest date (5 August) from trees grown in the orchard of the Okayama Prefectural Agriculture Research Station. Fruit with a broad range of maturity relative to the range of maturity of commercial harvest were harvested.
Acoustic vibration measurement using a portable device for resonant frequency measurement
Acoustic vibrations for each fruit were measured using a portable device for resonant frequency measurement (Model NSP-1; Applied Vibro-Acoustics, Inc., Japan) (Kadowaki et al., 2012; Takahashi et al., 2010). Each fruit was sandwiched between a portable speaker with vibration resonance technology and a piezoelectric sensor (each 15 mm in diameter) (Fig. 1). The portable speaker applied sinusoidal waves to the fruit at a frequency of 100–1400 Hz in the sweep mode. The sensor received the vibration of the fruit and the vibration signals were transported to a personal computer. The resonant frequencies were calculated by fast Fourier transformation using customized software installed in the personal computer. In this study, f2 and f3 frequencies and f3/f2 ratios were used to analyze split-pit fruit.
Measurement of the flesh penetration force and split-pit estimation
Hemispherical sections of flesh were cut from the cheek of tested fruit, and the skin (exocarp) covering the flesh was removed. Flesh penetration force was measured with a rheometer (FUDOH RTC Rheometer; RHEOTECH, Japan) with a 3-mm-diameter cylindrical plunger. In this experiment, a thinner plunger was used than those used in general handy penetrometers such as 8-mm-diameter plungers. This is because in a future study we are planning to adapt the same systems to hard fruit during development when split-pit occurs on trees. The penetration force is expressed in Newtons per area (N·mm−2). After measurement of the flesh penetration force, the pit of tested fruit was exposed along its suture line and the occurrence of split pit was examined visually.
Simulation of vibration properties by the finite element method in fruit with and without split pit
Models of peach fruit were created to simulate f2 and f3 frequencies in normal fruit and split-pit fruit by the finite element method with the analysis software ANSYS (Mechanical APDL Release 13.0; ANSYS, Inc., PA, USA) (Fig. 2). In these models, each peach fruit was assumed to be a sphere measuring 93 mm in diameter and its skin was 0.5 mm thick (Fig. 2A, B). The center of the seed was located in the stem side 22.5 mm from the center of the fruit. The seed consisted of a shell and a core, and the radius of the core was 9.3 mm (Fig. 2B). A split pit was inserted between the two hemispheres of the shell as a gap of 2 mm (Fig. 2C), where the gap was filled with air. Shear stress between the core and the shell was assumed to be zero.

Common physical properties of normal fruit and split-pit fruit are shown in Table 1. We created three models each of normal fruit and split-pit fruit with different Young’s moduli of 4 MPa, 8 MPa, and 12 MPa. The three Young’s moduli for flesh, 4 MPa, 8 MPa, and 12 MPa, were selected from measured values in fruit with various maturities by a force gauge (ZP-50N; Imada Co., Ltd., Japan). Young’s modulus for the seed shell (350 MPa) was also determined from a measured value. Young’s modulus for the seed core was assumed to be 12 MPa.

Poisson’s ratios were chosen to be 0.35 except for the seed shell, because the seed shell strain was larger than that of the other parts. Viscosity in Table 1 is defined by the fraction of critical damping ξ, namely, the ratio of the viscous damping coefficient to the critical damping coefficient. No vibration signal was received for ξ = 100% due to energy dissipation, whereas vibrations were not completely damped for ξ = 0%. Vibration was applied on the skin surface and the displacement was measured at a point symmetric to the vibration point with respect to the central point of the fruit model (Fig. 2B, C). The vibrations of the six models were simulated from 0 Hz to 1500 Hz, and f2 and f3 frequencies in normal fruit and split-pit fruit were calculated.
Results and Discussion
Changes in the frequency response spectrum of split-pit peach
First, we determined the relationship between penetration force (i.e., firmness) measured destructively using a rheometer and the acoustic vibration response of harvested fruit. Relatively large variations in f2 frequency values were noted. The elastic index calculated using fruit weight and f2 (as described in Terasaki et al., 2001a, b) also showed little relation to the penetration force (data not shown). These results indicate that factor(s) other than fruit firmness affect acoustic vibration emitted from peaches.
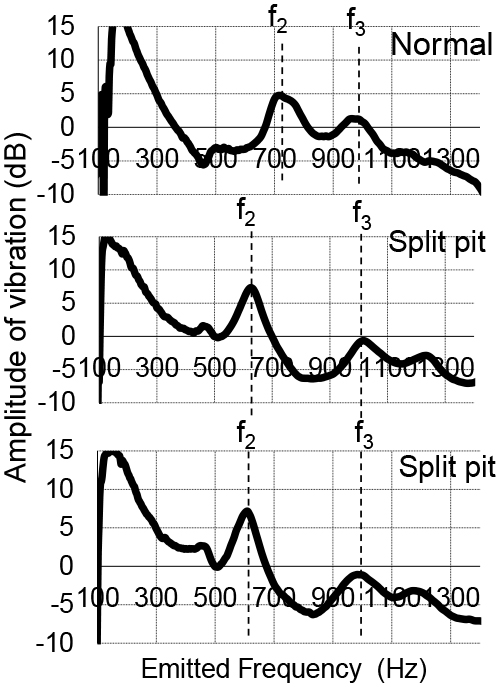
Next, we examined the relationship between acoustic data and occurrence of split pit (Fig. 3A, B). Interestingly, even in fruit with similar penetration force values, the peaks of f2 and f3 frequencies were lower in split-pit fruit than in normal fruit. As regards the peaks of f3 frequencies, the differences were relatively small (with some overlap between the peak values of split-pit fruit and normal fruit). In contrast, the peaks of f2 frequencies were considerably lower in split-pit fruit than in normal fruit. Figure 4 shows the response-resonant frequency spectra of fruit with similar f3 frequencies (around 950 Hz), highlighting the relationship between f2 and f3 frequencies and the occurrence of split pit. The peaks of f2 frequencies shifted to lower values in split-pit fruit. The shift in the f2 peak in split-pit fruit relative to normal fruit was independent of fruit firmness, as described below. No relations between fruit size and the shift in the f2 peak were observed (data not shown).

We next examined the relationship between the penetration force and f3/f2 ratio (Fig. 5). The f3/f2 ratios in most normal fruit were in the range of 1.35–1.4 and were independent of fruit firmness. In softened fruit, in which the penetration force was <0.4 N·mm−2, the f3/f2 ratios tended to be <1.3. One normal fruit showed an f3/f2 ratio of 1.54; however, we assumed that this high value may have been due to the miscategorization of the fruit as normal when we examined split pit visually. On the other hand, the f3/f2 ratios in most split-pit fruit were >1.5, and some were almost as high as 2.0. It seemed that the f3/f2 ratios were higher in more severe cases of split pit, although we did not check the severity of split pit in each fruit.

An examination of more than 300 fruit samples showed that split-pit fruit can be successfully sorted from normal fruit on the basis of the f3/f2 ratios, with very little missorting of normal fruit as split-pit fruit (Fig. 6). Using the f3/f2 ratio of >1.45 as the cut-off value between split-pit fruit and normal fruit, 95% (54 of 57) of split-pit fruit in the fruit samples were sorted, and only 1.5% (4 of 256) of normal fruit were missorted as split-pit fruit (Table 2). As described above, because we judged the split pit visually, some of the four missorted normal fruit could actually have been split-pit fruit. All the three missorted split-pit fruit were softened fruit with a penetration force of <0.25 N·mm−2, and practically speaking, the three missorted split-pit fruit would have been removed before the sorting process. These results clearly demonstrate that the f3/f2 ratio determined using the acoustic vibration method can be used to effectively sort split-pit fruit from normal fruit.

Three models each of normal fruit and split-pit fruit with different Young’s moduli of 4 MPa, 8 MPa, and 12 MPa were created by the finite element method and f2 and f3 frequencies were calculated (Table 3). The results showed that irrespective of Young’s modulus for flesh, the f3/f2 ratios were increased by the insertion of a 2 mm split in the pits. These results indicate that, at least partially, a high f3/f2 ratio in split-pit fruit is a directly reflection of a split pit occurrence.

In a normal fruit model with a Young’s modulus of 12 MPa, the f2 and f3 frequencies were 765 Hz and 995 Hz, respectively (Table 3), which were close to the values actually measured in fruit with an approximately 1.0 N·mm−2 penetration force (Fig. 3). The simulated f3/f2 ratio in this normal fruit model was 1.30, which was also close to the measured values (Figs. 4 and 5). The simulated f2 frequency (690 Hz) in a split-pit fruit model with a Young’s modulus of 12 MPa was lower than that in the normal fruit model, which in turn resulted in a higher f3/f2 ratio (1.48) than that in the normal fruit model. In actual measurements, a broad range of f3/f2 values were measured in split-pit fruit and those values were higher than simulated f3/f2 values, suggesting that in addition to the insertion of split, other factors such as abnormal seed development, may affect the f3/f2 ratio. We also performed simulations in fruit with different Young’s moduli for the seed core (8 MPa and 4 MPa) or with a small split width (0.5 mm). The different Young’s moduli for the seed core had no effect on f2 and f3 frequencies and the one forth reduction in split width resulted in small changes in f2 and f3 frequencies and f3/f2 ratios (approximately 2% changes in f3/f2 ratios) (data not shown).
A notable tendency was observed: the simulated f3/f2 ratio decreased from 1.48 to 1.41 when the Young’s modulus of split-pit fruit model decreased from 12 MPa to 4.0 MPa. This tendency agrees with our results in Table 2, where three split-pit fruit with low firmness were missorted as normal fruit in the sorting process with a cut off value of >1.45. As described above, these softened fruit would have been removed before the sorting process.
Future use of the acoustic vibration method for commercial peach sorting and research on split-pit incidence
The acoustic vibration method was originally developed for measuring fruit firmness based on f2 frequency data. Such data are useful for the nondestructive determination of fruit firmness and maturity (Abbaszadeh et al., 2015; Oveisi et al., 2014; Taniwaki and Sakurai, 2010). In this study, we further demonstrated through actual measurements that the f3/f2 ratio is a powerful tool for the nondestructive detection of split pit in peaches. This was also confirmed by simulation using the finite element method. Split pit diminishes the reliability of fruit, as split-pit fruit cannot be distinguished from normal fruit on the basis of appearance. High quality control would require inspection of individual fruit, and nondestructive methods would be required for such an inspection to be effective. In this regard, the acoustic vibration method is simple, rapid, and inexpensive compared to MRI, X-ray, and CT techniques, and can be implemented in peach sorting lines. We are now developing a new sensor designed specifically for evaluating fruit quality precisely. It will be installed in peach sorting lines to sort split-pit fruit from normal fruit and at the same time estimate fruit maturity.
In preliminary experiments, we succeeded in detecting split-pit fruit on trees (Fukuda, personal communication) by monitoring the fruit at intervals of several days. We detected a sudden increase in the f3/f2 ratio to >1.6 in split-pit fruit in late June, during the initiation of the final fruit enlargement phase of fruit (stage III of fruit growth). Our preliminary results support the assumption that, at least partially, a high f3/f2 ratio in harvested split-pit fruit directly reflects the occurrence of split pit. Stone et al. (1996) investigated the hollow heart condition in watermelons on the basis of acoustic vibration data, and found a relatively high correlation between acoustically and visually detected occurrence of hollow heart; these data support our assumption that acoustic vibration can reflect the mechanical properties of the central part of fruit.
Little is known about the mechanism(s) and factor(s) that induce split pit. The acoustic vibration method, which enabled us to distinguish split-pit fruit from normal fruit and to monitor the fruit while they were still on tree, is expected to expedite research into the mechanism(s) and factor(s) that induce split pit, as well as promote the development of production techniques that could reduce the occurrence of split pit and improve breeding of resistant cultivars (Evert et al., 1988; Tani et al., 2007).
Models for simulating vibration properties in peach fruit were created: fruit having a highly complicated structure with a hard stone and that having a relatively soft core inside the stone. These models and their modifications could help researchers study changes and/or disorders in peach fruit, including split pit, the occurrence of water-soaked and reddish pulp (Fukuda et al., 2017), and chilling injuries, as well as fruit maturation.
Literature Cited
- Abbaszadeh, R., A. Moosavian, A. Rajabipour and G. Najafi. 2015. An intelligent procedure for watermelon ripeness detection based on vibration signals. J. Food Sci. Technol. 52: 1075–1081.
- Claypool, L. L., K. Uriu and P. F. Lasker. 1972. Split-pit of ‘Dixon’ cling peaches in relation to cultural factors. J. Amer. Soc. Hort. Sci. 97: 181–185.
- Cooke, J. R. 1972. An interpretation of the resonant behavior of intact fruits and vegetables. Trans. ASAE 15: 1075–1080.
- Crisosto, C. H., R. S. Johnson, K. R. Day and T. DeJong. 1997. Orchard factors affecting postharvest stone fruit quality. HortScience 32: 820–823.
- Dardick, C. and A. M. Callahan. 2014. Evolution of the endocarp: molecular mechanisms underlying adaptations in the seed protection and dispersal strategies. Front. Plant Sci. 5: 106–115.
- Davis, L. D. 1941. Split-pit of peaches: Estimation of time when splitting occurs. Proc. Amer. Soc. Hort. Sci. 39: 183–189.
- Drogoudi, P. D., C. G. Tsipouridis and G. Pantelidis. 2009. Effects of crop load and time of thinning on the incidence of split pits, fruit yield, fruit quality, and leaf mineral contents in ‘Andross’ peach. J. Hort. Sci. Biotech. 84: 505–509.
- Evert, D. L., T. P. Gaines and B. G. Mullinix. 1988. Effects of split-pit on elemental concentrations of peach fruit during pit hardening. Sci. Hortic. 34: 55–65.
- Fukuda, F., Y. Tomita, Y. Aishima, K. Koumoto, Y. Fujii, K. Hirano, K. Morinaga and N. Kubota. 2017. Effect of flowering time on occurrence of reddish pulp in the peach. Hort. J. 86: 145–150.
- Fukuda, F., R. Yoshimura, H. Matsuoka and N. Kubota. 2006. Relationship between fruit enlargement and seed development with respect to physiological fruit drop in ‘Shimizu Hakuto’ peach. J. Japan. Soc. Hort. Sci. 75: 213–218.
- Han, Y. J., S. V. Bowers and R. B. Dodd. 1992. Nondestructive detection of split-pit peaches. Trans. ASAE 35: 2063–2067.
- Kadowaki, M., S. Nagashima, H. Akimoto and N. Sakurai. 2012. Detection of core rot symptom of Japanese pear (Pyrus pyrifolia cv. Kosui) by a nondestructive resonant method. J. Japan. Soc. Hort. Sci. 81: 327–331.
- Kubota, N., N. Nishiyama and K. Shimamura. 1993. Effects of girdling lateral bearing branches on astringency and phenolic contents of peach fruits. J. Japan. Soc. Hort. Sci. 62: 69–73 (In Japanese with English abstract).
- Miki, T. 1932. Studies on the development of peach fruits with special reference to the cause of their split-pit. Bull. Chiba Coll. Hort. 1: 1–118.
- Monet, R. and Y. Bastard. 1979. Split-pit of peaches. The effect of temperature. Annales de l’Amelioration des Plantes 29: 535–543.
- Muramatsu, N., N. Sakurai, N. Wada, R. Yamamoto, T. Takahara, T. Ogata, K. Tanaka, T. Asakura, Y. Ishikawa-Takano and D. J. Nevins. 1999. Evaluation of fruit tissue texture and internal disorders by laser Doppler detection. Postharvest Biol. Technol. 15: 83–88.
- Murayama, H., I. Konno, S. Terasaki, R. Yamamoto and N. Sakurai. 2006. Nondestructive method for measuring fruit ripening of ‘La France’ pears using a laser Doppler vibrometer. J. Japan. Soc. Hort. Sci. 75: 79–84.
- Nakano, M. and M. Nakamura. 2001. Cracking and mechanical properties of the stone in peach cultivars after severe thinning. Acta Hortic. 592: 531–536.
- Oveisi, Z., S. Minaei, S. Rafiee, A. Eyvani and A. Borghei. 2014. Application of vibration response technique for the firmness evaluation of pear fruit during storage. J. Food Sci. Technol. 51: 3261–3268.
- Prasad, K. 2015. Non-destructive Quality Analysis of Fruits. p. 239–258. In: M. Shamsher and A. M. Wasim Siddiqui (eds.). Postharvest quality assurance of fruits. Springer, Heidelberg.
- Ragland, C. H. 1934. The development of the peach fruit, with special reference to split-pit and gumming. Proc. Amer. Soc. Hort. Sci. 31: 1–21.
- Stone, M. L., P. R. Armstrong, X. Zhang, G. H. Brusewitz and D. D. Chen. 1996. Watermelon maturity determination in the field using acoustic impulse impedance techniques. Trans. ASAE 39: 2325–2330.
- Takahashi, M., M. Taniwaki, N. Sakurai, T. Ueno and H. Yakushiji. 2010. Changes in berry firmness of various grape cultivars on vines measured by nondestructive method before and after veraison. J. Japan. Soc. Hort. Sci. 79: 377–383.
- Tani, E., A. N. Polidoros and A. S. Tsaftaris. 2007. Characterization and expression analysis of FRUITFULL- and SHATTERPROOF-like genes from peach (Prunus persica) and their role in split-pit formation. Tree Physiol. 27: 649– 659.
- Taniwaki, M. and N. Sakurai. 2010. Evaluation of the internal quality of agricultural products using acoustic vibration techniques. J. Japan. Soc. Hort. Sci. 79: 113–128.
- Taniwaki, M., T. Hanada and N. Sakurai. 2009a. Postharvest quality evaluation of “Fuyu” and “Taishuu” persimmons using a nondestructive vibrational method and an acoustic vibration technique. Postharvest Biol. Technol. 51: 80–85.
- Taniwaki, M., T. Hanada, M. Tohro and N. Sakurai. 2009b. Non-destructive determination of the optimum eating ripeness of pears and their texture measurements using acoustical vibration techniques. Postharvest Biol. Technol. 51: 305–310.
- Taniwaki, M., M. Takahashi and N. Sakurai. 2009c. Determination of optimum ripeness for edibility of postharvest melons using nondestructive vibration. Food Res. Int. 42: 137–141.
- Taniwaki, M., M. Tohro and N. Sakurai. 2010. Measurement of ripening speed and determination of the optimum ripeness of melons by a nondestructive acoustic vibration method. Postharvest Biol. Technol. 56: 101–103.
- Terasaki, S., N. Sakurai, S. Kuroki, R. Yamamoto and D. J. Nevins. 2013. A new descriptive method for fruit firmness changes with various softening patterns of kiwifruit. Postharvest Biol. Technol. 62: 85–90.
- Terasaki, S., N. Sakurai, R. Yamamoto, N. Wada and D. J. Nevins. 2001a. Changes in cell wall polysaccharides of kiwifruit and the visco-elastic properties detected by a laser Doppler method. J. Japan. Soc. Hort. Sci. 70: 572–580.
- Terasaki, S., N. Sakurai, J. Zebrowski, H. Murayama, R. Yamamoto and D. J. Nevins. 2006. Laser Doppler vibrometer analysis of changes in elastic properties of ripening ‘La France’ pears after postharvest storage. Postharvest Biol. Technol. 42: 198–207.
- Terasaki, S., N. Wada, N. Sakurai, N. Muramatsu, R. Yamamoto and D. J. Nevins. 2001b. Nondestructive measurement of kiwifruit ripeness using a laser Doppler vibrometer. Trans. ASAE 44: 81–87.
- Woodbridge, C. G. 1978. Split-pit in peaches and nutrient levels. J. Amer. Soc. Hort. Sci. 103: 278–280.