Abstract
Split pit in peach (Prunus persica (L.) Batsch) fruit is an internal disorder that can have adverse effects on fruit quality and shelf stability. As it is difficult to distinguish split-pit fruit from normal fruit by appearance, a nondestructive detection method is desirable to determine accurately the timing of split-pit occurrence and remove unwanted fruit from trees. In our recent study, we used an acoustic vibration method for the nondestructive detection of split pit in harvested peach fruit. Here, we demonstrate that this method can be used to detect split pit in unpicked peach fruit. Time-course monitoring of growing fruit revealed that the ratio of the third (f3) to the second (f2) resonant frequency (f3/f2), which is an indicator of split pit in harvested fruit, abruptly increased in unpicked split-pit fruit from early June to early July. In contrast, the f3/f2 values of normal fruit remained low until harvest in late July. The increase in f3/f2 values of split-pit fruit was observed in early June (stage II of fruit growth) and/or from late June to early July (stage III of fruit growth), suggesting that, at least under the experimental conditions in the current study, pit splitting occurred at these two different timings. Split-pit fruit detection rate at harvest increased towards the end of the second split-pit occurrence and split pit could be predicted with high accuracy thereafter. These results collectively suggested that the timing of split-pit occurrence in unpicked peach fruit could be predicted accurately by measuring f3/f2 values and unwanted fruit with split pit could be distinguished from normal fruit on trees. We discuss the possible applications of the nondestructive acoustic vibration method in combination with fruit thinning and the future use of this method in research aiming to develop effective prevention methods or resistant cultivars with reduced split pit.
Introduction
Prunus fruit trees, including the peach (Prunus persica (L.) Batsch), bear characteristic fruit with a hardened, lignified endocarp called a stone or pit. Split pit, which is typically observed in peaches, is characterized by the splitting or fracture of the lignified endocarp along the suture line during fruit growth (Davis, 1941; Drogoudi et al., 2009; Evert et al., 1988; Miki, 1932; Ragland, 1934). Fruit with severe pit splitting can be predicted from such abnormal appearances as an oblong shape and/or stem end being pulled apart. In most cases, however, it is difficult to identify split-pit fruit by their external appearance because there are no clear indicators (Kritzinger et al., 2017; Ragland, 1934; Woodbridge, 1978). As pit splitting has been reported to adversely affect fruit quality (i.e., bitter taste, gumming and cracking of the pit) and shelf life (Crisosto et al., 1997; Kubota et al., 1993; Miki, 1932), the unavoidable contamination of sorted fruit with split-pit fruit reduces market value.
Pit splitting in peaches has been widely studied and various environmental and cultural factors have been associated with its occurrence. Some examples are temperature before and after pit hardening (Monet and Bastard, 1979), nutrition level and water status (Evert et al., 1988; Woodbridge, 1978), timing and intensity of thinning (Claypool et al., 1972; Drogoudi et al., 2009) and pruning (Burrell and Reighard, 2017; Fukuda et al., 2006), and girdling (Kubota et al., 1993). Cultivation practices that increase fruit size tend to promote split-pit occurrence and split-pit fruit have been shown to often be heavier than normal fruit (Claypool et al., 1972; Evert et al., 1988). In addition to the environmental and cultural factors, genetic factors have also been proposed because the tendency of split-pit occurrence differs significantly depending on the genotype. In general, most cases of pit splitting are considered to occur during stage II of fruit growth, which is a period of pit lignification and low fruit growth rate (Davis, 1941; Miki, 1932). Split pit is more likely to develop in early ripening cultivars than late ripening ones and outward forces generated during stage II and/or immediately after the onset of stage III of fruit growth (the period of rapid fruit enlargement towards maturity) pull apart the insufficiently hardened endocarp, resulting in split or fracture at a weak point along the suture line (Claypool et al., 1972; Kritzinger et al., 2017; Ragland, 1934; Woodbridge, 1978). Regarding molecular genetic studies on split pit, Tani et al. (2007, 2011) compared the expression of homologous genes controlling fruit development and dehiscence in Arabidopsis thaliana between split-pit susceptible and resistant peach cultivars. They found that temporal regulation of the expression of two MADS-box transcription protein coding genes, FRUITIFUL (FUL)- and SHATTERPROOF (SHP)-like, and a bHLH transcription factor coding gene, SPATULA (SPL)-like, may be involved in the regulation of endocarp margin development and split-pit formation. Despite these efforts, however, the detailed mechanism(s) and the accurate timing of split-pit occurrence on trees have yet to be fully understood, partly due to the lack of an efficient evaluation system for split pit in intact fruit. The development of a nondestructive method for split-pit fruit detection over the entire period of fruit growth is critical to deepen our understanding of pit splitting and develop effective prevention methods or resistant cultivars.
Among the nondestructive methods reported so far, the acoustic vibration method is promising because it can be used for the nondestructive assessment of the internal properties of intact fruit at a relatively low cost without lengthy analysis, in contrast with other nondestructive methods, such as magnetic resonance imaging (MRI) or X-ray computed tomography (CT) (Ali et al., 2017). The acoustic vibration method was initially developed to estimate fruit firmness (Taniwaki and Sakurai, 2010), but has seen increasing use in the evaluation of the maturity of various agricultural products, including persimmons (Taniwaki et al., 2009a), pears (Murayama et al., 2006; Oveisi et al., 2014; Taniwaki et al., 2009b; Terasaki et al., 2006), grapes (Takahashi et al., 2010), kiwifruit (Terasaki et al., 2013), melons (Taniwaki et al., 2009c, 2010), and watermelons (Abbaszadeh et al., 2015; Ali et al., 2017). In addition to fruit firmness, Kadowaki et al. (2012) adopted this method to detect the inner, local deterioration of Japanese pear fruit infected by core rot. In most of these studies, the second resonant frequency (f2) has been examined as an index because it reflects the internal physical traits of fruit, such as elasticity or viscosity (Cooke, 1972; Drake, 1962; Kadowaki et al., 2012). Furthermore, in our recent study, we developed an acoustic vibration method for detecting split pit in harvested peach fruit with a unique approach based on the ratio of the third (f3) to the second (f2) resonant frequency (f3/f2) (Nakano et al., 2018). Second resonant frequency was shifted to a much lower value in split-pit fruit than normal fruit, whereas f3 showed only small shifts (Nakano et al., 2018). Simulation models developed using the finite element method indicated that the high f3/f2 values of split-pit fruit may directly reflect split-pit occurrence (Nakano et al., 2018). Although this method has been applied to only harvested peach fruit so far, it should have the potential for use in monitoring split-pit occurrence in developing and unpicked peach fruit.
In this study, we demonstrated that the acoustic vibration method is effectively utilized for the nondestructive detection of split-pit peach fruit on trees. The relationship between time of acoustic vibration measurement and split-pit fruit detection rate at harvest was examined. From the results, the possible use of this method in combination with fruit thinning to diminish contamination by split-pit fruit at harvest is proposed and its future application to the development of effective prevention methods or resistant cultivars is discussed.
Materials and Methods
Plant materials
Three mature bearing trees of the ‘Shimizu Hakuto’ peach (Prunus persica (L.) Batsch) grown at the Research Farm of the Faculty of Agriculture, Okayama University (Okayama, Japan) were used in this study. The trees were grown under a cover against rain, although rainfall outside the cover could affect tree water status through underground water influx. Conventional cultivation methods were used for tree management, except that more intense flower/fruit thinning than usually practiced was applied to promote pit splitting. Sixty fruit (20 fruit per tree) around the middle part of each tree were randomly selected and labeled to measure acoustic vibration.
Acoustic vibration measurement of growing fruit on trees
To measure the acoustic vibrations of growing fruit on trees, a portable system composed of a device for resonant frequency measurement (Model NSP-1; Applied Vibro-Acoustics, Inc., Higashi-Hiroshima, Japan) and a tablet personal computer was used (Fig. 1). Each fruit was sandwiched between a portable speaker and a piezoelectric sensor, and f2 and f3, as well as calculated f3/f2 values, were analyzed essentially as described in Nakano et al. (2018). In the early stage of fruit growth, vibrations from the portable speaker were applied to the fruit in the range of 300–4000 Hz in the sweep mode, and then the upper limit of the vibration range was gradually decreased to 2000 Hz as fruit firmness decreased towards maturity. Acoustic vibration measurements were conducted twice a week from June 1 to July 29, 2017 and the timing of split-pit occurrence in individual fruit was speculated from the rapid increase in f3/f2 values. Fruit width was measured at the same interval from May 25 to July 29 to estimate the growth stage. Rainfall data in Okayama city during this period were obtained from the website of the Japan Meteorological Agency (http://www.jma.go.jp/jma/index.html). Fifty-six fruit remaining on trees until harvest were collected at the same time on July 29, which lies in the middle of the commercial harvest time of ‘Shimizu Hakuto’ in the Okayama area. Harvested fruit were used for the measurement of fruit quality and ripening traits and the evaluation of pit splitting, as described below.

After recording fruit weight, ethylene production was measured according to Asiche et al. (2017) with slight modifications. Briefly, individual fruit were incubated in a 1.3 L plastic container at room temperature. After 30 min, 1 mL of headspace gas was withdrawn and injected into a gas chromatograph (GC8 CMPF; Shimadzu, Kyoto, Japan) equipped with a flame ionization detector (set at 200°C) and an activated alumina column (ϕ 4 mm × 1 m) set at 80°C. Then, flesh penetration force was measured using a rheometer (FUDOH RTC Rheometer; RHEOTECH, Tokyo, Japan) with a 3-mm-diameter cylindrical plunger according to Nakano et al. (2018). Soluble solids content (SSC) and pH were measured with a refractometer (PR-1; Atago, Tokyo, Japan) and a pH meter (B-712; HORIBA, Kyoto, Japan), respectively. Mean values were compared between normal and split-pit fruit.
Split-pit evaluation
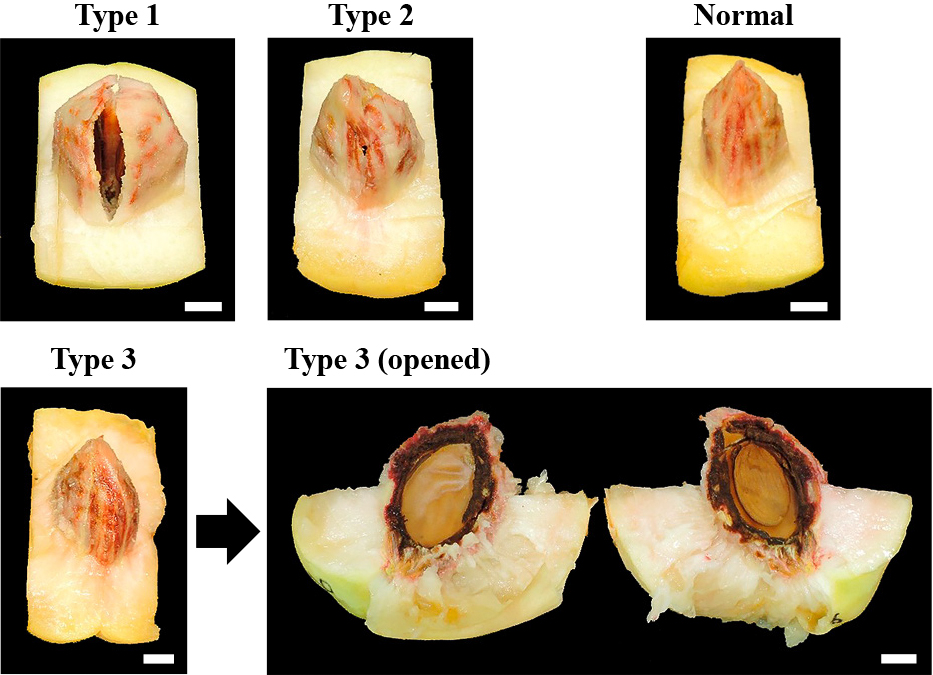
Actual split-pit occurrence in flesh was evaluated after harvest on the basis of the following criteria. First, the pit of each individual fruit was exposed along its suture line and pit splitting was checked by examining the physical appearance. Split-pit fruit determined visually were further divided into two groups according to the degree of pit splitting: Type 1, fruit with severe pit splitting (>2 mm in width and >5 mm in length), and Type 2, fruit with slight pit splitting (either <2 mm in width or <5 mm in length). Appearances of pit splitting in Type 1 and Type 2 fruit were quite different, and fruit with intermediate pit splitting were not observed in this study. The remaining fruit that could not be assessed by appearance were examined by sticking a knife into the suture line of the pit. The fruit with a pit that was easily penetrated and cut into halves with a knife were categorized as Type 3 split-pit fruit, while those with pits that could not be cut by the knife regardless of repeated thrusts were categorized as normal fruit. Consequently, the 56 harvested fruit were divided into Types 1–3 split-pit fruit and normal fruit (Fig. 2). Callus and resin accumulation were observed on the inner surface of the pit along the suture line in all Type 3 split-pit fruit, as shown in Figure 2 (Type 3 (opened)).
As for the split-pit occurrence confirmed after harvest, the number of split-pit fruit that were correctly detected and the number of normal fruit that were missorted as split-pit fruit were examined for each measurement point by setting the f3/f2 cut-off values at >1.4, >1.45, and >1.5. The split-pit fruit detection rate and normal fruit misdetection rate were expressed as percentages of each estimated number on each measurement date relative to the actual number of split-pit and normal fruit at harvest, respectively.
Results and Discussion
Changes in acoustic vibration profiles of split-pit fruit during growth
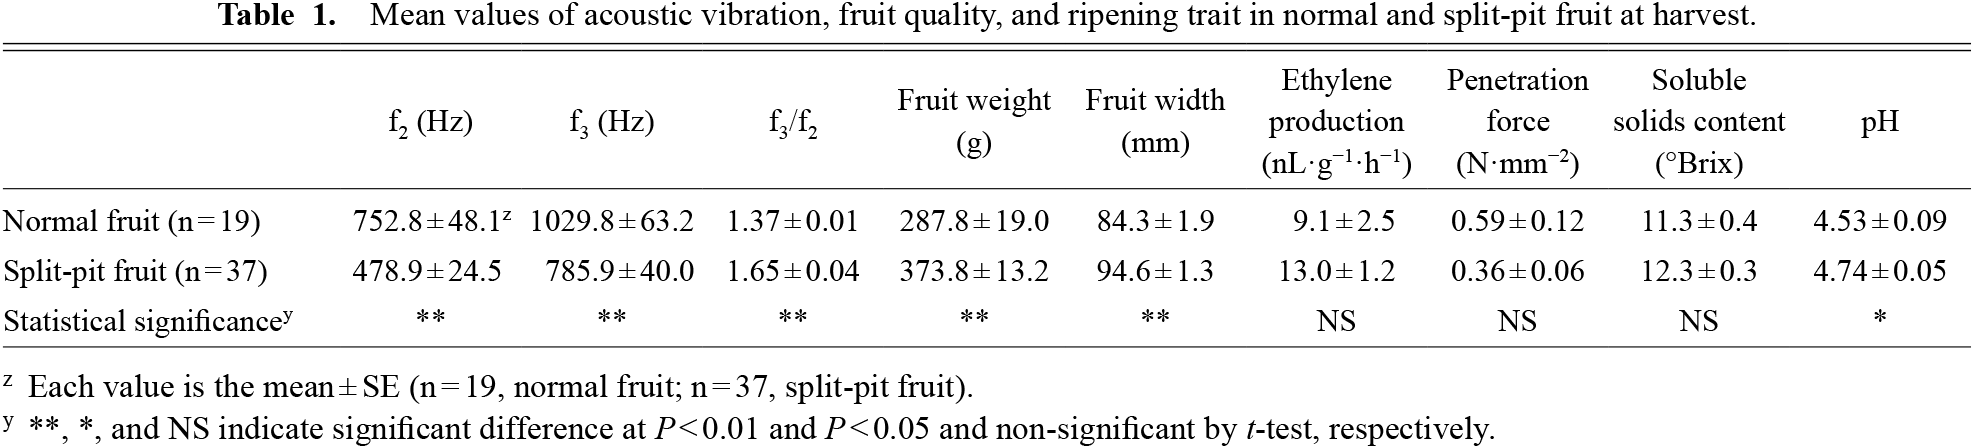
Among the 56 fruit tested, 19 and 37 were normal and split-pit fruit, respectively. The 37 split-pit fruit were further divided into Types 1–3 split-pit fruit, each of which included 27, five, and five fruit, respectively. The split-pit fruit were always larger than the normal fruit during the period investigated, and the average fruit width difference was more than 10 mm at harvest (Fig. 3; Table 1). Similarly, the average weight of split-pit fruit was higher than that of normal fruit by approximately 86 g at harvest (Table 1). These results are consistent with previous reports (Claypool et al., 1972; Evert et al., 1988) showing that split-pit fruit were heavier than normal fruit. Based on the double-sigmoid growth patterns of tested fruit, stage II of fruit growth was considered to start in early June (around June 1st) and continue until late June (around June 20th), and this was followed by the initiation of stage III of fruit growth in both normal and split-pit fruit (Fig. 3).

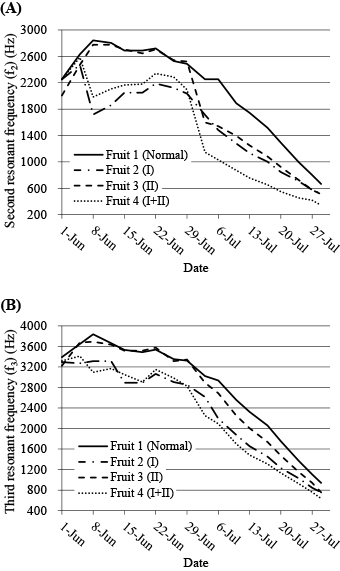
Although both f2 and f3 gradually decreased in all the tested fruit with growth, three typical patterns of the sudden decrease in f2 were observed in only split-pit fruit. Figure 4 shows changes in f2 and f3 of typical fruit. The second resonant frequency decreased in early June (I), after late June (II), or twice at both times (I+II) in split-pit fruit (Fig. 4A). On the other hand, differences in f3 were relatively small and a similar decrease pattern was observed for normal and split-pit fruit (Fig. 4B). Considering that similar tendencies of f2 and f3 were observed in split-pit fruit at harvest (Nakano et al., 2018), the sudden decreases in f2 may be directly caused by the split-pit occurrence on trees, although split-pit evaluation just after the sudden decreases in f2 is needed to strictly confirm this assumption. Thus, we next examined the change in f3/f2 values of each fruit, which would allow us to speculate the exact timing of split-pit occurrence on trees.
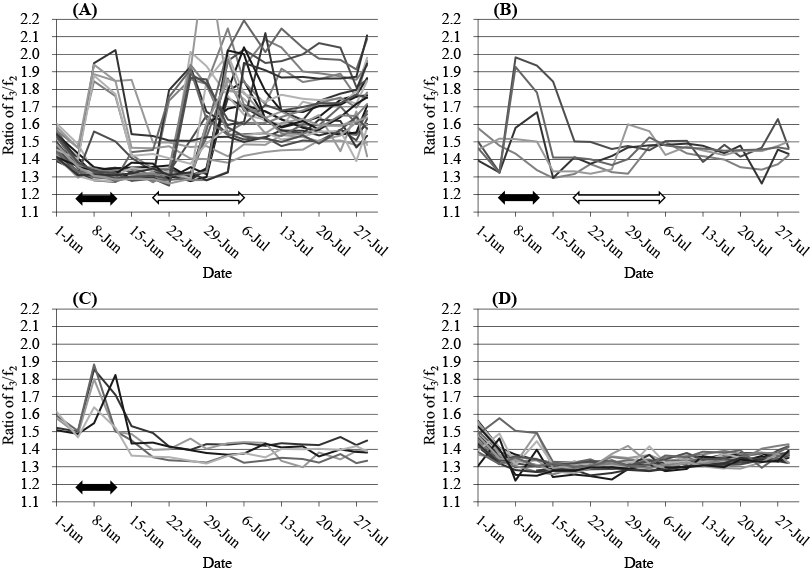
Changes in f3/f2 values of individual fruit categorized as Types 1–3 split-pit fruit and normal fruit were compared (Fig. 5). Corresponding to the sudden decreases in f2, sudden increases in f3/f2 values were observed in split-pit fruit from early June to early July (Fig. 5A–C). In contrast, such an increase was not observed in normal fruit until harvest (Fig. 5D), suggesting that the increase in f3/f2 values could effectively detect split-pit occurrence in growing fruit on trees. Unexpectedly, we found that there were at least two estimated times when pit splitting occurred and the timing of split-pit occurrence in each fruit was closely related to the severity of pit splitting at harvest (i.e., Types 1–3). In a general classification, increases in f3/f2 values were observed in stage II in early June (from June 5th to 12th) and/or in stage III from late June to early July (from June 19th to July 6th). In the 27 Type 1 split-pit fruit that showed severe pit splitting at harvest, six exhibited increases in f3/f2 values in early June and almost all fruit showed large increases in f3/f2 values after late June, which were maintained until harvest (Fig. 5A). In most of the Type 2 split-pit fruit with slight pit splitting, the initial increase in f3/f2 value in early June and the second increase from late June to early July or maintenance at a relatively high value were observed (Fig. 5B). On the other hand, in Type 3 split-pit fruit in which pit splitting could not be identified visually and had to be confirmed with a knife, the f3/f2 values increased only once in early June and decreased soon after to remain low and similar to that of normal fruit until harvest (Fig. 5C). This trend in Type 3 split-pit fruit could be explained by the assumption that the slight pit splitting in early June narrowed or closed up by callus formation and/or resin in the flesh. In fact, callus and resin accumulation were observed on the inner surface of the pit along the suture line in all Type 3 split-pit fruit (Fig. 2). It is noteworthy that these fruit with a repaired split at harvest were not a problem in terms of practical cultivation or consumer acceptance and should not be removed. These results collectively indicated that the timing of increase and plateauing of f3/f2 values reflects the degree of pit splitting, and the second pit splitting after late June leads to severe problems at harvest.
It is important to determine the optimal timing and cut-off value of split-pit fruit detection with the acoustic vibration method for practical use in cultivation management, such as fruit thinning. Figure 6 shows how the split-pit fruit detection rate, which was confirmed at harvest, varied depending on the measurement point when the f3/f2 cut-off value was set at >1.4, >1.45, and >1.5. On June 1, high f3/f2 values were observed in all tested fruit regardless of split-pit occurrence (Fig. 5) and both split-pit fruit detection rate and normal fruit misdetection rate showed abnormally high values regardless of f3/f2 cut-off values (Fig. 6). This is probably because pit hardening during stage II of fruit growth was just starting and all the flesh was still too hard to detect split-pit occurrence. Both the split-pit fruit detection rate and normal fruit misdetection rate appeared to be evaluated properly with the progress of pit lignification. There was no misdetection of normal fruit as split-pit fruit from the middle of June through harvest when the f3/f2 cut-off value was set at >1.45 or >1.5 (Fig. 6B). On the other hand, the split-pit fruit detection rate gradually increased towards the end of the second split-pit occurrence from late June to early July and pit splitting could be predicted with high accuracy (75.7–81.1% or 83.8–94.6%) thereafter when the f3/f2 cut-off value was set at >1.45 or >1.4, respectively (Fig. 6A). Note that Type 3 split-pit fruit (n = 5) were categorized as split-pit fruit in this experiment despite the fact that it would be better to treat these fruit as normal fruit in terms of practical cultivation or consumer acceptance. Type 3 split-pit fruit showed relatively low f3/f2 values similar to normal fruit when first pit splitting in early June was narrowed or closed up by a callus and/or resin accumulation. When these split-pit fruit were included in normal fruit, much higher split-pit fruit detection rates (87.5–93.8% or 90.6–100%) were obtained after early July when the f3/f2 cut-off values were set at >1.45 or >1.4, respectively (data not shown).
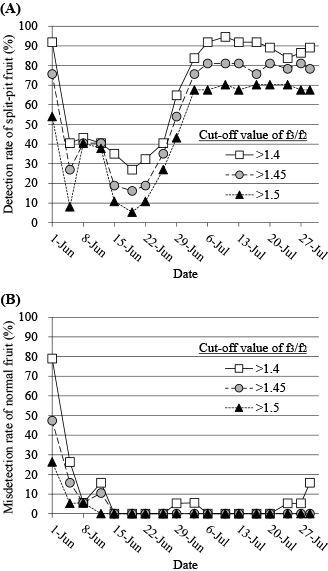
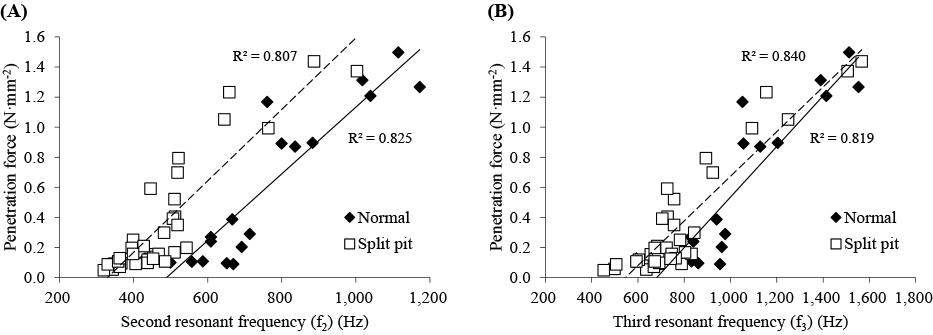
Figure 7 shows the scatter plots of flesh firmness (penetration force) versus f2 and f3 in normal and split-pit fruit at harvest. Consistent with the results obtained by Nakano et al. (2018) and the time-course monitoring of f2 and f3 in this study (Fig. 4), f2 and f3 were lower in split-pit fruit than normal fruit, even when comparing fruit with similar penetration forces (Fig. 7; Table 1). The differences in f2 were larger than those in f3, also consistent with the results of Nakano et al. (2018). Interestingly, strong positive linear correlations (R2 > 0.8, P < 0.01) were observed between penetration forces and f2 or f3 in both normal and split-pit fruit (Fig. 7). Such strong correlations with penetration forces were also observed for f3 (R2 = 0.82, P < 0.01), even when scores from normal and split-pit fruit were grouped together for calculation, whereas the R2 value decreased to 0.71 (P < 0.01) in the case of f2 (data not shown). These results strongly suggested that the optimal harvest time for fruit with the desired maturity could be predicted on trees using f3 regardless of split-pit occurrence.
Besides acoustic vibrations (f2, f3, and f3/f2) and fruit size (fruit weight and width), the pH of split-pit fruit was significantly higher than that of normal fruit (Table 1), suggesting that acid reduction could be advanced in split-pit fruit. Although significant differences were not observed for other ripening-related traits, such as ethylene production, penetration force, and SSC, between normal and split-pit fruit, tendencies towards increased ethylene production and SSC and decreased penetration force were observed in split-pit fruit (Table 1). It was reported in Yamada (2002) that pit splitting has a maturity-promoting effect on peach fruit on trees. Our results support this observation. In this study, fruit around the middle part of the trees were randomly selected for analyses. In peaches, ripening greatly depends on fruit position in the canopy. Thus, it is necessary to compare split-pit fruit with normal fruit bearing near the canopy position to evaluate more precisely the influence of pit splitting on fruit maturity.
Application of the acoustic vibration method to practical cultivation management
Nakano et al. (2018) previously demonstrated that split pit in harvested peach fruit can be detected using the acoustic vibration method and a unique approach based on the f3/f2 value. They suggested the installation of an acoustic vibration device in peach sorting lines to sort split-pit fruit from normal fruit and estimate fruit maturity. We have demonstrated that the acoustic vibration method could be used to monitor the estimated timing of split-pit occurrence during fruit development on trees. We have also revealed that pit splitting could occur in at least two different periods and the timings of split-pit occurrence are closely related to the severity of pit splitting at harvest. As it has been difficult to precisely determine pit splitting in unharvested peach fruit, the acoustic vibration method could be effectively utilized for both practical cultivation management and future research.
For practical cultivation management, the acoustic vibration method could be a powerful tool that could enable us to perform fruit thinning efficiently. Using the acoustic vibration method, undesired fruit with split pit could be distinguished from normal fruit and removed preferentially. This would also save money and time needed for subsequent management, such as fruit bagging, harvest, and fruit sorting. As described in Figure 6, the split-pit fruit detection rate and the normal fruit misdetection rate varied considerably depending on the measurement date and the f3/f2 cut-off value. It should be noted that selecting the appropriate timing and/or f3/f2 cut-off value of split-pit fruit detection according to individual cultivation plans is very important. Split-pit fruit at harvest can be predicted with high accuracy after the second pit splitting from late June to early July (Fig. 6). In some orchards in the Okayama area, final fruit thinning followed by bagging is performed around this period. Split-pit fruit detection using f3/f2 cut-off values of 1.4–1.45 at the timing of final fruit thinning would be highly effective. The third resonant frequency could be also a good indicator to estimate the appropriate harvest time of individual fruit on trees (Fig. 7). For this purpose, we are now developing mobile-type acoustic vibration devices that can detect split pit and estimate harvest maturity much more easily and rapidly.
Use of acoustic vibration method in future research, development of new cultivation techniques, and breeding resistant cultivars to reduce split-pit occurrence
Although most cases of pit splitting have been considered to occur around pit hardening during stage II of fruit growth (Davis, 1941; Miki, 1932), there is little experimental evidence on the accurate timing of split-pit occurrence. In this study, use of the acoustic vibration method and nondestructive monitoring of the same fruit during development have enabled us to estimate the accurate timing of split-pit occurrence in individual fruit through sharp increases in f3/f2 values. Thus, we evaluated the relationship between the estimated timing of split-pit occurrence and the growth stage in each fruit. The timings of the first and second split-pit occurrences overlapped from the early to the intermediate period of stage II of fruit growth and the early period of stage III of fruit growth, respectively (Fig. 3). These results strongly suggested that, at least under the experimental conditions in the current study, pit splitting occurred not only during stage II of fruit growth, but also in the early period of stage III of fruit growth. In the latter period of 2017, a lot of rainfall was recorded in the Okayama area (Fig. 3), which may have promoted rapid fruit swelling in stage III of fruit growth and the resulting split-pit occurrence. Similary, heavy rainfall on June 7 may have affected pit splitting during stage II of fruit growth. Continuous research on the relationship among the estimated timing of split-pit occurrence, fruit growth stage, and environmental and cultivation conditions, as well as investigation of annual changes with several different cultivars, will help us understand the mechanism(s) of pit splitting and develop cultivation techniques to prevent it.
As discussed above, the acoustic vibration method could offer novel insights into the genetic and environmental factors regulating split-pit occurrence. It could also enable us to investigate the relationship between split-pit occurrence and fruit ripening. Continuous research on the changes in acoustic vibration profiles of various peach cultivars grown under different environmental conditions is essential to identify cultivar and/or environmental differences leading to pit splitting susceptibility. Most importantly, the obtained insights into the mechanism(s) and factor(s) of pit splitting could lead to the development of effective cultivation methods or resistant peach cultivars that could enable us to suppress pit splitting consistently. Further development of a new simplified device for measurement in commercial orchards and/or accumulation of acoustic information regarding the annual changes and growing conditions are anticipated for the full use of the acoustic vibration method in both practical fields and basic mechanism analyses. The nondestructive detection of split-pit peach fruit on trees has shown its potential to provide a platform for creating solutions to the long-standing problem of pit splitting.
Literature Cited
- Abbaszadeh, R., A. Moosavian, A. Rajabipour and G. Najafi. 2015. An intelligent procedure for watermelon ripeness detection based on vibration signals. J. Food Sci. Technol. 52: 1075–1081.
- Ali, M. M., N. Hashim, S. K. Bejo and R. Shamsudin. 2017. Rapid and nondestructive techniques for internal and external quality evaluation of watermelons: A review. Sci. Hortic. 225: 689–699.
- Asiche, W. O., O. W. Mitalo, Y. Kasahara, Y. Tosa, E. G. Mworia, K. Ushijima, R. Nakano and Y. Kubo. 2017. Effect of storage temperature on fruit ripening in three kiwifruit cultivars. Hort. J. 86: 403–410.
- Burrell, R. E. and G. L. Reighard. 2017. Late dormant pruning affects split pit incidence in peach. Acta Hortic. 1177: 157–164.
- Claypool, L. L., K. Uriu and P. F. Lasker. 1972. Split-pit of ‘Dixon’ cling peaches in relation to cultural factors. J. Amer. Soc. Hort. Sci. 97: 181–185.
- Cooke, J. R. 1972. An interpretation of the resonant behavior of intact fruits and vegetables. Trans. ASAE 15: 1075–1080.
- Crisosto, C. H., R. S. Johnson, K. R. Day and T. DeJong. 1997. Orchard factors affecting postharvest stone fruit quality. HortScience 32: 820–823.
- Davis, L. D. 1941. Split-pit of peaches: Estimation of time when splitting occurs. Proc. Amer. Soc. Hort. Sci. 39: 183–189.
- Drake, B. 1962. Automatic recording of vibrational properties of foodstuffs. J. Food Sci. 27: 182–188.
- Drogoudi, P. D., C. G. Tsipouridis and G. Pantelidis. 2009. Effects of crop load and time of thinning on the incidence of split pits, fruit yield, fruit quality, and leaf mineral contents in ‘Andross’ peach. J. Hort. Sci. Biotech. 84: 505–509.
- Evert, D. L., T. P. Gaines and B. G. Mullinix. 1988. Effects of split-pit on elemental concentrations of peach fruit during pit hardening. Sci. Hortic. 34: 55–65.
- Fukuda, F., R. Yoshimura, H. Matsuoka and N. Kubota. 2006. Relationship between fruit enlargement and seed development with respect to physiological fruit drop in ‘Shimizu Hakuto’ peach. J. Japan. Soc. Hort. Sci. 75: 213–218.
- Kadowaki, M., S. Nagashima, H. Akimoto and N. Sakurai. 2012. Detection of core rot symptom of Japanese pear (Pyrus pyrifolia cv. Kosui) by a nondestructive resonant method. J. Japan. Soc. Hort. Sci. 81: 327–331.
- Kritzinger, I., E. Lӧtze and M. Jooste. 2017. Stone hardening and broken stones in Japanese plums (Prunus salicina Lindl.) evaluated by means of computed tomography scans. Sci. Hortic. 221: 1–9.
- Kubota, N., N. Nishiyama and K. Shimamura. 1993. Effects of girdling lateral bearing branches on astringency and phenolic contents of peach fruits. J. Japan. Soc. Hort. Sci. 62: 69–73 (In Japanese with English abstract).
- Miki, T. 1932. Studies on the development of peach fruits with special reference to the cause of their split-pit. Bull. Chiba Coll. Hort. 1: 1–118.
- Monet, R. and Y. Bastard. 1979. Split-pit of peaches. The effect of temperature. Annales de l’Amelioration des Plantes 29: 535–543.
- Murayama, H., I. Konno, S. Terasaki, R. Yamamoto and N. Sakurai. 2006. Nondestructive method for measuring fruit ripening of ‘La France’ pears using a laser Doppler vibrometer. J. Japan. Soc. Hort. Sci. 75: 79–84.
- Nakano, R., H. Akimoto, F. Fukuda, T. Kawai, K. Ushijima, Y. Fukamatsu, Y. Kubo, Y. Fujii, K. Hirano, K. Morinaga and N. Sakurai. 2018. Nondestructive detection of split pit in peaches using an acoustic vibration method. Hort. J. 87: 281–287.
- Oveisi, Z., S. Minaei, S. Rafiee, A. Eyvani and A. Borghei. 2014. Application of vibration response technique for the firmness evaluation of pear fruit during storage. J. Food Sci. Technol. 51: 3261–3268.
- Ragland, C. H. 1934. The development of the peach fruit, with special reference to split-pit and gumming. Proc. Amer. Soc. Hort. Sci. 31: 1–21.
- Takahashi, M., M. Taniwaki, N. Sakurai, T. Ueno and H. Yakushiji. 2010. Changes in berry firmness of various grape cultivars on vines measured by nondestructive method before and after veraison. J. Japan. Soc. Hort. Sci. 79: 377–383.
- Tani, E., A. N. Polidoros and A. S. Tsaftaris. 2007. Characterization and expression analysis of FRUITFULL- and SHATTERPROOF-like genes from peach (Prunus persica) and their role in split-pit formation. Tree Physiol. 27: 649–659.
- Tani, E., A. Tsaballa, C. Stedel, C. Kalloniati, D. Papaefthimiou, A. Polidoros, N. Darzentas, I. Ganopoulos, E. Flemetakis, P. Katinakis and A. Tsaftaris. 2011. The study of a SPATULA-like bHLH transcription factor expressed during peach (Prunus persica) fruit development. Plant Physiol. Biochem. 49: 654–663.
- Taniwaki, M. and N. Sakurai. 2010. Evaluation of the internal quality of agricultural products using acoustic vibration techniques. J. Japan. Soc. Hort. Sci. 79: 113–128.
- Taniwaki, M., T. Hanada and N. Sakurai. 2009a. Postharvest quality evaluation of “Fuyu” and “Taishuu” persimmons using a nondestructive vibrational method and an acoustic vibration technique. Postharvest Biol. Technol. 51: 80–85.
- Taniwaki, M., T. Hanada, M. Tohro and N. Sakurai. 2009b. Nondestructive determination of the optimum eating ripeness of pears and their texture measurements using acoustical vibration techniques. Postharvest Biol. Technol. 51: 305–310.
- Taniwaki, M., M. Takahashi and N. Sakurai. 2009c. Determination of optimum ripeness for edibility of postharvest melons using nondestructive vibration. Food Res. Int. 42: 137–141.
- Taniwaki, M., M. Tohro and N. Sakurai. 2010. Measurement of ripening speed and determination of the optimum ripeness of melons by a nondestructive acoustic vibration method. Postharvest Biol. Technol. 56: 101–103.
- Terasaki, S., N. Sakurai, S. Kuroki, R. Yamamoto and D. J. Nevins. 2013. A new descriptive method for fruit firmness changes with various softening patterns of kiwifruit. Postharvest Biol. Technol. 62: 85–90.
- Terasaki, S., N. Sakurai, J. Zebrowski, H. Murayama, R. Yamamoto and D. J. Nevins. 2006. Laser Doppler vibrometer analysis of changes in elastic properties of ripening ‘La France’ pears after postharvest storage. Postharvest Biol. Technol. 42: 198–207.
- Woodbridge, C. G. 1978. Split-pit in peaches and nutrient levels. J. Amer. Soc. Hort. Sci. 103: 278–280.
- Yamada, H. 2002. Physiological disorder, natural disaster, pest and disease. p. 221. In: F. Mizutani (eds.). Saishinkajuengeigaku (In Japanese). Asakurashoten, Tokyo.
