Abstract
We investigated the vertical 137Cs distribution in soil among five sod culture orchards with different soil textures over six years after 2011, when 137Cs fallout was released by the Fukushima Daiichi Nuclear Power Plant accident, to confirm the long-term 137Cs downward-migration into soil. At each orchard, soil cores were collected to a depth of 30 cm and subdivided into intervals of 3 to 9 cm. The 137Cs within the 3 cm of topsoil decreased from 84–94% during the first 7 months after deposition in 2011 to 41–75% in 2017. From 2012 onward, the vertical 137Cs profiles in the soils were explained by a two-component negative exponential model composed of a rapid and a slow component with a change of slope at a depth of 6 to 9 cm. It took 4 years after deposition to show a significant difference in the value of the average 137Cs migration distance (Md) among the orchards. The speed of 137Cs migration in the orchards during the 6 years after the accident year was 0.44 to 0.97 cm year−1 based on the Md. There was a significant positive correlation between Md and fine sand content in the 3 cm of topsoil between Md and the ratio of the total carbon content (TC) at a depth of 3 to 6 cm to that in the top 3 cm of soil. Furthermore, the percentage of exchangeable 137Cs (ex-137Cs) to 137Cs at 3 to 6 cm depth increased significantly in proportion to the ratio of TC at 3 to 6 cm depth to TC at 0 to 3 cm depth in soil collected in 2013. These findings indicate that one of the mobile forms of 137Cs was ex-137Cs combined with TC and that the fine sand content and TC influenced the 137Cs downward-migration in the 3 cm of topsoil in the orchard in which organic matter accumulated by sod culture.
Introduction
On 11 March 2011, the Tohoku earthquake caused a huge tsunami that resulted in a partial core meltdown in units 1, 2, and 3 of the Fukushima Daiichi Nuclear Power Plant (FDNPP), followed by a series of hydrogen explosions in units 1, 3, and 4. Large amounts of radionuclides were released into the environment from 12 to 14 March 2011 after the FDNPP accident (International Atomic Energy Agency, 2015). Radioactive deposition was caused primarily by rainfall and snowfall on 15 March 2011 (Chino et al., 2011; Imanaka, 2012). This fallout contaminated all fruit production orchards in Fukushima Prefecture, one of the main areas of deciduous fruit production in Japan (Ministry of Agriculture, Forestry and Fisheries, 2017).
Since sod culture is conducted as a soil management method in orchards, they are characterized by being covered with plentiful grass. At least until autumn 2011, more than 90% of the radiocesium (RCs) in the soil in orchards remained in the top 3 cm (Sato, 2014), where there is an abundance of grass roots that grow under the fruit trees in most orchards in Fukushima Prefecture. Since roots of fruit trees grow below 3 cm, there was concern that if RCs migrated further down in the soil profile, they may eventually enter the rooting zone of the trees, resulting in enhancement of their RCs uptake from the soil. Studies after the Chernobyl accident revealed that the rate of downward RCs migration in soil varies with soil type (Arapis et al., 1997; Rosén et al., 1999; Schimmack et al., 1989, 1997; Shand et al., 2013), texture and physicochemical properties (Forsberg and Strandmark, 2001; International Atomic Energy Agency, 2010; Niesiobędzka, 2000; Strebl et al., 1996; Zygmunt et al., 1998), and with rainfall (Schimmack et al., 1994; Shiozawa, 2013). In recent years, both mineral clay (Cremers et al., 1988; Tsukada et al., 2008) and organic matter (Niesiobędzka, 2000; Shand et al., 2013) have been identified as factors that affect the accumulation and migration of RCs in soil. Interestingly, Shiraishi (1973) pointed out that the effective half-life of the temporal 137Cs concentration ([137Cs]) in the fruits of Satsuma orange trees growing in soils contaminated by global fallout very closely agreed with that of the exchangeable 137Cs concentration ([ex-137Cs]) in the soil.
In the first 2 or 3 years after the FDNPP accident there were numerous short-term studies of the vertical soil profiles of RCs in forest, grassland, and agricultural fields (Fujii et al., 2014; Kato et al., 2012; Koarashi et al., 2012a, b; Kusaba et al., 2015; Matsunaga et al., 2013; Nakanishi et al., 2014; Ogura et al., 2014; Ohno et al., 2012; Shiozawa, 2013; Takahashi et al., 2015; Tanaka et al., 2012; Teramage et al., 2014). However, of these previous studies, only three examined orchard soils (Koarashi et al., 2012a, b; Kusaba et al., 2015; Matsunaga et al., 2013), and only Kusaba et al. (2015) mentioned orchards, whereas Koarashi et al. (2012a) and Matsunaga et al. (2013) categorized orchards as croplands along with herbaceous crops such as rice (paddies), onion, and buckwheat in their study (Koarashi et al., 2012a). Therefore, there is little information about RCs profiles in orchard soils after both the accident at Chernobyl (Carini and Lombi, 1997) and the FDNPP accident. Furthermore, to our knowledge, there has been no long-term study of RCs profiles in orchard soils in the years following the FDNPP accident.
Prediction of long-term changes in the vertical distribution of RCs is important for assessing the risk of RCs transfer into fruit and for developing decontamination programs focused on enhancing RCs uptake from orchard soils. Of all the RCs, 137Cs is the most important contributor to soil contamination because it was one of the dominant radionuclides released following the FDNPP accident and has a long radiological half-life (30.1 years). 137Cs was therefore selected as the target for our examination. A model of the migration of 137Cs downward in soil is needed to predict the vertical distribution of RCs. Several models based on a one-component negative exponential function (Strebl et al., 1996; Velasco et al., 1997), a soil–soil solution distribution coefficient (International Atomic Energy Agency, 2010; Unno et al., 2017), or other factors (Mamikhin, 1995) have been proposed. Most models in studies after the FDNPP accident applied the one-component negative exponential function. However, information on the 137Cs vertical profile model for orchard soil is lacking. Meanwhile, Shiraishi and Okabayashi (1967) found that vertical distributions of 137Cs in topsoil down to a depth of 30 cm in a Satsuma orange orchard contaminated by global fallout showed two-component negative exponential functions, which consist of two “mobility factors”, a large one in the 2-cm topsoil and a small one below 2 cm. To our knowledge, no study has validated the model of vertical 137Cs migration using two-component negative exponential functions in either orchards or in other terrestrial land. Furthermore, Shiraishi and Okabayashi (1967) pointed out that 20 to 30 cm of sampling depth was needed to investigate the vertical 137Cs distribution in soil in Satsuma orange orchards. As mentioned above, there are no studies on the long-term 137Cs downward-migration into soil by examining to a depth of 30 cm at the same site after the FDNPP accident.
The aim of this study was to (i) confirm the temporal changes in [137Cs] among five orchards with different soil textures in the 6 years after the FDNPP accident; (ii) to examine the validity of fitting the vertical distributions of 137Cs in orchard soil to a two-component negative exponential decay function model; and (iii) to identify the factors that affect the vertical migration of 137Cs in orchards.
Materials and Methods
Study sites
Five orchards approximately 60 to 65 km northwest of the FDNPP were selected for investigation. Three of them belonged to the Fruit Tree Research Center (FTRC), Fukushima Agricultural Technology Center in the city of Fukushima: a peach orchard [Prunus persica (L.) Batsch] ‘Akatsuki’ (AO), an apple orchard (Malus pumila Mill.) ‘Kougyoku’ (‘Jonathan’) (KO), and a ‘Mishima Fuji’ apple orchard (MO). The soil at MO was imported from the Yamakiya area, where soil is a granite type, approximately 40 years before the FDNPP accident to investigate fertilization. The other two were a ‘Hatsuhime’ peach orchard (HO) in the town of Kohri and a ‘Fuji’ apple orchard (FO) in the city of Fukushima. According to the results of an airborne monitoring survey conducted by the Ministry of Education, Culture, Sports, Science and Technology (2011), on 26 May 2011 the deposition densities or inventories of 137Cs were 100 to 300 kBq·m−2 at FTRC, < 100 kBq·m−2 at HO, and 300 to 600 kBq·m−2 at FO. The observation area in each orchard was approximately 500 to 1500 m2. The soil at HO was classified as a brown lowland soil; those in the other orchards were classified as brown forest soils (Obara et al., 2011). Sod culture was practiced in every orchard we studied. The topsoil was not cultivated and was left undisturbed at all of the survey sites. The main grass species were Poa pratensis L. (Kentucky bluegrass, KB) and Trifolium repens L. (white clover, WC) at AO, KO, MO, and FO, and Capsella bursa-pastoris (L.) Medik (shepherd’s-purse) and Digitaria ciliaris (Retz.) Koeler at HO. Total precipitation in the period from April to November in each year from 2011 to 2017 in FTRC was 969 mm, 722.5 mm, 909 mm, 1011.5 mm, 809 mm, 799 mm and 971 mm, respectively. The precipitation intensity reached 87 mm per day particularly on 10 September 2015, which is recorded as “Heisei 27 September Kanto-Tohoku heavy rain”.
Soil sampling to examine temporal changes in the depth profile of 137Cs
Topsoil down to a depth of 30 cm was collected from each orchard with a stainless-steel core sampler (83 mm inside diameter), which was made in-house by the Research Center for Electron Photon Science at Tohoku University. Khomutinin et al. (2004) recommended sampling areas of > 50 cm2 to avoid any dependence on the variability of the 137Cs inventory on the sampling scale. The core sampler that we used had a cross-sectional area of 54 cm2 and thus satisfied this criterion. To prevent contamination, the inner surface of the core sampler was wiped with a paper towel moistened with deionized water before each sampling. Table 1 shows the sampling days and locations; note that replicates were not taken at each sampling in 2011. The above-ground parts of the grass at the sampling location were removed with pruning scissors before sampling. Each core sample was subdivided into 6 to 10 portions of 3 to 9 cm thickness by using a kitchen knife and a semicircular plate with the same diameter as the core sampler on one side to examine the vertical distribution of 137Cs. Each sample was mixed well after the removal of rocks over 2-mm in diameter and then placed in a plastic counting vessel (U-8 vessel; 5 cm in diameter and 5 cm high, AS ONE Corporation, Japan). In the first year, the soil samples were not dried before measurements were made; this protocol was therefore continued in subsequent years.

The vertical profile of 137Cs in high resolution in soil was examined to confirm the depth of the highest [137Cs], and the relationship between subdivision intervals and the shape of the distribution of [137Cs]. On 19 December 2016, 15-cm topsoil cores were collected from three locations at sites AO and MO by using the core sampler described in the previous section. The cores were wrapped and stored in a freezer (MDF-293AT; Sanyo, Japan) at −85°C. Each core sample was subdivided into 12 portions 0.5 to 3 cm thick by using a pruning saw. Each subsample was then immediately freeze-dried and placed in a U-8 vessel for measurement of [137Cs].
Texture and chemical properties of soils
After measurement of [137Cs], samples collected in 2013 were air-dried, passed through a 2-mm stainless-steel sieve and then assayed for soil texture (particle size distribution), cation exchange capacity (CEC), and total carbon content (TC). Soil texture in each 3-cm layer to a depth of 30 cm was determined by the sieving method (sand content) and by the pipette method (silt and clay contents). The particle size distributions of all the samples from every core were classified as coarse sand (2 to 0.2 mm), fine sand (0.2 to 0.02 mm), silt (0.02 to 0.002 mm), and clay (< 0.002 mm). Soil texture was classified in accordance with the International Society of Soil Science classification scheme (United States Department of Agriculture, 2014). TC in each 3-cm layer to a depth of 6 cm was determined by the dry combustion method using an NC (nitrogen–carbon) analyzer (Sumigraph NC-220F; Sumika Chemical Analysis Service, Osaka, Japan). CEC at depths of 0 to 3 and 3 to 6 cm was estimated by using the CH3COONH4 saturation method at pH 7.0.
Exchangeable 137Cs
The exchangeable 137Cs activity concentration [ex-137Cs] at depths of 0 to 3 and 3 to 6 cm in samples collected in 2013 was determined by using the following procedure. (i) Weigh out 5 g of air-dried soil and add 25 mL of 1 mol·L−1 CH3COONH4 solution. (ii) Shake for 30 min on a reciprocating shaker. (iii) Filter the supernatant into a 100-mL volumetric flask after centrifugation. (iv) Add 25 mL of 1 mol·L−1 CH3COONH4 solution to the residue and conduct the same procedure from (i) to (iii) 4 times. (v) Top up the volume of each extract to 100 mL by adding 1 mol·L−1 CH3COONH4 to the 100-mL volumetric flask. Place the aliquot of 70 to 80 mL of each extract into a U-8 container to determine [ex-137Cs] in the solution by using a germanium (Ge) semiconductor detector. [ex-137Cs] (Bq·kg−1DW) in each soil layer was calculated by using the following equations:
|
[
ex-Cs137
]
=
1.014
×
(
100
+
fw
)
fd
fm
C
/
100
(
Bq
·
kg−1
DW
)
| (1) |
|
fm
=
100
/
5
(
mL
·
g−1
)
| (2) |
where
fd represents the decay coefficient (1.05) corrected on the basis of the sampling date,
fm is the dilution ratio of the 5-g sample, 1.014 is the specific gravity of the solution extracted with 1 mol·L
−1 CH
3COONH
4, C is a measured activity concentration (Bq·kg
−1), and
fw is the moisture coefficient calculated from the water content. The soil water content was determined by oven-drying each air-dried sample at 105°C for 24 h or more.
Radiocesium measurements
[137Cs] in the 30-cm topsoil core samples was analyzed by using the Ge semiconductor detector systems at the RCEPS at Tohoku University in 2011 and 2012; at the Foundation for the Promotion of Material Science and Technology of Japan in 2013 and 2014; at the Graduate School of Agricultural and Life Sciences, The University of Tokyo, in 2015 and 2016; and at the Foundation for Promotion of Material Science and Technology of Japan in 2017. [ex-137Cs] was measured with a Ge semiconductor detector at the Graduate School of Symbolic Systems Science and Technology Fukushima University. The gamma-ray peak used in the measurements was 662 keV for 137Cs. The counting time for each sample ranged from 1 to 24 h, depending on the activity level. Activities were decay-corrected to the sampling date. The [137Cs] in soil was converted to a dry weight (DW) basis using the water content after oven-drying of the residue from each sample at 105°C for at least 24 h.
Data analysis
In 2015, the bulk densities of dry soil (hereafter, bulk density, g·cm−3) in each core sample were estimated to determine the ratio of the DW (g) of each layer to the volume (cm3) of a cylinder with a height of 3 cm and a diameter of 8.3 cm, representing one intercept of the core sample. The vertical distribution of the 137Cs inventory from 2011 to 2014 within the top 30 cm of soil was expressed for a distribution percentage (DP) which was calculated as a function of depth with the following equations:
|
DP
=
100
×
fi
wi
Ci
Tc−1
| (3) |
where the subscript
i represents the sample interval number,
fi is the soil density coefficient,
wi is a weighting coefficient based on the thickness of the soil interval,
hi is the thickness of each interval,
hmin is the thickness of the smallest interval, and
Ci is the [
137Cs] of the
ith soil interval. The value of
fi in the top 3 cm of soil was equated to the ratio of the bulk density in the top 3 cm of soil to the bulk density below 3 cm (
Table 2); the bulk density at depths of 3 to 30 cm was assumed to be 1.0 because no differences in this parameter were found within each of the five orchards at depths below 3 cm (data not shown). After 2015, DP was calculated by the measured value of bulk density instead of
fi.
The average 137Cs migration distance from 2011 to 2014 and that from 2015 to 2017 were calculated by altering the formula of Shiozawa (2013) as follows:
|
Md
=
Σ
si
fi
Ci
Δsi
(
Σ
fi
Ci
Δsi
)
−1
| (6) |
and
|
Md
=
Σ
si
qi
Ci
Δsi
(
Σ
qi
Ci
Δsi
)
−1
| (7) |
where the subscript
i represents the sample interval number, M
d is the average
137Cs migration distance,
fi is the soil density coefficient,
Ci is the measured [
137Cs] at depth
si,
Δsi is the measured depth interval, and
qi is the bulk density at
ith layer.
Vertical 137Cs profiles collected during the period from 2011 to 2017 were fitted to a one- or two-component negative exponential model by using KaleidaGraph 4.5J (HULINKS Inc., Tokyo, Japan), as follows:
|
C
=
K1
exp
(
−d
/
α1
)
+
K2
exp
(
−d
/
α2
)
| (8) |
where C is the measured [
137Cs] at depth
d,
Ki is the maximum of each component, and
αi is the relaxation depth (
Takahashi et al., 2015) of the
ith component. The relaxation depth is the depth at which
Ki has decreased to
e−1 of its value at the surface. The data used for fitting were equated to the average values in each orchard in every year.
Akaike’s information criterion (AIC: Akaike, 1973) was used to select the better component-negative exponential model of vertical 137Cs profiles. The AIC—the smaller the value, the better the fit—is a popular tool for comparing the adequacy of models.
The data from 2013 were used to conduct a factor analysis based on the normal varimax criterion to identify factors associated with the downward-migration of 137Cs. The data used in the factor analysis included measurements made at depths of both 0 to 3 and 3 to 6 cm in 2013. The value of Md was calculated from [137Cs] at a depth of 0 to 21 cm as an index of the downward-migration of 137Cs. Because the sampling interval at 21 to 30 cm was three times those at 0 to 3, 3 to 6, and 6 to 9 cm, the values measured at depths of 21 to 30 cm were excluded to avoid bias in the calculation of Md. Regression analysis was applied to the measured data that were found to be associated with Md on the basis of the factor analysis. STATISTICA 3.0J (StatSoft Japan, Tokyo, Japan) was used for the statistical analysis.
Results
Vertical distribution of 137Cs in soil
Table 2 shows the bulk densities and the fi of the top 3 cm of soil for each survey orchard. An analysis of variance (ANOVA) revealed no significant differences among the bulk densities of each depth interval below a depth of 3 cm within each of the five orchards (data not shown). The bulk density of the top 3 cm of soil was significantly lower than that at each depth interval below 3 cm (P = 2 × 10⁻⁵ by Tukey’s test) within each orchard. The bulk density of the top 3 cm of soil at KO (0.66 g·cm−3) was significantly lower than at MO (0.96 g·cm−3) and AO (1.03 g·cm−3) (P = 0.048 and 0.014, respectively, by Tukey’s test). The bulk density below 3 cm at AO (1.11 g·cm−3) was significantly lower than at the other orchards. The minimum and maximum fi coefficients were 0.47 (at KO) and 0.98 (at AO), respectively.
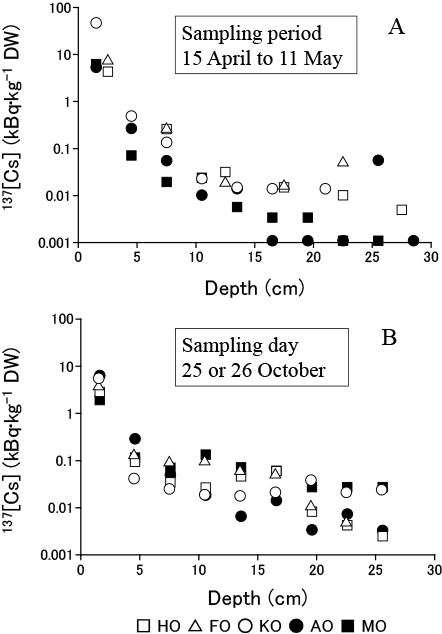
We plotted the vertical profiles of 137Cs in samples collected during both spring (15 April, 26 April, or 11 May) and autumn (25 or 26 October) in 2011 (Table 1; Fig. 1). [137Cs] values were up to an order of magnitude higher in the top 3 cm of soil than in the next-deeper layer during both collection periods. [137Cs] in the layers at 21 cm and deeper were variable (Fig. 1A, B). The DP of [137Cs] in the top 3 cm of soil in each orchard ranged from 90% at HO to 97% at MO in spring, and from 69% at MO to 94% at AO in autumn. Only at MO was the DP of 137Cs in the top 3 cm more than 20% lower in autumn than in spring. The 137Cs within the top 3 cm of soil clearly decreased three years after the accident and DP of [137Cs] in the top 3 cm of soil ranged from 41% at AO to 75% at MO in 2017 (Table 3). Because the measured values of [137Cs] in the top 3 cm of soil collected in 2011 on 15 April, 26 April, 11 May, or 25 or 26 October diverged considerably from the values in the layer below, the one- or two-component negative exponential model could not explain the vertical 137Cs profile in the soil.

We then examined the vertical profiles of 137Cs obtained by fitting to the one- or two-component negative exponential model during the period from 2012 to 2017 (Fig. 2; Table 4). The one-component negative exponential model gave smaller AICs than those with the two-component model in only two vertical profiles. The vertical profiles of 137Cs during the period from 2012 to 2017 consisted of two decreasing components, one of which described rapid downward-migration and the other slow downward-migration. The one-component model gradually diverged from the measured values at depths greater than 6 cm. We plotted the relaxation depths of the rapid and slow components (Fig. 3). The ranges of the relaxation depths of the rapid and slow components (α1 and α2) were approximately 1 to 4 cm and 4 to 10 cm, respectively. The rapid relaxation depths in the peach orchards tended to increase after 2015, whereas those of the apple orchards remained. There were no temporal trends in the slow relaxation depth among the orchards.

We plotted high-resolution vertical profiles of 137Cs at AO and MO in 2016 (Fig. 4). There was a change in the slope of the trend of decreasing 137Cs at a depth of approximately 3 cm. The maximum [137Cs] between 0 and 15 cm occurred at a depth interval of 0.5 to 1 cm in all samples, with the exception of one high value in the depth interval of 0 to 0.5 cm at AO. Another change of slope occurred at approximately 6 to 9 cm depth—a pattern similar to that in Figure 2. Below a depth of 9 cm at AO, [137Cs] was highly variable (i.e., dependent on the sampling location), in contrast to the pattern at MO.
Temporal changes in the downward-migration of 137Cs in soil
We then examined the temporal changes in Md (Fig. 5). Md increased slowly until 2013 (777 to 848 days after the FDNPP accident) but began to accelerate after 2013. There were no significant differences among the orchards until 2014 (1219 days), 3 years after the FDNPP accident. After 2014 (1218 days), the Md values of AO showed a higher trend compared with those of the other orchards. In 2015, (1585 to 1611 days) the Md of AO was significantly higher than those of the other orchards except that of HO (ANOVA, P = 0.017). In 2017, (2319 to 2374 days) the Md value at AO was 5.68 ± 1.11 cm (mean ± standard deviation, SD) and significantly higher than those of two apple orchards, which were 3.00 ± 1.60 cm (KO) and 2.64 ± 0.58 cm (MO). Although HO showed the next highest trend to AO after 2015, no significant differences to KO and MO were found except for 2016 because of the large deviation in the valued data within the same orchard. Finally, the average Md values from 2011 to 2017 at AO and HO were 3.83 ± 1.57 cm and 3.52 ± 0.93 cm, significantly higher than those of KO and MO, which were 2.70 ± 0.81 cm and 2.41 ± 0.57 cm by Tukey’s test at P ≤ 0.05.

Table 5 lists the soil textures at depths of 0 to 3 and 3 to 6 cm in the five orchards in 2013. The proportions of sand and clay varied among the five orchards from FO-type heavy clay (HC) to MO-type sandy loam (SL). The MO soil consisted of 56.8% to 66.6% coarse sand, but only 5.7% to 7.7% clay, whereas the FO soil consisted of 37.9% to 47.7% clay and 6.3% to 13.1% coarse sand. In contrast, fine sand was relatively abundant at HO, where it accounted for up to 43.2% of the soil. In 2013, we determined the values of [137Cs], [ex-137Cs], chemical properties, and soil texture in the top 0 to 3 and 3 to 6 cm of soil, and of Md in the top 21 cm (Table 6). These data were selected for factor analysis. Md was the variable used to quantify the vertical migration of 137Cs in the soil. Table 7 shows the factor loadings that resulted from the factor analysis. Factor analysis was performed with 13 variables. Because the changes in the eigenvalues were 4.88, 3.70, 2.00, and 1.18, a three-factor structure was considered reasonable. The cumulative percentage of the variance accounted for by these three factors exceeded 80%. The first factor consisted of five variables: Md, the ratio of TC at 3 to 6 cm depth to TC in the top 3 cm of soil (TC ratio), the CEC ratio, the fine sand content in the top 3 cm of soil, and [137Cs] in the top 3 cm of soil. The second factor consisted of four variables: the clay content of the top 3 cm of soil, the coarse sand content of the top 3 cm of soil, the CEC in the top 3 cm of soil, and [ex-137Cs] in the top 3 cm of soil. The third factor consisted of four variables: [137Cs] at a depth of 3 to 6 cm, [ex-137Cs] at a depth of 3 to 6 cm, TC in the top 3 cm of soil, and TC at a depth of 3 to 6 cm. The first factor indicated that there was a close relationship between Md and the TC ratio, or between Md and the CEC ratio, or between Md and the fine sand content in the top 3 cm of soil. In fact, there was a significant positive correlation between Md and the TC ratio and between Md and the fine sand content of the top 3 cm of soil (Fig. 6). Furthermore, there was a significant positive correlation between the percentage of [ex-137Cs] to [137Cs] at 3 to 6 cm depth and the TC ratio (Fig. 7).

Discussion
Temporal changes in vertical 137Cs migration in orchard soil
More than 84% of the total 137Cs down to a depth of 30 cm was localized in the top 3 cm of soil, much greater than the proportion of 137Cs in the next layer, at least 7 months after the FDNPP accident. The greater decrease at MO by autumn 2011 compared with spring was probably due to the fact that the core was collected at a location disturbed by field management, judging by the temporal trend in 137Cs distribution at MO during the following sampling year (Fig. 2). Koarashi et al. (2012a) mentioned an exponential decline in the values measured in cores collected at 15 locations in southwestern Fukushima city, approximately 70 km northwest of the FDNPP, from 18 to 20 June 2011. They measured [137Cs] in the top 5 cm of soil by subdividing the core at intervals of 1 to 2 cm. Since the vertical 137Cs profile in two orchards in their study were explained by one-negative exponential models, the nonconformity in fitting the negative exponential model in our study may have been due to the choice of subdivision intervals for measurement of [137Cs]. From another viewpoint, this result indicated that 137Cs downward-migration below 3 cm was negligible until 7 months after the fallout from the FDNPP accident.
Takahashi et al. (2015) investigated the vertical 137Cs profiles at eight survey sites in the Yamakiya area of Fukushima Prefecture in 2011 and 2012 by fitting a one-component negative exponential function. However, a logarithmic plot of the vertical distribution of [137Cs] in the top 0 to 10 cm of soil at almost all locations revealed a change in the trend at about 3 cm depth. If the vertical profile of 137Cs were to fit a negative exponential function, the logarithmic graph of the [137Cs] plot would be linear. However, the graphs of vertical profiles of 137Cs in the soil at the study sites of Takahashi et al. (2015) were not strictly linear. In particular, the vertical 137Cs profile in forests showed the two trends turned at a depth of 3 to 6 cm in a clearly similar pattern to the high-resolution vertical profiles of 137Cs in our study (Fig. 4). These results differed from the findings of Koarashi et al. (2012a), which explained the vertical 137Cs distribution in forest soil by a one-component negative exponential function. Although no studies have applied a two-component negative exponential model to the investigation of forests, it was considered reasonable to describe the vertical 137Cs distribution in orchard soil by using a two-component negative exponential model, at least for a long-term investigation. In our study, the trend in the rapid relaxation depth from 2012 to 2017 largely agreed with that of Md (Figs. 3 and 5), implying that the rapid component directly controlled the speed of downward-migration. Figure 3 suggests that the slow component probably reflected the downward-migration of 137Cs below 6 to 9 cm, where the upper rhizosphere of a fruit tree is found (data not shown). In other words, the slow component was indicative of the amount of 137Cs potentially transferred to the fruit tree via the roots. In 2017, the initial [137Cs] of the slow component was estimated at 0.2 to 0.9 kBq·kg−1 DW (Table 4). Furthermore, the relaxation depth of the rapid component in AO and HO accelerated after 2014, and that in HO was more than 4 cm in 2016. The speed of the increase in the relaxation depth of the rapid component at HO (0.76 cm·y−1) was more than 3 times higher than that at MO (0.22 cm·y−1). From a long-term viewpoint, there is no doubt that a further survey of the rapid component is needed. Because the transfer factor to fruit (Bq·kg−1 fresh weight) from soil (Bq·kg−1 DW) is in the range of 10−4 to 10−2 (Carini, 2001), continued monitoring of 137Cs in the fruits of shallow-rooted fruit and nut trees may be necessary for a while, at least in areas more heavily contaminated with 137Cs than in our study area.
In our study, it took 4 years after the FDNPP accident to show a significant difference in the Md values between AO and other orchards. No studies have examined the temporal changes in the Md after fallout, so it is difficult to explain the reason for the above time-dependence. Considering the physicochemical characteristics of AO and HO, which showed higher Md values, the precipitation as a factor to control seepage and the soil temperature as a factor to increase the dissolved carbon (Tegen et al., 1991) are related. On the other hand, to assess the effectiveness of long-term measures against 137Cs deposition in orchard soils it is important to evaluate the speed of 137Cs migration. Arapis et al. (1997) used a quasi-diffusion model and the migration center of the vertical distribution of radionuclides to evaluate the speed of 137Cs migration in three regions of Greece (Antonopoulos-Domis et al., 1991) 7 years after the Chernobyl accident. Their results indicated a speed of 0.71 to 1.54 cm·year−1 for the rate of 137Cs migration. Rosén et al. (1999) showed that migration rates from 1987–1995 in Sweden were 0.5 to 1.0 cm·year−1 for the first year; thereafter, they were 0.2 to 0.6 cm·year−1 (based on median depths). We found here, on the basis of Md, that the speed of 137Cs migration in orchards in the 6 years after the FDNPP accident was 0.44 to 0.97 cm·year−1; this speed is consistent with the range of 8.2 to 17.4 cm for the mean migration depth of 137Cs in organic soil in Scotland 22 years after the Chernobyl accident (Shand et al., 2013). Each migration center, median depth and the mean migration depth was calculated as the centroid, which represents the center of the amount or activity concentration of 137Cs using the same algorithm as Md.
Factors affecting vertical migration of 137Cs in orchard soils
Investigations at FTRC in 2014 revealed that the root weight in the top 3 cm of soil accounted for up to 73.8% of the total root weight at a depth of 0 to 15 cm (Sato et al., 2019). Dominance of grass roots was likely the reason why we found here that the bulk density at all sites was lower at 0 to 3 cm than at 3 to 30 cm. Fukushima Prefectural Government recommends the use of sod culture, a soil management method intended to enrich the nutritional status of orchard soil through the cultivation of herbaceous plants or grasses (Sato et al., 1978). In sod culture, the swards are mown every time they grow to more than approximately 20 cm high. It is commonly known that an aggregate structure, which is characterized by abundant pores and much organic C, develops in the topsoil of grassland soil (Kobayashi and Yamane, 1976). In fact, Matsunaga et al. (2013) verified that the organic carbon contained in the top 3 cm of soil in an orchard was more than twice the level found in herbaceous farmland. Sod culture retains this characteristic aggregate structure of orchard topsoil. KB is well known to develop a good root mat (Sugiura et al., 1988). WC does not develop a root mat, but it spreads large numbers of stolons (runners) from which fibrous roots are generated (Devkota et al., 1997). Weeds are generally inferior to KB and WC in terms of root development. During the 2014 investigations at FTRC (Sato et al., 2019), the weight of the roots in the top 3 cm of soil at KO, which was well covered with KB and WC, was 0.40 kg·m−2, whereas in the peach orchard near AO, which was invaded by weeds, the corresponding weight was 0.21 kg·m−2, indicating that the differences between the orchards in terms of bulk density in the top 3 cm of soil were associated with the presence of invading weeds. On the other hand, the 137Cs amount in the roots in the top 3 cm of soil was 0.46 kBq·m−2 at KO and 0.37 kBq·m−2 in the peach orchard near AO, whereas the 137Cs amount in the same layer of soil was 339 kBq·m−2 and 151 kBq·m−2. These findings indicate that the 137Cs amount in the roots of grass is relatively small, so the influence of 137Cs absorption by grass on 137Cs kinetics in soil is likely small. Takahashi et al. (2015) showed that survey sites with high pore volume have relatively low bulk density. There was likely a large pore volume at AO, which had the lowest bulk density below 3 cm (Table 2). The difference in the bulk density due to the method of sod culture likely affects the activity of soil microorganisms in soil and the infiltration of precipitation, resulting in differences in the supply of organic carbon and the percolation of seepage water.
Our regression of Md against fine sand content was significant in the top 3 cm of soil. Downward-migration of 137Cs into the soil may be due to the infiltration and percolation of precipitation (Shiozawa, 2013). Sato et al. (2019) found that more 137Cs migrates below 3 cm in open spaces, where rainfall hits the ground directly, than at locations below the canopy. Tegen et al. (1991) confirmed that dissolved 137Cs is transported by seepage water through the soil. The permeability coefficient of water is larger in fine sand than in coarse sand in the unsaturated state (Kaihotsu, 1979, 1984). It is likely that the surface soil layer is maintained in an unsaturated state because the topsoil lies directly below the air and develops an aggregate structure due to sod culture. The third factor in the factor analysis provided interesting information about the downward-migration of 137Cs, the implication being that ex-137Cs migrated with TC. It is thus clear that organic matter plays an important role in the downward-migration of 137Cs, at least in soil with abundant organic matter. Shand et al. (2013) concluded that “Clay alone did not have a prime role in controlling the migration of 137Cs down the profile”, because in their investigation of organic soils in Scotland, they could not find a relationship between the type of clay minerals and the profile of downward-migration of 137Cs. Moreover, they quoted the results of Schimmack et al. (1997) in Bavarian grassland, where there was “no correlation between the content of clay mineral in the soils ranging (between 11 and 41%)” and the profile of downward-migration of 137Cs. Niesiobędzka (2000) revealed that of mobile forms represented as the total 137Cs extracted by distilled water, NH4COOH and HCl were positively correlated with organic carbon and organic matter in the top 10 cm of sandy soil. On the other hand, Koarashi et al. (2012a) found a significant correlation between 137Cs retention and the ratio of organic C to clay in the top 3 cm of soil at 15 locations. According to Figure 7, one of the mobile forms of 137Cs is the ex-137Cs combined with TC. Tegen et al. (1991) found that the 137Cs in seepage water is bound to the dissolved organic carbon of which the supply in the surface depends on soil microorganisms. The significant positive correlation between the percentage of [ex-137Cs] to [137Cs] at 3 to 6 cm depth and the TC ratio (Fig. 7) found in the present study is supported the finding by Tegen et al. (1991). Since the activity of soil microorganisms depends on the soil temperature (Tegen et al., 1991), continuous supply of organic matter by the sod culture and the vertical trend of soil temperature are the reasons why the vertical 137Cs profile in orchard soil separates the two components. In our study, the highest [ex-137Cs] and TC content in the top 6 cm of soil occurred at AO (Table 6). Interestingly, AO had the lowest bulk density below 3-cm depth (Table 2), indicating that there was likely abundant pore space below 3-cm depth. On the other hand, the bulk density below 3-cm depth at KO and MO, where the mean value of Md over 6 years was significantly lower, was significantly higher than that of others so one reason for the difference of Md in orchards is probably the bulk density. Moreover, retention factors, e.g. undecomposed organic matter and mica, rather than migration factors, may also be involved. Koarashi et al. (2012a) revealed that there was a significant positive correlation between the 137Cs retention and the bulk density in the top 1 to 3 cm of soil, but few studies have examined on the relationship between pores and the 137Cs downward-migration into soil. Further studies are needed to determine the factors controlling 137Cs downward-migration into soil in orchards.
We conclude based on the first time evidence in orchards as follows: (i) the vertical 137Cs profile in orchard soil consisted of two components related to the content of TC, which likely consists mainly of organic carbon, in the top 3 cm of soil supplied by sod culture; (ii) 137Cs downward-migration into soil depended on the factors of the infiltration and percolation of seepage, e.g. fine sand content and pore space; (iii) exchangeable 137Cs combining with TC as a carrier was one of the migration processes in orchards.
Literature Cited
- Akaike, H. 1973. Information theory and an extension of the maximum likelihood principle. p. 267–281. In: B. N. Petrov and F. Caski (eds.). Proceedings of the 2nd International Symposium on Information Theory. Akadimiai Kiado, Budapest.
- Antonopoulos-Domis, M., A. Clouvas and A. Gagianas. 1991. Radiocesium dynamics in fruit trees following the Chernobyl accident. Health Phys. 61: 837–842.
- Arapis, G. D., E. Petrayev, E. Shagalova, O. Zhukova, G. Sokolik and T. Ivanova. 1997. Effective migration velocity of 137Cs and 90Sr as a function of the type of soils in Belarus. J. Environ. Radioact. 34: 171–185.
- Carini, F. 2001. Radionuclide transfer from soil to fruit. J. Environ. Radioact. 52: 237–279.
- Carini, F. and E. Lombi. 1997. Foliar and soil uptake of 134Cs and 85Sr by grape vines. Sci. Total Environ. 207: 157–164.
- Chino, M., H. Nakayama, H. Nagai, H. Terada, G. Katata and H. Yamazawa. 2011. Preliminary estimation of release amounts of 131I and 137Cs accidentally discharged from the Fukushima Daiichi Nuclear Power Plant into the atmosphere. J. Nucl. Sci. Technol. 48: 1129–1134.
- Cremers, A., A. Elsen, P. De Preter and A. Maes. 1988. Quantitative analysis of radiocaesium retention in soils. Nature 335: 247–249.
- Devkota, R. N., P. D. Kemp and J. Hodgson. 1997. Screening pasture species for shade tolerance. Proceed. Agrono. Soc. N. Z. 27: 119–128.
- Forsberg, S. and M. Strandmark. 2001. Migration and chemical availability of 137Cs and 90Sr in Swedish long-term experimental pastures. Water Air Soil Poll. 127: 157–171.
- Fujii, K., S. Ikeda, A. Akama, K. Komatsu, M. Takahashi and S. Kaneko. 2014. Vertical migration of radiocesium and clay mineral composition in five forest soils contaminated by the Fukushima nuclear accident. Soil Sci. Plant Nutri. 60: 751–764.
- Imanaka, T. 2012. Chernobyl accident and Fukushima Daiichi NPP accident. p. 17–24 (In Japanese with English abstract). In: K. Bessho, K. Tagami, K. Takamiya and T. Miura (eds.). Proceedings of the 13th workshop on environmental radioactivity. High Energy Accelerator Research Organization, Tsukuba.
- International Atomic Energy Agency. 2010. Handbook of parameter values for the prediction of radionuclide transfer in terrestrial and freshwater environments. Technical reports series No. 472: 25–39.
- International Atomic Energy Agency. 2015. The Fukushima Daiichi Accident. Technical vol. 1: 34–158.
- Kaihotsu, I. 1979. Vertical water movement in unsaturated sand during and after a steady rain. J. Ground. Hydro. 21: 111–126 (In Japanese).
- Kaihotsu, I. 1984. Soil water retentivity and permeability of unsaturated sand. J. Ground. Hydro. 26: 111–120 (In Japanese).
- Kato, H., Y. Onda and M. Teramage. 2012. Depth distribution of 137Cs and 131I in soil profile after Fukushima Dai-ichi Nuclear Power Plant Accident. J. Environ. Radioact. 111: 59–64.
- Khomutinin, Y. V., V. A. Kashparov and K. I. Zhebrovska. 2004. Statistical performances of soil, vegetation and agricultural products contamination with radionuclides. p. 19–50. In: Sampling optimization when radioecological monitoring. UIAR, Kyiv.
- Koarashi, J., M. Atarashi-Andoh, T. Matsunaga, T. Sato, S. Nagao and H. Nagai. 2012a. Factors affecting vertical distribution of Fukushima accident-derived radiocesium in soil under different land-use conditions. Sci. Total Environ. 431: 392–401.
- Koarashi, J., K. Moriya, M. Atarashi-Andoh, T. Matsunaga, H. Fujita and M. Nagaoka. 2012b. Retention of potentially mobile radiocesium in forest surface soils affected by the Fukushima nuclear accident. Sci. Rep. 2: 1005. DOI: 10.1038/srep01005. <https://www.nature.com/>.
- Kobayashi, H. and I. Yamane. 1976. Water-stable aggregate formation and its polysaccharides in grassland soil. J. Japan. Grassl. Sci. 22: 196–200 (In Japanese with English abstract).
- Kusaba, S., K. Matsuoka, K. Abe, H. Ajito, M. Abe, N. Kihou and K. Hitaoka. 2015. Changes in radiocesium concentration in a blueberry (Vaccinium virgatum Aiton) orchard resulting from radioactive fallout. Soil Sci. Plant Nutri. 61: 165–168.
- Mamikhin, S. V. 1995. Mathematical model of 137Cs vertical migration in a forest soil. J. Environ. Radioact. 28: 161–170.
- Matsunaga, T., J. Koarashi, M. Atarashi-Andoh, S. Nagao, T. Sato and H. Nagai. 2013. Comparison of the vertical distributions of Fukushima nuclear accident radiocesium in soil before and after the first rainy season, with physiochemical and mineralogical interpretations. Sci. Total Environ. 447: 301–314.
- Ministry of Agriculture, Forestry and Fisheries. 2017. The 88th statistical yearbook of ministry of agriculture, forestry and fisheries (2012–2013): <http://www.maff.go.jp/e/tokei/kikaku/nenji_e/88nenji/index.html#nse003>.
- Ministry of Education, Culture, Sports, Science and Technology. 2011. Extension site of distribution map of radiation dose, etc. <http://ramap.jmc.or.jp/map/eng/>.
- Nakanishi, T., T. Matsunaga, J. Koarashi and M. Atarashi-Andoh. 2014. 137Cs vertical migration in a deciduous forest soil following the Fukushima Dai-ichi Nuclear Power Plant accident. J. Environ. Radioact. 128: 9–14.
- Niesiobędzka, K. 2000. Mobile forms of radionuclide 137Cs in sandy soil in northeastern Poland. Pol. J. Environ. Stu. 9: 133–136.
- Obara, H., T. Ohkura, Y. Takata, K. Kohyama, Y. Maejima and T. Hamazaki. 2011. Comprehensive soil classification system of Japan First Approximation. Bull. NIAES. 29: 1–73 (In Japanese with English abstract).
- Ogura, S., T. Suzuki and M. Saito. 2014. Distribution of radioactive cesium in soil and its uptake by herbaceous plants in temperate pastures with different management after the Fukushima Dai-Ichi Nuclear Power Station accident. Soil Sci. Plant Nutri. 60: 790–800.
- Ohno, T., Y. Muramatsu, Y. Miura, K. Oda, N. Inagawa, H. Ogawa, A. Yamazaki, C. Toyama and M. Sato. 2012. Depth profiles of radioactive cesium and iodine released from the Fukushima Daiichi nuclear power plant in different agricultural fields and forests. Geochemical J. 46: 287–295.
- Rosén, K., I. Öborn and H. Lönsjö. 1999. Migration of radiocaesium in Swedish soil profiles after the Chernobyl accident, 1987–1995. J. Environ. Radioact. 46: 45–66.
- Sato, I., I. Sasaki, T. Suzuki and K. Komatsu. 1978. Studies on the application of nitrogen fertilizer in the apple orchard. (1) Behaviors of nitrogen in the sod apple orchard. Bull. Fukushima Hort. Exp. St. 8: 1–16 (In Japanese with English abstract).
- Sato, M. 2014. Investigation of the radiocaesium migration pathway into the deciduous fruit tree contaminated at the dormant period and trials to decrease the radiocaesium uptake via bark. Jpn. J. Soil Sci. Plant Nutri. 85: 103–106 (In Japanese).
- Sato, M., H. Akai, Y. Saito, T. Takase, H. Kikunagad, N. Sekiya, T. Ohtsuki and K. Yamaguchi. 2019. Use of different surface covering materials to enhance removal of radiocaesium in plants and upper soil from orchards in Fukushima prefecture. J. Environ. Radioact. 196: 204–211.
- Schimmack, W., K. Bunzl, F. Dietl and D. Klotz. 1994. Infiltration of radionuclides with low mobility (137Cs and 60Co) into a forest soil. Effect of the irrigation intensity. J. Environ. Radioact. 24: 53–63.
- Schimmack, W., K. Bunzl and L. Zelles. 1989. Initial rates of migration of radionuclides from the Chernobyl fallout in undisturbed soils. Geoderma. 44: 211–218.
- Schimmack, W., H. Fressa and K. Bunzl. 1997. Vertical deposition of Chernobyl-derived radiocesium in Bavarian grassland soils. Naturwissenschaften. 84: 204–207.
- Shand, C. A., K. Rosén, K. Thored, R. Wendler and S. Hillier. 2013. Downward migration of radiocaesium in organic soils across a transect in Scotland. J. Environ. Radioact. 115: 124–133.
- Shiozawa, S. 2013. Vertical migration of radiocesium fallout in soil in Fukushima. p. 49–60. In: T. M. Nakanishi and K. Tanoi (eds.). Agricultural implications of the Fukushima Nuclear Accident. Springer Japan, Tokyo.
- Shiraishi, Y. 1973. Studies on the radioactive contamination of fruit trees by fission products (V) 137Cs distribution in fruit of the satsuma orange trees grown at an orchard. Health Physics 8: 209–215 (In Japanese).
- Shiraishi, Y. and H. Okabayashi. 1967. Studies on the radioactive contamination of fruit trees by fission products (I) 137Cs distribution in orchard soil (1965). Jpn. J. Soil Sci. Plant Nutri. 38: 333–338 (In Japanese).
- Strebl, F., M. H. Gerzabek, V. Karg and V. Tataruch. 1996. 137Cs-mirigration in soil and its transfer to roe deer in an Austrian forest stand. Sci. Total Environ. 181: 237–247.
- Sugiura, T., H. Kobayashi, R. Sakai and S. Suzuki. 1988. Factors affecting root mat formation in permanent grassland (1) J. Jpn. Grass. Sci. 34: 178–185.
- Takahashi, J., K. Tamura, T. Suda, R. Matsumura and Y. Onda. 2015. Vertical distribution and temporal changes of 137Cs in soil profiles under various land uses after the Fukushima Dai-ichi Nuclear Power Plant Accident. J. Environ. Radioact. 139: 351–361.
- Tanaka, K., Y. Takahashi, A. Sakaguchi, M. Umeno, S. Hayakawa, H. Tanida, T. Saito and Y. Kanai. 2012. Vertical profile of Iodine-131 and Cesium-137 in soils in Fukushima Prefecture related to the Fukushima Daiichi Nuclear Power Station Accident. Geochemical J. 46: 73–76.
- Tegen, I., H. Dörr and K. O. Münnich. 1991. Laboratory experiments to investigate the influence of microbial activity on the migration of cesium in a forest soil. Water Air Soil Poll. 57–58: 441–447.
- Teramage, T. M., Y. Onda, J. Patin, H. Kato and T. Gomi. 2014. Vertical distribution of radiocesium in coniferous forest soil after the Fukushima nuclear power plant accident. J. Environ. Radioact. 137: 37–45.
- Tsukada, H., A. Takeda, S. Hisamatsu and J. Inaba. 2008. Concentration and specific activity of fallout 137Cs in extracted and particle-size fractions of cultivated soils. J. Environ. Radioact. 99: 875–881.
- United States Department of Agriculture. 2014. Keys to Soil Taxonomy 24th Edition. <http://www.nrcs.usda.gov/wps/portal/nrcs/detail/soils/survey/class/taxonomy/>.
- Unno, Y., H. Tsukada, A. Takeda, Y. Takaku and S. Hisamatsu. 2017. Soil-solution distribution coefficient of soil organic matter is a key factor for that of radioiodide in surface and subsurface soils. J. Environ. Radioact. 169–170: 131–136.
- Velasco, R. H., J. P. Toso, M. Belli and U. Sansone. 1997. Radiocesium in the northeastern part of Italy after the Chernobyl accident: vertical soil transport and soil-to-plant transfer. J. Environ. Radioact. 37: 73–83.
- Zygmunt, J., S. Chibowski and Z. Klimowicz. 1998. The effect of sorption properties of soil minerals on the vertical migration rate of cesium in soil. J. Radioana. Nuc. Chem. 231: 57–62.


