Abstract
Water is an essential resource for food production, and agriculture consumes close to 69% of total freshwater use. Water shortage is becoming critical in arid and semiarid areas worldwide; therefore, it is vital to use water efficiently. The objective of this research was to evaluate the response of onion growth, plant water status, bulb yield, irrigation water use efficiency and bulb quality using three continued deficit strategies, applying 100, 75, and 50% of the irrigation water requirements during three seasons. The yield response factor was 0.71, indicating that in the analysed conditions the crop was tolerant to a water deficit. Compared to full irrigation, deficit irrigation with 75% of the irrigation water requirements resulted in a low yield and profit reduction for the growers (10.3% and 10.9%, respectively), but also important water savings (26.6%), improving both the irrigation water use efficiency and water use efficiency. However, onion exposure to severe water deficits at 50% of the irrigation water requirements drastically reduced plant growth and bulb yield and growers’ profits, although it did increase their soluble solid content. Irrigating at 75% of the irrigation water requirements could be an actionable strategy for onion production under water-limited conditions.
Introduction
Onions (Allium cepa L.) are an important vegetable crop around the world, ranking second behind tomatoes. Worldwide onion production in 2016 was approximately 93.2 million tonnes produced from 4.95 million ha. The major producing countries in 2016 were China, India, and the United States of America (Faostat, 2018).
Globally, water is at the core of sustainable development and considered an essential resource for food production (Howell, 2001). Agriculture uses large amounts of water; approximately 69% of the total consumption of freshwater around the world and in the Mediterranean region (Aquastat, 2018). The area of irrigated agriculture increased worldwide from 196 million ha in 1973 to 325 million ha in 2013, naturally leading to an increase in water requirements and in pressure on freshwater resources (Aquastat, 2018). Climate change will affect the agriculture sector as it will increase global temperatures. This will lead to potential evapotranspiration, reduced precipitation and alterations in precipitation distribution and patterns (Turral et al., 2011; Kang et al., 2017). Increasing water scarcity and irrigation costs have heightened interest in improving the productivity of water use in agriculture (Bessembinder et al., 2005; Fereres and Soriano, 2007) by using efficient irrigation management approaches and appropriate strategies that increase water productivity (Molden et al., 2010; Malek and Verburg, 2017). Irrigation water use efficiency (IWUE) and water use efficiency (WUE) are common indicators used to assess the efficiency of irrigation water use in crop production (Tolk and Howell, 2003; Pascual-Seva et al., 2016). Currently, the main aim is to increase crop production by maximizing IWUE and increasing crop production per unit of water applied. Within this context, the use of the deficit irrigation technique applies less irrigation than the optimum crop water requirements in order to improve water use efficiency (Pereira et al., 2002; Costa et al., 2007; Geerts and Raes, 2009; Galindo et al., 2018). The real challenge is to establish deficit irrigation while maintaining or even increasing crop production and saving irrigation water, thereby increasing the IWUE (Chai et al., 2016). For this reason, deficit irrigation requires accurate knowledge of the crop yield response to the water applied (Fereres and Soriano, 2007). Currently, deficit irrigation is a common practice throughout the world, especially in dry regions, where it is just as important to maximize crop water productivity as increase the harvest per unit of land (Kirda, 2002). The effects of deficit irrigation on yield and harvest quality are crop-specific; therefore, knowledge about how different crops respond to water deficits is essential for the optimal application of deficit irrigation (Costa et al., 2007). Furthermore, the extent of the water deficit is important not only for efficient water use and maximizing yield (Yang et al., 2017), but also for increasing farmers’ profits (Fereres and Soriano, 2007). Doorenbos and Kassam (1979) introduced a linear crop-water production function to describe the reduction in yield when a crop is under stress due to a shortage of soil water. The yield response factor (Ky) is a factor that describes the reduction in relative yield according to the reduction in crop evapotranspiration (ETc). Determining farmers’ potential profits would help growers and technicians in decision-making regarding irrigation management.
Monitoring soil moisture by sensors is a technique that can contribute to crop irrigation scheduling, ensuring an adequate water status for the crop and limiting drainage, which in turn maximizes the water use efficiency in irrigation agriculture (Blanco et al., 2018; Gallardo and Thompson, 2018). Moreover, soil moisture monitoring can minimize the risk of yield reduction when using deficit irrigation strategies that are very restrictive in terms of using water (Fereres and Soriano, 2007).
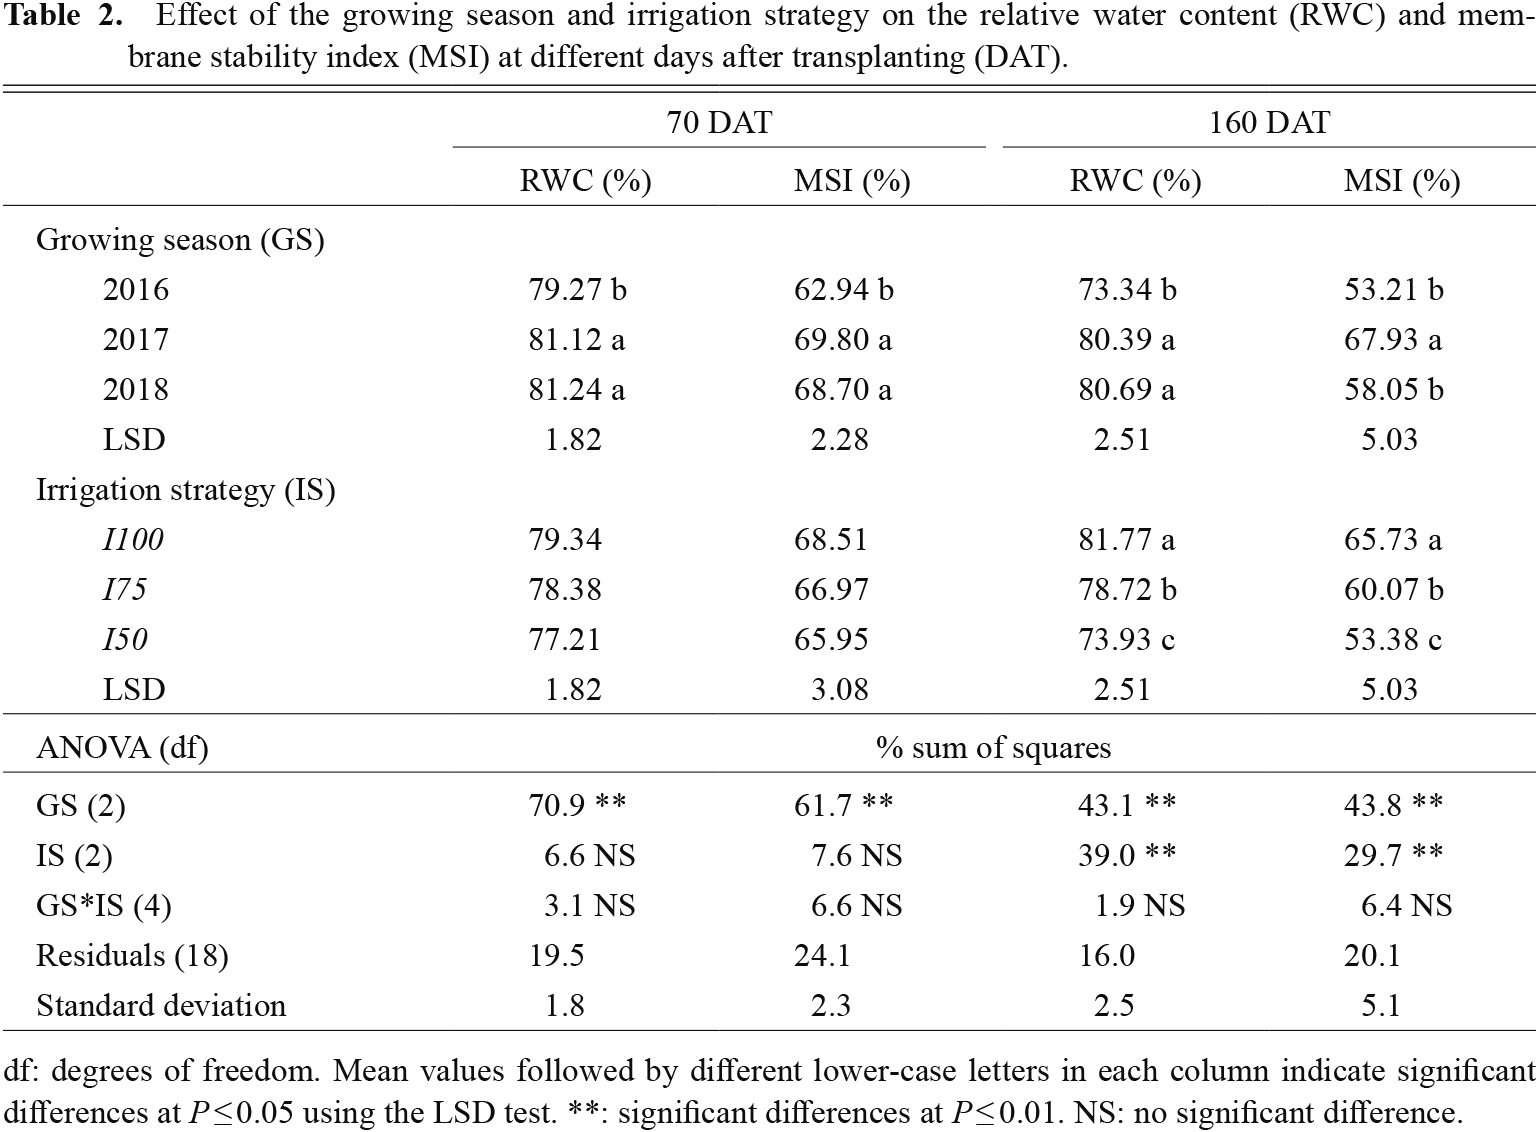
The relative water content and membrane stability index are indicators of plant water status (Semida et al., 2017); the relative water content refers to the plant water content, and it has been used as a meaningful index of dehydration tolerance, while the membrane stability index indicates the integrity of cell membranes. It has also been widely used as an indicator of leaf desiccation tolerance (Abdelkhalik et al., 2019).
Onion roots are fasciculate, slightly ramified, short, and generally do not exceed a depth of 0.20–0.25 m in soil (Miguel, 2017). Due to this shallow root system, onions are very sensitive to water stress. Therefore, frequent and adequate irrigation management is required to achieve a good yield (Zheng et al., 2013; Temesgen et al., 2018). These characteristics have led to studies in different conditions, such as those carried out in a spring-summer cycle in a temperate Mediterranean climate (in Albacete, Spain, by Martín de Santa Olalla et al., 2004), in an arid climate (in Gansu, Norwest China, by Zheng et al., 2013), in an autumn-winter cycle in a humid subtropical climate (Uvalde, Texas, by Leskovar et al., 2012) and in an arid climate (in Fayoum, Egypt, by Semida et al., 2017). Results of these studies showed differences in the yield and bulb characteristics when using different deficit irrigation strategies, and the irrigation strategy can also affect the bulb quality. Onions have significant nutritional and medicinal properties, and are an important source of polyphenolic flavonoids (Leskovar et al., 2012). The effect of deficit irrigation on onion phenolic content is still largely unknown (Leskovar et al., 2012). Specialized literature usually addresses different parameters separately, while the present study aims to analyse together the different parameters that reflect the onion response to deficit irrigation. The crop response to deficit irrigation varies with location, stress pattern, cultivar, planting date, and other factors (Fereres and Soriano, 2007); therefore, this response must be determined for the particular conditions in each cultivation area, in this case, the Mediterranean area. The objective of this research was to evaluate the vegetative and productive responses of onion plants, including plant water status, bulb quality and Ky, IWUE and farmers’ profit, using two deficit irrigation strategies in an autumn-winter cycle under Mediterranean conditions.
Materials and Methods
Experimental site and the deficit irrigation strategies
The experiments were conducted during three growing seasons in 2016, 2017, and 2018 at the Cajamar Experimental Centre in Paiporta, Valencia, Spain (39.4175 N, 0.4184 W). To avoid soil replanting disorders resulting from serial onion cropping, two subplots within the experimental plot were used: plot 1 in 2016 and 2018, and plot 2 in 2017. The soils were deep, with a medium (silt loam) texture and classified as Petrocalcic Calcixerepts according to the USDA Soil Taxonomy (Soil Survey Staff, 2014). Soil analyses indicated that the soils of the two subplots were similar, being very slightly alkaline (pH = 7.4–7.5) and highly fertile [organic matter = 1.9–2.1% with high available phosphorous (43–45 mg·kg−1; Olsen) and potassium (340–371 mg·kg−1; ammonium acetate extract) concentrations].
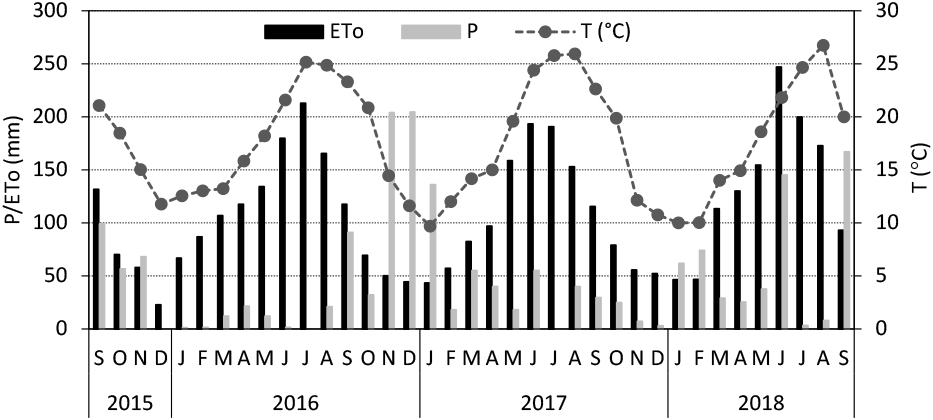
Irrigation water was pumped from a well, with (on average) electrical conductivity of 2.16 dS·m−1 and 77 mg·kg−1 N-NO3− content. According to Papadakis’s agro-climatic classification (Verheye, 2009), the climate is subtropical Mediterranean (Su, Me), with hot dry summers and an average annual rainfall of approximately 450 mm, irregularly distributed throughout the year, falling mostly during the autumn and/or the end of winter/beginning of spring. Figure 1 shows the most significant climatological data in the growing seasons.
The period from transplanting until establishment was considered as the initial period, and all the plants were irrigated without restrictions. Then, different irrigation strategies were initiated. This study comprised three irrigation strategies corresponding to 100% (I100), 75% (I75), and 50% (I50) of the irrigation water requirement (mm) during three growing seasons in 2016, 2017, and 2018.
Irrigation scheduling
The irrigation water requirements were determined using the following equation:
where ETc is the crop evapotranspiration (mm), Pe is the effective precipitation (mm) determined from rainfall data using the method of the U.S. Bureau of Reclamation (
Stamm, 1967) as presented by
Pascual-Seva et al. (2016), and Ef is the irrigation efficiency (including percolation and uniformity), which was considered to be 0.95 (as stated for onion cultivars grown in the Experimental Centre). The ETc was calculated from the reference evapotranspiration (ETo; mm) and a single crop coefficient proposed for local conditions by the Instituto Valenciano de Investigaciones Agrarias (
IVIA, 2011), adapting the duration of each stage to the growing cycle. The crop coefficient values were 0.3, 0.95, and 0.8, corresponding to initial, mid-season, and late season stages, respectively.
ETo was determined according to
Allen et al. (1998) as follows:
where E
pan (mm) is the evaporation from a class A pan installed adjacent the experimental plot in the Experimental Centre, and K
p (0.815) is the pan coefficient determined according to
Allen et al. (1998).
The irrigation water was supplied by a drip irrigation system, with two turbulent flow surface driplines of 16 mm per bed, with emitters spaced 0.33 m apart, and a discharge rate of 2.2 L·h−1. The amount of irrigation water applied (IWA) for each irrigation event was recorded using total water flow meters connected to the irrigation system.
The volumetric soil water content (m3·m−3) was continuously monitored using ECH2O EC-5 capacitance sensors connected to an Em50 data logger, using the ECH2O Utility software (Decagon Devices Inc., Pullman, WA, USA). Given that most roots were concentrated in the top 0.20 m of the soil, in each treatment one sensor was installed horizontally at a depth of 0.15 m below a dripline and equidistant between two adjacent emitters following the methodology described by Enciso et al. (2009), (Fig. 2). Additionally, in I100, another sensor was placed at a depth of 0.25 m to verify that water losses at depth were almost negligible. The volumetric soil water content was measured and stored at 15 min intervals, and its variations were used to determine the in-situ field capacity. To compare the soil moisture level with the different irrigation strategies, it is presented as the ratio of the volumetric soil water content at each moment to that at field capacity (%). The irrigation events of I100 began when the volumetric soil water content fell to a value of 80% field capacity, and in the other irrigation strategies they started at the same time with corresponding reductions in IWA.

The onion ‘Hamaemi’ (Agriseeds Ibérica S.L., Valencia, Spain) was used in the experiments. It is one of the most grown cultivars in the area because it is a tender onion that is appreciated by the local market, and because of its adaptation to the soil and climatic conditions in the area, as evaluated by Cajamar Experimental Centre (Fundación Ruralcaja, 2005, 2006). The bulbs are medium size, with a flattened globose shape and a straw yellow color.
Plants were transplanted in an open field when they reached the two-leaf stage on 19 November 2015, 4 November 2016, and 30 October 2017. Seeds were sown 45 days before transplanting in 448 cell flexible polyethylene trays in a peat moss based substrate (70% blonde and 30% dark) recommended for vegetable seedbeds (Pindstrup Mosebrug S.A.E., Sotopalacios, Spain). They were maintained in a Venlo-Type greenhouse. Transplanting was done with a four row onion transplanter (Minoru Industrial co., Ltd., Okayama, Japan), with plant and row spacing of 0.11 m × 0.25 m and with four plant rows per bed. The top of the flat raised bed was 0.90 m wide (the distance from the bed centre-to-centre was 1.20 m; Fig. 2). The raised bed had a length of 7.25 m and a height of 0.15 m. The incorporation of nutrients (200-100-250 kg·ha−1 N-P2O5-K2O) was performed by fertigation following the criteria described by Miguel (2017).
Measurements
Plant growth, relative water content and membrane stability index
Three onion plants per plot were selected a week before harvest to determine the plant growth parameters: plant height, leaf number per plant, bulb diameter, neck (pseudostem) diameter and bulbing ratio (bulb diameter/neck diameter). The leaf chlorophyll index (SPAD) was measured at three points in three fully developed leaves of each plant using a SPAD-502 m (Konica Minolta Sensing Inc., Tokyo, Japan). Next, these plants were separated into leaves and bulbs and weighed (fresh weight). Then, these parts were dried at 65°C in a forced-air oven (Selecta 297; Barcelona, Spain) until reaching a constant weight to obtain the dry weight and dry matter content. The harvest index was determined as the ratio of yield to total biomass (leaves + bulbs) on a dry mass basis (g·g−1; Turner, 2004).
Leaf relative water content (%) was determined in fresh leaf discs of 2 cm diameter using the method developed by Hayat et al. (2007). The membrane stability index (%) was estimated using 0.2 g samples of fully expanded leaf tissue following the methodology described by Rady (2011). Relative water content and membrane stability index were evaluated every 30 days during the crop cycle.
Bulb yields, irrigation water use efficiency and yield response factor
Yield was determined from 3 m lengths of the two central plant rows, leaving a plant row on each side of the bed to avoid marginal effects. Bulbs were harvested two weeks after 50% of the leaves (by the pseudostems) were bent over, on 2 May 2016, 20 April 2017, and 7 May 2018. Total bulb yield was separated into marketable and non-marketable yield. For the marketable yield, the average bulb weight was determined. The non-marketable yield was separated according to the nature of blemishes, small bulbs (diameter less than 55 mm), deformed bulbs and bolting plants, according to Leskovar et al. (2012).
The IWUE was calculated as the ratio of marketable yield (fresh mass; kg·m−2) to the IWA (m3·m−2; Cabello et al., 2009). The WUE was calculated as the ratio of marketable yield (kg·m−2) to IWA + effective precipitation (m3·m−2; Ko and Piccinni, 2009). The yield response to water deficits during the growing season was determined according to Doorenbos and Kassam (1979), using the following equation:
where Ya and Ym are the actual and maximum (fully irrigated) marketable yield (kg·m
−2), respectively; ETa and ETm are the actual and maximum ET (mm), respectively; and K
y is the yield response factor. ETa and ETm were calculated using the soil water balance as follows: ET = IWA + effective precipitation, considering both the drainage and the variation in the volumetric soil water content to be negligible.
Onion bulb quality
Three representative marketable bulbs per plot were selected to determine bulb size (diameter and height) and shape (relation of diameter/height). Afterwards, these bulbs were used to determine bulb external firmness using a digital penetrometer with a tip 8 mm in diameter (Penefel DFT 14, Agro Technologies, Forges les Eaux, France). The soluble solids content (°Brix) was determined with bulb juice using a digital refractometer (PAL-1; Atago, Tokyo, Japan). Acidity was determined as citric acid (%) by titration with 0.1 M NaOH. The polyphenol content in bulbs was determined as described by Domene et al. (2014). The total carbohydrates of bulbs were determined according to BeMiller (2014). Proteins were determined by the Kjeldahl method, as described by Chang (2003).
Experimental design and statistical analysis
The experiments were performed in a randomized complete block design with three replicates. Each experimental plot area was 26.1 m2, and each plot included three beds. The results were analysed using analysis of variance (ANOVA) with Statgraphics centurion XVII (Statistical Graphics Corporation, 2014) software. Percentage data were arcsin transformed before analysis. The least significant difference (LSD) at a 0.05-probability level was used as the mean separation test.
Results
Growth periods and irrigation water applied
The total growth cycle periods were 166, 168, and 190 days in 2016, 2017, and 2018, respectively. The total pan evaporation and reference evapotranspiration were lower in 2017 (334 and 272 mm, respectively) than in 2016 (498 and 406 mm) and 2018 (576 and 469 mm). Effective precipitation was higher in 2017 (387 mm) than in 2016 (28 mm) and 2018 (148 mm). Initially, all treatments were irrigated with 40, 28, and 37 mm in 2016, 2017, and 2018, respectively, as initial irrigation amounts to ensure adequate plant establishment. The IWA volumes during the differential irrigation periods of I100, I75, and I50 were 356, 261, 180 mm, respectively, in 2016, 167, 120, 79.5 mm, in 2017, and 344, 260, 172 mm, in 2018.
Volumetric soil water content
Figure 3 shows the volumetric soil water content for the three irrigation strategies, as well as the effective precipitation, in 2016, 2017, and 2018. Generally, the volumetric soil water content values of the three treatments at a depth of 0.15 m were higher in 2017 (on average, 92.9% of the field capacity) than in 2018 (on average, 84.6% of the field capacity) or 2016 (on average, 83.6% of the field capacity) due to the higher precipitation in 2017. Soil moisture was higher in I100 than in I75, which in turn was higher than that in I50 (on average 88.8, 87.6, and 84.7% of the field capacity, respectively), as expected. Volumetric soil water content at 0.25 m soil depth in I100 in each season did not show any increase in the average values, indicating that deep percolation below the root zone was negligible.
Plant growth, relative water content and membrane stability index
The higher effective precipitation registered in 2017 compared with that in 2016 and 2018, reduced the number of irrigation events, as well as the corresponding IWA, minimizing the effect of the irrigation strategies on the different parameters in 2017, unlike what happened in 2016 and 2018. This fact is responsible for the statistical significance of the interaction between irrigation strategy and growing season in most of the studied parameters (Tables 1, 3, 4; P ≤ 0.01/0.05), so no further comments on the interactions will be made. Lower values for plant growth traits (P ≤ 0.01; Table 1), yield components (total and marketable yield and average bulb weight; Table 3), WUE, bulb size (bulb diameter) and shape (diameter/height), and bulb quality (soluble solids content, acidity, and carbohydrates; Table 4) were obtained in 2017 compared to 2016 and 2018. In contrast, the IWUE, relative water content, membrane stability index and bulbing ratio were higher (P ≤ 0.01) in 2017. The lowest percentage of non-marketable yield (Table 3; P ≤ 0.01) was obtained in 2016 because of the absence of deformed bulbs and bolting plants, while in the other years these discards represented 1.5% and 7.4% (on average), respectively.
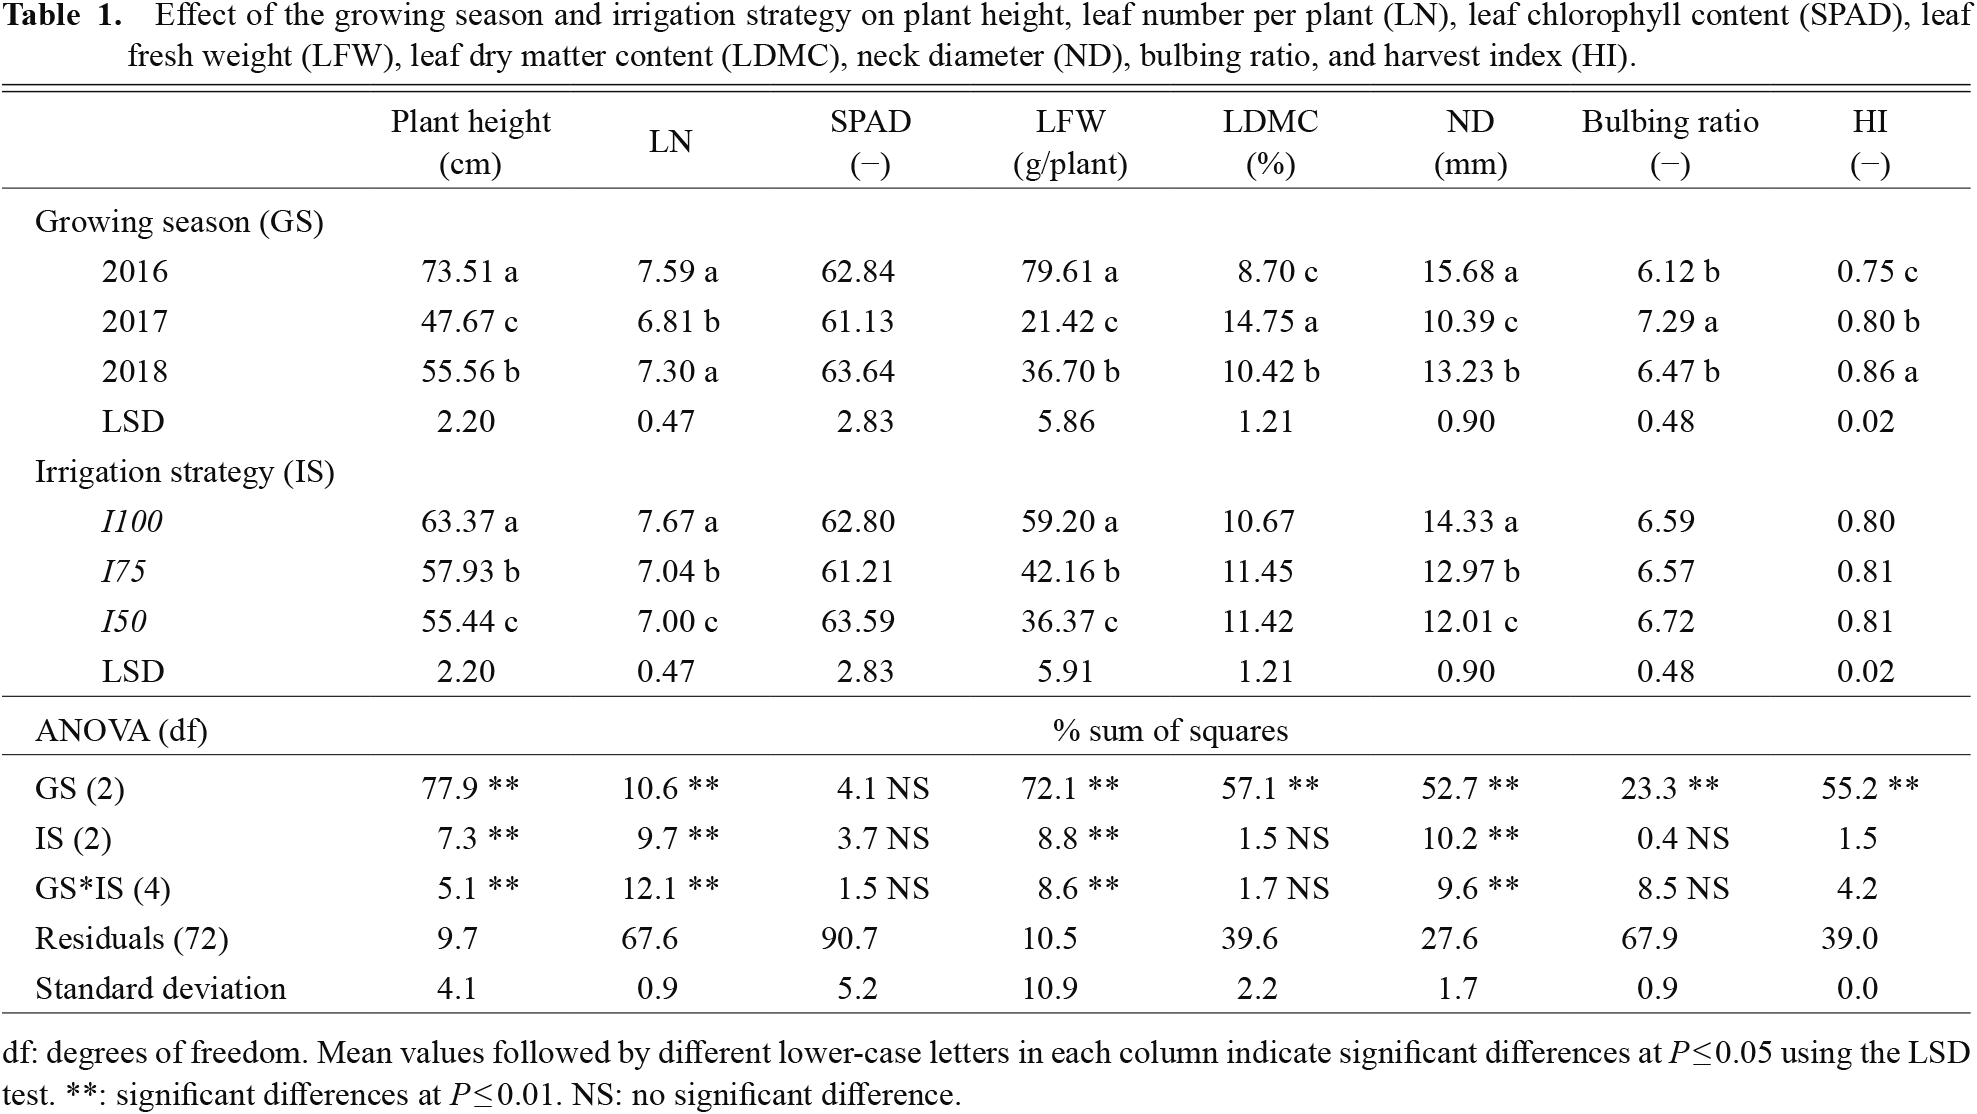
Deficit irrigation regimes reduced (P ≤ 0.01) onion plant growth (Table 1), and plant height, number of leaves/plant, neck diameter and leaf fresh weight decreased with increasing water restriction. The leaf chlorophyll index (SPAD), bulbing ratio, leaf dry matter content and harvest index were not affected (P ≤ 0.05) by the irrigation strategy. The 2018 season resulted in a higher harvest index, followed by 2017, and finally, 2016.
The lowest average relative water content was recorded in 2016, while the highest membrane stability index was recorded in 2017, probably due to the higher volumetric soil water content (on average 93% of the field capacity; Table 2) monitored in this season. The irrigation strategy did not affect (P ≤ 0.05) the relative water content or the membrane stability index values at 70 days after transplanting; however, from the analysis performed at 100 days, both parameters decreased (P ≤ 0.05) with increasing deficit irrigation, showing the biggest differences between strategies at 160 days after transplanting (Table 2).
Bulb yield, irrigation water use efficiency and yield response factor
Total bulb yield, marketable yield and average bulb weight significantly decreased as IWA decreased. I100 resulted in the highest values, while I50 led to the lowest, with intermediate values for I75 (P ≤ 0.01; Table 3).
In general, reducing IWA down to 75% of the irrigation water requirements led to an improvement in the IWUE because of the water savings (on average 26.6%) and, at the same time, a low yield reduction (on average 11.1%) compared to I100. Applying the 50% irrigation water requirement resulted in a drastic reduction in bulb yield (on average 29.4%), but the water savings (on average 50.6%) resulted in the highest IWUE.
Marketable bulb yield increased linearly (P ≤ 0.01) with IWA, and the positive linear relationships were expressed as follows: marketable yield = 1.929 + 0.0196 IWA, with a high correlation coefficient (r = 0.96). IWUE decreased linearly (P ≤ 0.01) with increasing IWA, following the expression IWUE = 43.165 − 0.057 IWA (r = −0.63), while the opposite was observed for WUE, and the relationship was expressed as WUE = 7.022 + 0.047 IWA (r = 0.51). The fitted linear regression of the onion yield response to water deficits during the three seasons was significant (P ≤ 0.01) as follows: 1 − (Ya/Ym) = 0.71 [1 − (ETa/ETm)], producing a high correlation coefficient (r = 0.96). The yield response factor (Ky) was 0.71 considering all three years together; if the growing seasons were considered separately, the values were 0.67, 0.71, and 0.76 for 2016, 2017, and 2018, respectively.
Onion bulb quality
The bulb size was affected (P ≤ 0.01; Table 4) by the irrigation strategy. The lowest bulb size (diameter and height) corresponded to I75 and I50. Bulb shape and dry matter content were not significantly (P ≤ 0.05) affected by the irrigation strategy (Table 4).
The irrigation strategy affected (P ≤ 0.05) bulb soluble solids content and acidity; I50 produced the highest soluble solids content and the lowest acidity (Table 4). The irrigation strategy did not affect (P ≤ 0.05) bulb firmness or polyphenol, carbohydrate or protein contents (Table 4). Although not significantly, water deficit regimes increased the polyphenol content and reduced the protein content.
Discussion
Doorenbos and Kassam (1979) and Ortolá and Knox (2015) reported that onion irrigation water requirements ranged from 350 and 550 mm, representing the lowest threshold of the water requirements in 2016 and 2018, respectively. The lower requirements in 2017 were related to the higher effective precipitation and lower evaporative demand that were recorded in that year compared with the other two years. The recorded IWA values were similar to those found by Leskovar et al. (2012) in a similar onion growing cycle in a humid subtropical climate with similar irrigation strategies. The volumes applied in the full irrigation strategy were similar to those applied by Martín de Santa Olalla et al. (1994) and Zheng et al. (2013).
At the beginning of the crop cycle, the plant water status did not show any difference between treatments, either for the relative water content or the membrane stability index. However, at the end of the cycle, plants under deficit irrigation strategies showed lower values of both parameters, indicating that they had poorer water status than the fully irrigated plants. This was probably related to the lower soil moisture in the deficit irrigated plants, and was also reported by Semida et al. (2017) and Wakchaure et al. (2018). Leskovar et al. (2012) and Semida et al. (2017) observed that onion plant growth and bulb yield decreased with deficit irrigation as found in this study. Stomata are sensitive to changes in soil water potential and they close in response to drying soil (Costa et al., 2007). This fact is particularly important for plants that have a shallow root system that is very sensitive to water stress, as is the case for onions. Stomatal closure decreases the internal CO2 availability, and this directly affects the rate of photosynthesis and overall plant growth (Osakabe et al., 2014), leading to a reduction in plant yield.
The regulation of stomatal apertures is a central process to determine the WUE. Given the linear relationship that exists between stomatal conductance and transpiration under a constant vapour pressure deficit of air, and the non-linear relationship between stomatal conductance and the photosynthetic rate, lower stomatal apertures may improve water use efficiency (Chaves et al., 2002). These relationships explain the higher IWUE values obtained with deficit irrigation than with the fully irrigated plants.
Full irrigation led to the highest bulb average weight (and size - diameter and height), and these decreased with water reduction. These results agree with those described by Kumar et al. (2007) and Leskovar et al. (2012).
Values of Ky lower than 1 indicate that under those conditions a crop is tolerant to a water deficit, while values of Ky greater than 1 indicate that a crop is sensitive to a water deficit (Doorenbos and Kassam, 1979; Steduto et al., 2012). In this study, Ky values were lower than 1; therefore, this can be considered as tolerant to the water deficit, in contrast to the result obtained by Kadayifci et al. (2005), which was 1.50, probably because they carried out the experiment in a summer–autumn cycle in Turkey, with more limiting conditions.
Average values of the bulb quality parameters analysed in this study are in agreement with those presented in the literature. Particularly, the soluble solids content values are in agreement with those presented by Leskovar et al. (2012); the protein and carbohydrate contents are in agreement with those presented by the Spanish database of food composition (BEDCA), which was set up according to the European standards of the European network of excellence EuroFir (BEDCA, 2006); the phenolic contents are in accordance with those obtained by Leskovar et al. (2012) and Wakchaure et al. (2018).
Reducing IWA to 50% of the irrigation water requirements increased the soluble solids content and reduced the acidity of the bulbs, probably due to the earlier bulb maturity caused by this strategy. This fact is related to comments by Zheng et al. (2013), who indicated that plants accelerated their growth process in response to water deficit, decreasing cell multiplication and expansion and thus reducing bulb yield. An increase in the soluble solids content and a decrease in acidity occurs during the ripening process, and leaves in I50 were bent over a week earlier than those in full irrigation, in agreement with Zheng et al. (2013) and Wakchaure et al. (2018), who observed that early bulb maturity corresponded with the most restrictive treatment. Similar results were reported by Semida et al. (2017), who obtained higher soluble solids content with the most severe drought stress.
Water deficit strategies did not significantly affect the total phenolic and protein contents (or the carbohydrate content) as found by Leskovar et al. (2012; who analysed the quercetin content).
Considering the average IWUE values obtained in this study and the average onion bulb price in the last three years (0.21 €·kg−1; MAPA, 2018), in the present study conditions the application of deficit irrigation would cause a reduction compared with full irrigation in terms of gross revenue (14910, 13251, 10521 €·ha−1 for I100, I75, and I50 respectively, on average for all three years), but it would cause an increase in the economic value per unit of water consumed (5.20, 6.36, and 7.81 €·m−3 for I100, I75, and I50, respectively). I50 led to the greatest economic value per unit of water consumed, but to the lowest profit (gross revenue-water cost; 10426 €·ha−1) compared to I100 (14719 €·ha−1), seriously questioning the economic viability of the crop.
In average Mediterranean climatic conditions, if water is not the limiting factor, I100 may be recommended, since it leads to the maximum yield and maximum profit for the grower without differences in bulb quality. However, if water is scarce, I75 could be applied because although yield and grower profits may be reduced, it will lead to important water savings. In rainy seasons, I50 can be also recommended, since yield and bulb quality are not negatively affected by the irrigation decrease.
Conclusions
The present study analysed the effects of continued deficit irrigation on the growth, plant water status, productive response, and irrigation water use efficiency of the onion ‘Hamaemi’. Taking into account that the productive response depends on the climate, and particularly on rainfall, under average conditions the marketable yield linearly increased with more irrigation water applied, while the irrigation water use efficiency decreased, and both had high correlation coefficients. The yield response factor was 0.71, indicating that under the analysed conditions, the crop is tolerant to water deficits. Reducing the water applied to 50% of the water requirements led to the highest irrigation water use efficiency, and resulted in important water savings. Nevertheless, it drastically reduced bulb yield and growers’ profits. Reducing the water applied to 75% of the water requirements resulted in a low yield and profit reduction, but important water savings compared with full irrigation, improving the irrigation water use efficiency. This is the recommended strategy for onion production under Mediterranean conditions.
Literature Cited
- Abdelkhalik, A., N. Pascual-Seva, I. Nájera, A. Giner, C. Baixauli and B. Pascual. 2019. Yield response of seedless watermelon to different drip irrigation strategies under Mediterranean conditions. Agric. Water Manag. 212: 99–110.
- Allen, R. G., L. S. Pereira, D. Raes and M. Smith. 1998. Crop evapotranspiration: Guidelines for computing crop requirements. FAO Irrigation and Drainage Paper No. 56. Rome. https://doi.org/10.1016/j.eja.2010.12.001
- Aquastat. 2018. Food and Agriculture Organization. https://doi.org/http://www.fao.org/nr/water/aquastat/didyouknow/index3.stm
- BEDCA (Base de Datos Española de Composición de Alimentos). 2006. Spanish Food Composition Database. http://www.bedca.net/ (accessed 8 April 2019).
- BeMiller, J. N. 2014. Carbohydrate Analysis. p. 147–177. In: S. S. Nielsen (ed.). Food Analysis, Fourth edn. Kluwer Academic, New York.
- Bessembinder, J. J. E., P. A. Leffelaar, A. S. Dhindwal and T. C. Ponsioen. 2005. Which crop and which drop, and the scope for improvement of water productivity. Agric. Water Manag. 73: 113–130.
- Blanco, V., R. Domingo, A. Pérez-Pastor, P. J. Blaya-Ros and R. Torres-Sánchez. 2018. Soil and plant water indicators for deficit irrigation management of field-grown sweet cherry trees. Agric. Water Manag. 208: 83–94.
- Cabello, M. J., M. T. Castellanos, F. Romojaro, C. Martínez-Madrid and F. Ribas. 2009. Yield and quality of melon grown under different irrigation and nitrogen rates. Agric. Water Manag. 96: 866–874.
- Chai, Q., Y. Gan, C. Zhao, H. L. Xu, R. M. Waskom, Y. Niu and K. H. M. Siddique. 2016. Regulated deficit irrigation for crop production under drought stress. A review. Agron. Sustain. Dev. 36: 1–21.
- Chang, S. K. C. 2003. Protein analysis. p. 133–146. In: S. S. Nielsen (ed.). Food Analysis. Kluwer Academic, New York.
- Chaves, M. M., J. S. Pereira, J. Maroco, M. L. Rodrigues, C. P. P. Ricardo, M. L. Osório, I. Carvalho, T. Faria and C. Pinheiro. 2002. How plants cope with water stress in the field. Photosynthesis and growth. Ann. Bot. 89: 907–916.
- Costa, J. M., M. F. Ortuño and M. M. Chaves. 2007. Deficit irrigation as a strategy to save water: Physiology and potential application to horticulture. J. Integr. Plant Biol. 49: 1421–1434.
- Domene, M. A., J. C. Gázquez, M. D. Segura and D. E. Meca. 2014. Evaluación de la calidad interna en especialidades de pimientos: Sustancias nutritivas y bioactivas. Actas Hortic. 65: 157–162.
- Doorenbos, J. and A. H. Kassam. 1979. Yield response to water. FAO Irrigation and Drainage Paper No. 33. FAO, Rome.
- Enciso, J., B. Wiedenfeld, J. Jifon and S. Nelson. 2009. Onion yield and quality response to two irrigation scheduling strategies. Sci. Hortic. 120: 301–305.
- Faostat. 2018. Food and Agriculture Organization. https://doi.org/http://www.fao.org/faostat/en/#data/QC (accessed 1 March 2019).
- Fereres, E. and M. A. Soriano. 2007. Deficit irrigation for reducing agricultural water use. J. Exp. Bot. 58: 147–159.
- Fundación Ruralcaja. 2005. Nuevas variedades de cebolla. p. 341–351. In: Memorias de actividades, resultados de ensayos hortícolas. Fundación Ruralcaja Valencia, Valencia.
- Fundación Ruralcaja. 2006. Nuevas variedades de cebolla. p. 271–275. In: Memorias de actividades, resultados de ensayos hortícolas. Fundación Ruralcaja Valencia, Valencia.
- Galindo, A., J. Collado-González, I. Griñán, M. Corell, A. Centeno, M. J. Martín-Palomo, I. F. Girón, P. Rodríguez, Z. N. Cruz, H. Memmi, A. A. Carbonell-Barrachina, F. Hernández, A. Torrecillas, A. Moriana and D. López-Pérez. 2018. Deficit irrigation and emerging fruit crops as a strategy to save water in Mediterranean semiarid agrosystems. Agric. Water Manag. 202: 311–324.
- Gallardo, M. and R. B. Thompson. 2018. Uso de sensores de humedad en suelo para mejorar el manejo del riego en cultivos de invernadero. p. 107–132. In: J. C. Gázquez (ed.). Mejora en la eficiencia del uso de agua y fertilizantes en agricultura. Cajamar Caja Rural.
- Geerts, S. and D. Raes. 2009. Deficit irrigation as an on-farm strategy to maximize crop water productivity in dry areas. Agric. Water Manag. 96: 1275–1284.
- Hayat, S., B. Ali, S. A. Hasan and A. Ahmad. 2007. Brassinosteroid enhanced the level of antioxidants under cadmium stress in Brassica juncea. Environ. Exp. Bot. 60: 33–41.
- Howell, T. A. 2001. Enhancing water use efficiency in irrigated agriculture. Agron. J. 93: 281–289.
- IVIA (Instituto Valenciano de Investigaciones Agrarias). 2011. Cálculo de necesidades de riego. http://riegos.ivia.es/calculo-de-necesidadesde-riego (accessed 1 March 2019).
- Kadayifci, A., G. I. Tuylu, Y. Ucar and B. Cakmak. 2005. Crop water use of onion (Allium cepa L.) in Turkey. Agric. Water Manag. 72: 59–68.
- Kang, S., X. Hao, T. Du, L. Tong, X. Su, H. Lu, X. Li, Z. Huo, S. Li and R. Ding. 2017. Improving agricultural water productivity to ensure food security in China under changing environment: From research to practice. Agric. Water Manag. 179: 5–17.
- Kirda, C. 2002. Deficit irrigation scheduling based on plant growth stages showing water stress tolerance. p. 3–10. In: Deficit Irrigation Practices, Water reports, 22. FAO, Rome.
- Ko, J. and G. Piccinni. 2009. Corn yield responses under crop evapotranspiration-based irrigation management. Agric. Water Manag. 96: 799–808.
- Kumar, S., M. Imtiyaz, A. Kumar and R. Singh. 2007. Response of onion (Allium cepa L.) to different levels of irrigation water. Agric. Water Manag. 89: 161–166.
- Leskovar, D. I., S. Agehara, K. Yoo and N. Pascual-Seva. 2012. Crop coefficient-based deficit irrigation and planting density for onion: Growth, yield, and bulb quality. HortScience 47: 31–37.
- Malek, Ž. and P. H. Verburg. 2017. Adaptation of land management in the Mediterranean under scenarios of irrigation water use and availability. Mitig. Adapt. Strateg. Glob. Chang. 23: 821–837.
- MAPA (Ministerio de Agricultura, Pesca y Alimentación). 2018. Anuario de estadística 2017. https://www.mapa.gob.es/es/estadistica/temas/publicaciones/anuario-de-estadistica/default.aspx (accessed 1 March 2019).
- Martín de Santa Olalla, F., J. A. de Juan Valero and C. F. Cortés. 1994. Growth and production of onion crop (Allium cepa L.) under different irrigation schedulings. Eur. J. Agron. 3: 85–92.
- Martín de Santa Olalla, F., A. Domínguez-Padilla and R. López. 2004. Production and quality of the onion crop (Allium cepa L.) cultivated under controlled deficit irrigation conditions in a semi-arid climate. Agric. Water Manag. 68: 77–89.
- Miguel, A. G. 2017. Cebolla. p. 165–202. In: J. V. Maroto and C. Baixauli (eds.). Cultivos hortícolas al aire libre. Cajamar Caja Rural, Valencia.
- Molden, D., T. Oweis, P. Steduto, P. Bindraban, M. A. Hanjra and J. Kijne. 2010. Improving agricultural water productivity: Between optimism and caution. Agric. Water Manag. 97: 528–535.
- Ortolá, M. P. and J. W. Knox. 2015. Water relations and irrigation requirements of onion (Allium cepa L.): A review of yield and quality impacts. Exp. Agric. 51: 210–231.
- Osakabe, Y., K. Osakabe, K. Shinozaki and L.-S.P. Tran. 2014. Response of plants to water stress. Front. Plant Sci. 5: 1–8.
- Pascual-Seva, N., A. San Bautista, S. López-Galarza, J. V. Maroto and B. Pascual. 2016. Response of drip-irrigated chufa (Cyperus esculentus L. var. sativus Boeck.) to different planting configurations: Yield and irrigation water-use efficiency. Agric. Water Manag. 170: 140–147.
- Pereira, L. S., T. Oweis and A. Zairi. 2002. Irrigation management under water scarcity. Agric. Water Manag. 57: 175–206.
- Rady, M. M. 2011. Effect of 24-epibrassinolide on growth, yield, antioxidant system and cadmium content of bean (Phaseolus vulgaris L.) plants under salinity and cadmium stress. Sci. Hortic. 129: 232–237.
- Semida, W. M., T. A. Abd El-Mageed, S. E. Mohamed and N. A. El-Sawah. 2017. Combined effect of deficit irrigation and foliar-applied salicylic acid on physiological responses, yield, and water-use efficiency of onion plants in saline calcareous soil. Arch. Agron. Soil Sci. 63: 1227–1239.
- Soil Survey Staff. 2014. Keys to soil taxonomy. Soil Conserv. Serv. 12: 410.
- Stamm, G. G. 1967. Problems and procedures in determining water supply requirements for irrigation projects. p. 771–785. In: R. M. Hagan, H. R. Haise and T. W. Edminster (eds.). Irrigation of Agricultural Lands, Agronomy Monograph 11. ASA, Madison, WI.
- Statistical Graphics Corporation. 2014. Statgraphics Centurion XVI. Statistical Graphics, Rockville, MD.
- Steduto, P., T. C. Hsiao, E. Fereres and D. Raes. 2012. Crop yield response to water. FAO Irrigation and Drainage Paper No. 66. Rome.
- Temesgen, T., M. Ayana and B. Bedadi. 2018. Evaluating the effects of deficit irrigation on yield and water productivity of furrow irrigated Onion (Allium cepa L.) in Ambo, Western Ethiopia. Irrig. Drain. Syst. Eng. 7: 1–6.
- Tolk, J. A. and T. A. Howell. 2003. Water use efficiencies of grain sorghum grown in three USA southern Great Plains soils. Agric. Water Manag. 59: 97–111.
- Turner, N. C. 2004. Agronomic options for improving rainfall-use efficiency of crops in dryland farming systems. J. Exp. Bot. 55: 2413–2425.
- Turral, H., J. Burke and J. M. Faurès. 2011. Climate change, water and food security. FAO. Water report No. 36. Rome.
- Verheye, W. 2009. Agro-climate-based land evaluation systems. p. 130–159. In: W. Verheye (ed.). Land Use, Land Cover and Soil Sciences—Volume II: Land Evaluation. Encyclopedia of Life Support Systems (EOLSS) Publications. Paris.
- Wakchaure, G. C., P. S. Minhas, K. K. Meena, N. P. Singh, P. M. Hegade and A. M. Sorty. 2018. Growth, bulb yield, water productivity and quality of onion (Allium cepa L.) as affected by deficit irrigation regimes and exogenous application of plant bio–regulators. Agric. Water Manag. 199: 1–10.
- Yang, H., T. Du, R. Qiu, J. Chen, F. Wang, Y. Li, C. Wang, L. Gao and S. Kang. 2017. Improved water use efficiency and fruit quality of greenhouse crops under regulated deficit irrigation in northwest China. Agric. Water Manag. 179: 193–204.
- Zheng, J., G. Huang, J. Wang, Q. Huang, L. S. Pereira, X. Xu and H. Liu. 2013. Effects of water deficits on growth, yield and water productivity of drip-irrigated onion (Allium cepa L.) in an arid region of Northwest China. Irrig. Sci. 31: 995–1008.