Abstract
Brassica napus L. is an important oil crop in China. Most of the oil from B. napus is stored in oil bodies. In this study, the biogenesis of oil bodies and variations in the gene expression levels of oil body proteins and fatty acid synthesis transcription factors were characterized during embryogenesis using ultrastructural observations and quantitative polymerase chain reaction. When comparing the fluorescence intensities of Nile red staining in embryos at various stages, increasing numbers of oil bodies were observed in B. napus embryos after the globular embryo stage. Oil bodies were observed in early embryos in the embryo itself and in suspensors at 9–11 days after pollination (globular embryo stage) using ultrastructural analyses. There were more oil bodies in embryos at the torpedo-shaped embryo stage than at the heart-shaped embryo stage. In addition, the gene expression levels of oil body proteins, including oleosins, steroleosins, and BnCLO1, but not BnCLO3, increased during the heart-shaped embryo stage and these elevated levels were maintained during the subsequent developmental stages. The expression levels of fatty acid synthesis transcription factors (BnLEC1, BnL1L, BnWRI1, and BnFUS3) increased during the early stages and decreased during the later stages, while their peak expression times differed. Expression of BnLEC1 was the first to peak, followed by BnL1L, BnWRI1, and BnFUS3. We characterized oil body formation during the early embryonic development of B. napus, including the first examination of oil bodies in globular embryos. We also documented numerical variation in oil bodies during early embryogenesis, which was consistent with the gene expression levels of oil body proteins and fatty acid synthesis transcription factors.
Introduction
Brassica napus L. is an important oil crop in China. B. napus is subject to oil accumulation and the synthesis of oil bodies used for oil storage (Chao et al., 2017). The oil body is a cellular organelle composed of a semi-unit membrane surrounding triacylglycerol (Cheng and Song, 2006). The semi-unit membrane consists of a phospholipid monolayer and oil body proteins inlaid in the phospholipid molecules. The oil body proteins include oleosins, caleosins, and steroleosins (Tzen, 2012). Genomic and proteomic studies of oil body proteins by Jolivet et al. (2011) have shown that oleosins and caleosins accumulate during the early stages of seed development, 12–17 days after pollination (DAP), before and after the torpedo-shaped embryo period, whereas steroleosins accumulate later (approximately 25 DAP). Obermeier et al. (2009) used serial analysis of gene expression technology to study the gene expression profiles of B. napus at 23 DAP (middle torpedo-shaped embryo period) and 35 days later at the early bent cotyledon embryo stage, as well as the genes associated with the expression of napins, cruciferins, and oleosins, which were expressed abundantly at 35 DAP.
Oil accumulation and oil body proteinsynthesis in B. napus are regulated by various transcription factors, such as LEC1, L1L (LEC1-like), WRI1 (WRINKLED1), and FUS3 (FUSCA3) (Li et al., 2016; Song et al., 2016; Min et al., 2017). LEC1 belongs to the NF-YB gene family and is a key gene in embryonic development. It plays a regulatory role in various aspects of seed development, such as embryo morphogenesis, the transient transformation of seeds from early development to maturity, and lipid and protein accumulation during seed maturation (Pelletier et al., 2017; Tao et al., 2017). L1L is a homologous gene of LEC1. The specificity of the plant LEC1 gene family is related to its specific histone folding dimer crystal structure (Gnesutta et al., 2017). LEC1 or L1L overexpression can increase the oil content of seeds (Tan et al., 2011). Mu et al. (2008) found that LEC1 overexpression upregulated the expression of 58% of the components of fatty acid synthesis pathways, including WRI1 and FUS3. WRI1 is a member of the APETALA2 (AP2)/EREBP family and plays a regulatory role in fatty acid synthesis and the late stage of glycolysis (Cernac and Benning, 2004). Compared with wild-type Arabidopsis, the seed coat of the wri1 mutant is folded and the seed oil content is decreased. WRI1 overexpression in B. napus is upregulated by glycolysis, fatty acid synthesis, lipid synthesis, and flowering gene expression. Additionally, flowering time and triacylglycerol content in seeds and vegetative organs are increased (Li et al., 2015; Kanai et al., 2016). FUS3 belongs to the plant-specific B3 superfamily and is a key gene in LEC1 regulation of fatty acid synthesis. Mutation of the FUS3 gene reduces seed oil accumulation and affects the expression of LEC1, LEC2, ABI3, and WRI1, whereas triglyceride accumulation is increased after overexpression of FUS3 (Elahi et al., 2015; Zhang et al., 2016).
Several studies investigated oil body biogenesis during the early development period of B. napus. For instance, we previously observed oil body distribution in the heart-shaped embryo period of B. napus (He and Wu, 2009) and Boulard et al. (2015) confirmed the detection of oleosin in globular embryos after microscopic culture. However, there are few reports of oil body distribution during the earlier development of B. napus zygotic embryos (such as the globular embryo period) and its regulation. In the present study, we analyzed the morphological characteristics of oil bodies and the expression of oil body proteins and transcription factor genes in B. napus embryos at 9–35 DAP (globular embryo period to bent cotyledon stage). Our results provide a theoretical basis for understanding the formation mechanism of oil bodies, which may help improve the oil content of B. napus.
Materials and Methods
Experimental materials
The ‘Westar’ cultivar and DH line (Wang et al., 2013; Chao et al., 2017) of B. napus, including the low-oil-content (40.7%) QT318 line and high-oil-content (51%) QT181 line, were planted in a greenhouse at Huanggang Normal University (Huanggang, China). Plants were grown from the end of September to the beginning of October, and harvested in May of the following year.
Ultrathin sections and transmission electron microscopy observations
Brassica napus ovules at 9–11 DAP (globular embryo period) (He and Wu, 2009) were placed in a pre-fixation solution (2.5% glutaraldehyde, 4% paraformaldehyde, 0.1 M phosphate buffer, pH 7.4). Samples were washed four times with phosphate buffer for 30 min per wash. The fixative solution (1% osmium tetroxide, 0.1 M phosphate buffer, pH 7.4) was incubated at 4°C for 4 h, followed by gradient dehydration in 10%, 30%, 50%, 70%, 80%, 90%, and 95% absolute ethanol, at 15–20 min per concentration. The transition of anhydrous ethanol and anhydrous acetone (v:v, 1:2, 1:1, and 2:1, respectively) required 30 min per stage. Anhydrous acetone was infiltrated twice for 30 min each time. The transition of anhydrous acetone and Spurr resin mixture (v:v, 1:2, 1:1, and 2:1, respectively) required 12 h per stage. Pure Spurr resin was infiltrated for 24 h and the resin replaced in the middle. The sample was embedded and polymerized at 40, 50, 60, and 70°C for 12 h, and then sectioned using a Sorvall MTX ultramicrotome (Thermo Fisher Scientific Inc., Waltham, MA, USA). The semi-thin sections were stained with toluidine blue, observed using a TE-2000U microscope (Nikon Corporation, Tokyo, Japan) and photographed using a CoolSNAP HQ2 charge-coupled device (CCD) imaging system (Photometrics, Tucson, AZ, USA). Ultrathin sections were double-stained with uranyl acetate and observed using a FEI Tecnai G2 20 (Bionand, Málaga, Spain), with an attached CCD imaging system. The statistical analyses of organelles, such as oil bodies, plastids, and chloroplasts, were conducted according to He et al. (2017).
Anatomical observation of siliques and fluorescent microscopy observation
The early ovules and embryos were isolated from B. napus by manual dissection according to previously established methods (Li et al., 2018). Embryos from these samples were stained with 1 μg·mL−1 Nile red (9-diethylamino-5H-benzo[α]phenoxazine-5-one; Sigma, St. Louis, MO, USA) in acetone for 30 min at 37°C, according to He and Wu (2009). The stained embryos were observed using an excitation wavelength of 543 nm on an inverted microscope (Leica DM IRE2) equipped with a CCD camera (CCD RS image MicroMAX; Princeton Instruments, Inc., Trenton, NJ, USA) at room temperature.
Gene expression analysis by fluorescence quantitative polymerase chain reaction (qPCR)
Brassica napus embryos at 9–35 DAP were manually separated using a dissecting microscope. They were divided into six groups according to DAP: 9–11 DAP (globular embryo period), 12–13 DAP (heart-shaped embryo period), 14–15 DAP (torpedo-shaped embryo period), 16–18 DAP (early bent embryo period), 19–24 DAP (bent cotyledon embryo stage), and 25–35 DAP (green cotyledon embryo stage). Total RNA was extracted using TRIzol (Thermo Fisher Scientific) and the extracted RNA was reverse-transcribed into cDNA with M-MLV Reverse Transcriptase (Invitrogen, Carlsbad, CA, USA). qPCR was performed using Advanced SYBR Green Supermix (Bio-Rad Laboratories, Hercules, CA, USA) on a CFX real-time PCR detection system (Bio-Rad). The results were analyzed using CFX manager software (Bio-Rad). The primer sequences are shown in Table 1. The primers for the reference gene BnACT2 were US (5'-GCACCAAGCAGCATGAAGA-3') and UAS (5'-ATTCCTGGACCTGCCTCAT-3').
Statistical analyses
Each experiment was repeated at least three times. One-way analysis of variance was used to identify significant differences between groups in all replicates. P values were analyzed using Student’s t-test. Analyses were conducted using SPSS ver. 13 (SPSS Inc., Chicago, IL, USA). Digital images were processed using Adobe Photoshop CS2 (Adobe Inc., San Jose, CA, USA) and CorelDRAW 12 (Corel, Ottawa, Canada).
Results
Morphologies of siliques and ovules of B. napus plants with different oil contents
Embryos at different developmental stages were isolated from ‘Westar’ cultivar ovules in siliques (Fig. 1A–H). The morphologies were of two samples of the B. napus DH line with different oil contents (low-oil-content (40.7%) QT318 and high-oil-content (51%) QT181) (Wang et al., 2013; Chao et al., 2017). The siliques of the two types of B. napus with high and low oil contents were traced from pollination to maturation. No differences were observed in the morphologies of the ovary and ovules among the four varieties of B. napus (QT318, QT181, and their two parents), including silique length (t-test, P > 0.05; Fig. 1J) and ovule distribution, but there were differences in the number and size of ovules (P < 0.05). Figure 1I shows ovule morphology at different developmental stages: a globular-shaped embryo, a heart-shaped embryo, and a torpedo-shaped embryo. The diameters of the ovules from B. napus with high and low oil contents differed (Fig. 1K). QT318 had a greater ovule diameter than QT181 (P < 0.05).
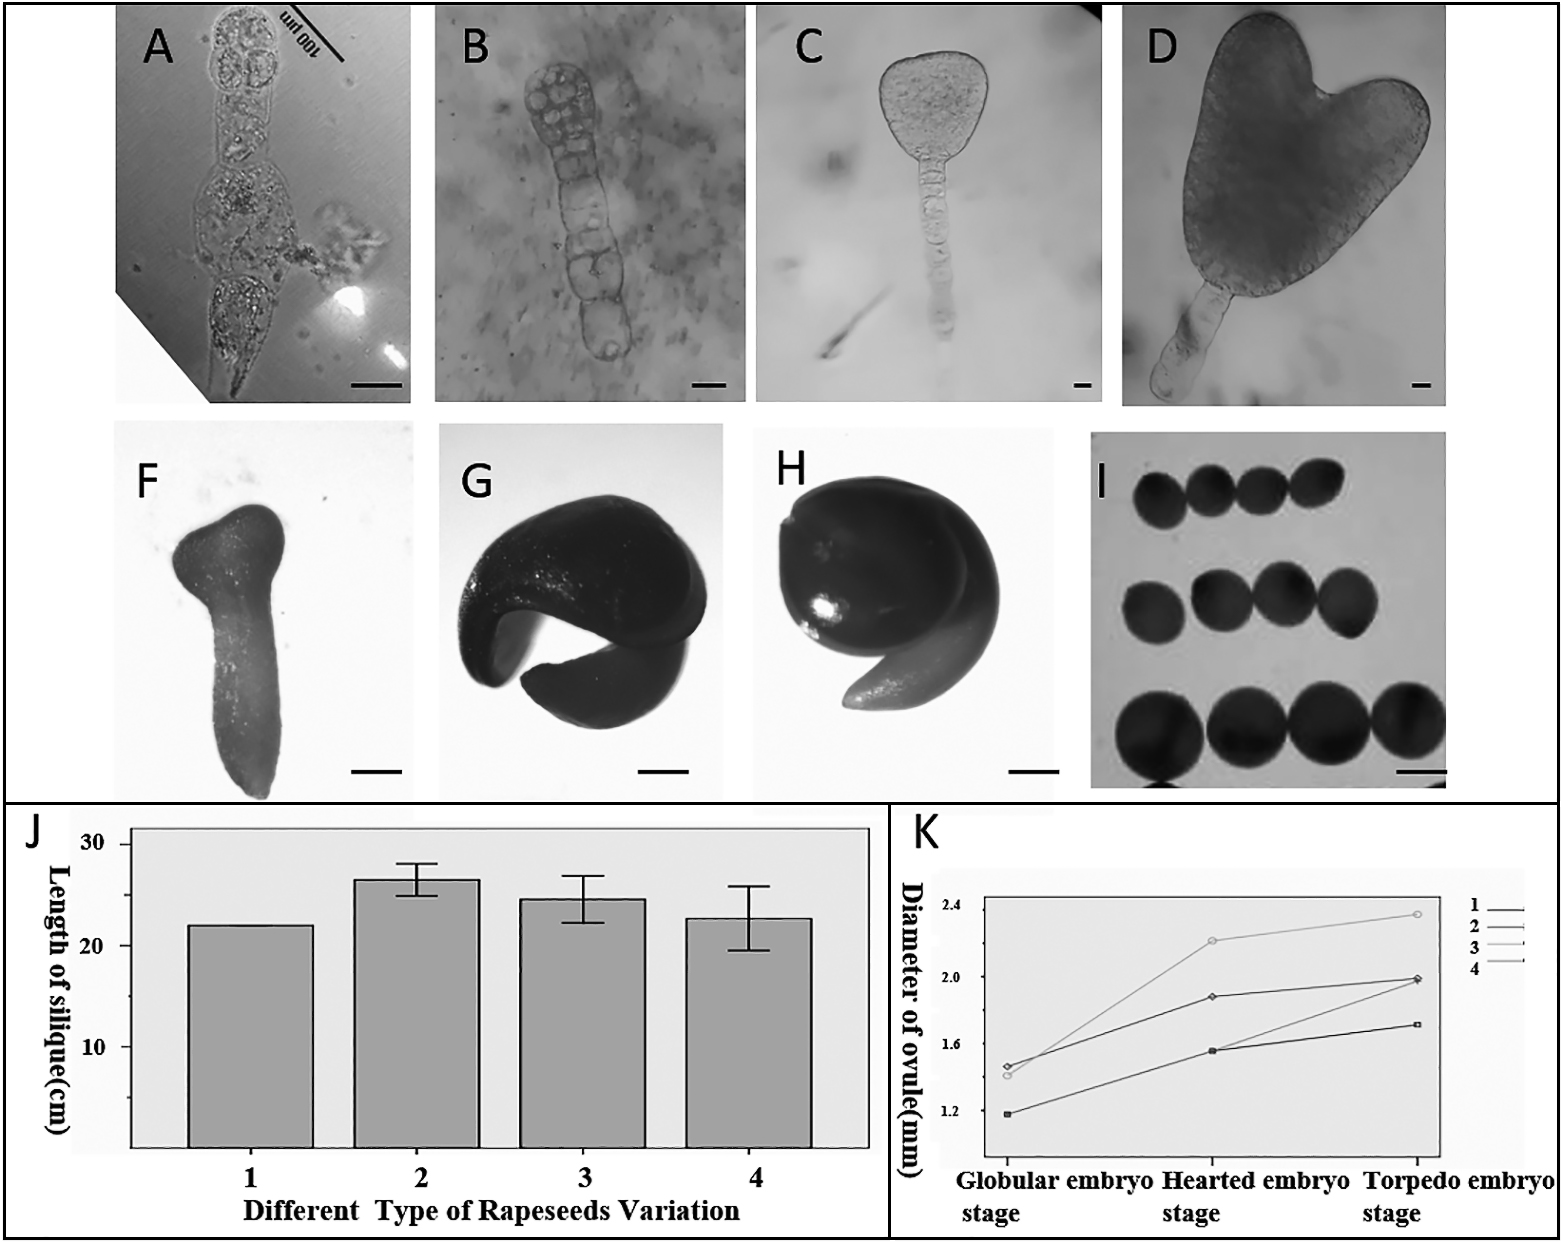
Embryos from the high-oil-content QT181 line were characterized at different developmental stages: the early globular embryo period, globular embryo period, early heart-shaped embryo period, heart-shaped embryo period, late heart-shaped embryo period, and torpedo-shaped embryo period (Fig. 2A–F). In the early globular embryo period, the embryo was small with four cells, the suspensor was very long, and the bulliform cell at the end of the suspensor had a large vacuole (Fig. 2A, B). Because the original epidermis continued to divide and grow, the growth of the cells on both sides of the globular embryo accelerated and gradually differentiated into the two cotyledons (Fig. 2C, D). In the late heart-shaped embryo, the hypocotyl elongated and the two sides on the top gradually separated to form the cotyledon (Fig. 2E). The hypocotyl grew longer and the cotyledons were clearly visible above the hypocotyl, whereas the suspensor remained in the torpedo-shaped embryo (Fig. 2F). Nile red dyes are fat soluble and can be used to track the amount and distribution of oil bodies. The distribution of oil bodies in embryos at each stage was evaluated by comparing fluorescence intensities from Nile red staining in embryos at the various stages (Fig. 2A1–F1). The average fluorescence intensity between QT181 and QT318 line varied periodically. The average fluorescence intensity of QT181 was higher than that of QT318 (Fig. 2G) in the early embryo stages from the early globular embryo period to the heart-shaped embryo period. However, during the torpedo-shaped embryo period, the average fluorescence intensity of QT318 was much higher than that of QT181. Regardless, there was no difference (P > 0.05) in the fluorescence intensity of the oil bodies between the two B. napus lines during the whole embryo period, indicating that the number of oil bodies remained the same in the two types of B. napus during the embryo development process. Furthermore, observations of the ultrastructure of globular embryos showed that oil bodies were formed in the embryo body and suspensor, with all oil bodies < 0.5 μm in diameter (n > 200) (Fig. 3B–F). Because oil bodies may have been transformed from starch granules, we also observed the development of plastids and chloroplasts in the embryo and endosperm. There were significant differences in the distribution of plastids and chloroplasts in embryoid bodies, suspensors, and endosperm (Fig. 3B–H). The plastids in the embryo itself and in the suspensor were mainly starch granules (Fig. 3B–F) and the plastids in the suspensor (Fig. 3E, F) accumulated more starch granules. Plastids in the endosperm (Fig. 3G, H) developed into a structurally intact chloroplast.

The distribution of oil bodies in cross-sections of embryonic cells in the low-oil-content QT318 and high-oil-content QT181 lines were observed and compared. There was no significant difference in the number of oil bodies in QT318 and QT181 during the globular embryo and heart-shaped embryo periods (Fig. 4). The number of oil bodies in the late torpedo-shaped embryo cells differed significantly. In the torpedo-shaped embryos, QT318 had fewer oil bodies than QT181 (P < 0.05; Fig. 4A). In contrast, there were no differences between QT318 and QT181 in total oil body area in the transverse sections of embryonic cells.
Expression analysis of early embryo oil body proteins
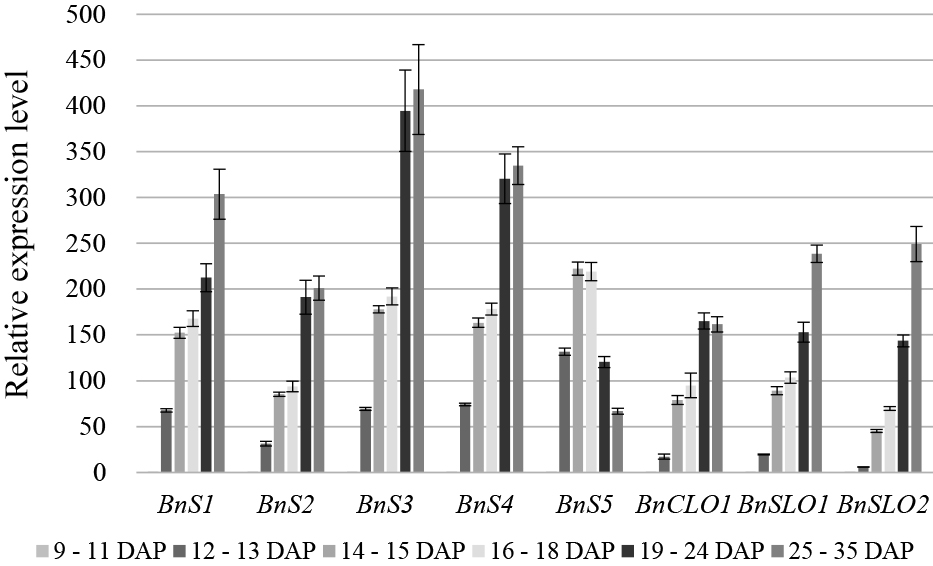
Using qPCR, we detected five oleosin genes, BnS1–BnS5 (Fig. 5), and two caleosin genes, BnCLO1 (Fig. 5) and BnCLO3 (Fig. 6) (Jolivet et al., 2011). The expression of BnSLO1 and BnSLO2 steroleosins in the early embryos of B. napus exhibited significant changes (P < 0.05; Fig. 5). The gene expression levels of the five oleosins increased from 9 to 15 DAP, i.e., the globular embryo to the torpedo-shaped embryo period, and the expression of BnS1–BnS4 continued to increase thereafter; however, BnS5 gene expression began to decrease at 19 DAP. The expression trends of BnCLO1, BnSLO1, and BnSLO2 were similar to those of the oleosin genes, whereas the expression of BnCLO3 did not change significantly during the late embryonic developmental stages (Fig. 6).
Expression analysis of early embryonic fatty acid synthesis transcription factors
Oil and fat accumulation and oil body protein synthesis are regulated by various transcription factors, such as LEC1, L1L, WRI1, and FUS3. Our results indicated that the gene expression patterns of the fatty acid synthesis transcription factors BnLEC1, BnL1L, BnWRI1, and BnFUS3 during embryonic development first increased and then decreased (Fig. 7). The gene expression levels of BnLEC1, BnL1L, BnWRI1, and BnFUS3 increased significantly from 12 to 13 DAP (heart-shaped embryo period). BnLEC1 exhibited the highest expression level, followed by BnL1L, at 14–15 DAP (the torpedo-shaped embryo period). Finally, BnWRI1 and BnFUS3 reached their highest levels at 16–18 DAP (Fig. 7).
Discussion
The oil in B. napus is stored in oil bodies and the oil content regulated by related genes. Understanding the developmental process and mechanism of the genetic regulation of oil bodies in B. napus has practical significance to the improvement of seed oil content. Many studies investigated the shape and distribution of oil bodies in B. napus with different oil contents. However, the dynamic development of oil bodies during B. napus embryogenesis is deeply buried in ovules and is surrounded by a large number of endosperm cells, which makes them difficult to observe and manipulate. Our group has accumulated many years of experience in the microscopic observation and manipulation of embryos by ultrastructural or real-time PCR analysis of large numbers of B. napus embryos, both in vitro and in vivo.
In the present study, oil bodies were found early in the development of the embryo itself and in the suspensor at 9–11 DAP (globular embryo stage) in both low-oil-content and high-oil-content B. napus lines. Boulard et al. (2015) isolated the early embryos of different genotypes of B. napus to characterize the oil body development process during seed formation, but only observed oil body distribution in embryos at 15 DAP, which is later than in the present study. Borisjuk et al. (2013) analyzed the distribution of oil in B. napus at 10 DAP and in seeds during later periods using magnetic resonance imaging. Although the time point for analysis was earlier than in Boulard et al. (2015), the whole seed was analyzed and the embryo was not isolated for an accurate analysis. Compared with mature seeds, there are few oil bodies in globular embryos and they are also small (< 0.5 μm in diameter). We found the oil body smaller than the previously reported diameters (range: 0.5–2.5 μm) (Tzen et al., 1993; Murphy, 2001; Mantese et al., 2006). In addition, the number and volume of oil bodies increased as the embryo developed (Borisjuk et al., 2013; Miquel et al., 2014; Boulard et al., 2015). The gene expression levels of all the oil body proteins and fatty acid synthesis transcription factors also changed. The expression levels of BnCLO3 did not change significantly throughout embryonic development, but the expression of other oil body protein genes increased significantly during the heart-shaped embryo period, and then continued to increase. Kim et al. (2002) reported that oleosin S5 was expressed earlier than S1–S4 during Arabidopsis silique development. We showed that BnS5 expression in B. napus was highest at 14–18 DAP (the period from the torpedo-shaped to early bent stages), which was similar to the findings of Kim et al. (2002). Hyun et al. (2013) identified oleosin family genes that were specifically expressed or highly expressed in castor and flax seeds, and speculated that they were involved in the formation of oil in seeds. Lu et al. (2006) and Siloto et al. (2006) used reverse genetics to show that oleosins were important regulators of oil body size. Hernandez-Pinzon et al. (2001) reported that there are two isoforms of caleosins, 25 kDa and 27 kDa, which have different cell localizations and expression patterns. The 25-kDa protein is localized in the oil bodies in the embryo and germinated cotyledon cells, whereas the 27-kDa protein has an endoplasmic reticulum binding domain, which is distributed not only in the embryo but also in various tissues such as roots, stems, and leaves. Our qPCR results also showed that BnCLO1 and BnCLO3 had different gene expression patterns during embryonic development. BnCLO1 showed an increasing trend with the appearance of oil bodies, whereas BnCLO3 showed no significant difference. We speculate that this difference in expression is related to the different functions of the proteins. Finally, LEC1 is a seed-specific “pioneer” transcription factor, which is not only a key regulator of embryonic development, but also regulates the expression of multiple downstream transcription factors (Obermeier et al., 2009). We therefore detected its expression early in embryonic development using qPCR. Our results showed that LEC1 had the highest expression level at 12–13 DAP (heart-shaped embryo period) and its homologous gene L1L followed at 14–15 DAP (the torpedo-shaped embryo period). Gene expression was also highest at this time and the downstream transcription factors BnWRI1 and BnFUS3 reached their highest expression levels. This sequence may suggest a regulatory relationship between the transcription factors BnLEC1, BnL1L, BnWRI1, and BnFUS3 during embryonic development.
Literature Cited
- Borisjuk, L., T. Neuberger, J. Schwender, N. Heinzel, S. Sunderhaus, J. Fuchs, J. O. Hay, H. Tschiersch, H. Braun, P. Denolf, B. Lambert, P. M. Jakob and H. Rolletschek. 2013. Seed architecture shapes embryo metabolism in oilseed rape. Plant Cell 25: 1625–1640.
- Boulard, C., M. Bardet, T. Chardot, B. Dubreucq, M. Gromova, A. Guillermo, M. Miquel, N. Nesi, S. Yen-Nicolaÿ and P. Jolivet. 2015. The structural organization of seed oil bodies could explain the contrasted oil extractability observed in two rapeseed genotypes. Planta 242: 53–68.
- Cernac, A. and C. Benning. 2004. WRINKLED1 encodes an AP2/EREB domain protein involved in the control of storage compound biosynthesis in Arabidopsis. Plant J. 40: 575–585.
- Chao, H., H. Wang, X. Wang, L. Guo, J. Gu, W. Zhao, B. Li, D. Chen, N. Raboanatahiry and M. Li. 2017. Genetic dissection of seed oil and protein content and identification of networks associated with oil content in Brassica napus. Sci. Rep. 7: 46295. DOI: 10.1038/srep46295.
- Cheng, H. Y. and S. Q. Song. 2006. Seed lipid storage organelles: oilbodys and their proteins. Chinese Bulletin of Botany 23: 418–430 (In Chinese).
- Elahi, N., R. W. Duncan and C. Stasolla. 2015. Decreased seed oil production in FUSCA3 Brassica napus mutant plants. Plant Physiol. Biochem. 96: 222–230.
- Gnesutta, N., D. Saad, A. Chaves-Sanjuan, R. Mantovani and M. Nardini. 2017. Crystal structure of the Arabidopsis thaliana L1L/NF-YC3 histone-fold dimer reveals specificities of the LEC1 family of NF-Y subunits in plants. Mol. Plant 10: 645–648.
- He, Y. and Y. Wu. 2009. Oil body biogenesis during Brassica napus embryogenesis. J. Integr. Plant Biol. 51: 792–799.
- He, Y., C. Cao, W. Shen, D. Huang, S. Ma and Y. Wu. 2017. Study on the ultrastructure and proteome of oil bodies in Brassica napus L. seeds. Plant Sci. J. 35: 566–573.
- Hernandez-Pinzon, I., K. Patel and D. J. Murphy. 2001. The Brassica napus calcium-binding protein, caleosin, has distinct endoplasmic reticulum- and lipid body-associated isoforms. Plant Physiol. Biochem. 39: 615–622.
- Hyun, T. K., D. Kumar, Y. Y. Cho, H. N. Hyun and J. S. Kim. 2013. Computational identification and phylogenetic analysis of the oil-body structural proteins, oleosin and caleosin, in castor bean and flax. Gene 515: 454–460.
- Jolivet, P., C. Boulard, A. Bellamy, B. Valot, S. d’Andréa, M. Zivy, N. Nesi and T. Chardot. 2011. Oil body proteins sequentially accumulate throughout seed development in Brassica napus. J. Plant Physiol. 168: 2015–2020.
- Kanai, M., S. Mano, M. Kondo, M. Hayashi and M. Nishimura. 2016. Extension of oil biosynthesis during the mid-phase of seed development enhances oil content in Arabidopsis seeds. Plant Biotechnol J. 14: 1241–1250.
- Kim, H. U., K. Hsieh, C. Ratnayake and A. H. Huang. 2002. A novel group of oleosins is present inside the pollen of Arabidopsis. J. Biol. Chem. 277: 22677–22684.
- Li, Q., J. Shao, S. Tang, Q. Shen, T. Wang, W. Chen and Y. Hong. 2015. Wrinkled1 accelerates flowering and regulates lipid homeostasis between oil accumulation and membrane lipid anabolism in Brassica napus. Front Plant Sci. 6: 1015. DOI: 10.3389/fpls.2015.01015.
- Li, S., J. Xiang, Y. Fang and J. Li. 2018. Developmental characteristics of silique and structural comparision of embryo from oil radish. Northern Horticulture 2018: 99–102 (In Chinese).
- Li, Y. L., Q. F. Sun and Y. P. Wang. 2016. Research advance in transcriptional regulation of lipid synthesis and accumulation in plant. Mol. Plant Breed. 14: 2509–2518.
- Lu, C., M. Fulda, J. G. Wallis and J. Browse. 2006. A high-throughput screen for genes from castor that boost hydroxy fatty acid accumulation in seed oils of transgenic Arabidopsis. Plant J. 45: 847–856.
- Mantese, A. I., D. Medan and A. J. Hall. 2006. Achene structure, development and lipid accumulation in sunflower cultivars differing in oil content at maturity. Ann. Bot. 97: 999–1010.
- Min, W. L., X. T. Cao, G. S. Ji and G. Z. Zhang. 2017. Research of plant transcription factors involving in fatty acid synthesis. Bulletin of Fermentation Science and Technology 46: 107–112 (In Chinese).
- Miquel, M., G. Trigui, S. d’Andréa, Z. K. Kelemen, S. Baud, A. Berger, C. Deruyffelaere, A. Trubuil, L. Lepiniec and B. Dubreucq. 2014. Specialization of oleosins in oil body dynamics during seed development in Arabidopsis seeds. Plant Physiol. 164: 1866–1878.
- Mu, J., H. Tan, Q. Zheng, F. Fu, Y. Liang, J. Zhang, X. Yang, T. Wang, K. Chong, X. J. Wang and J. Zuo. 2008. LEAFY COTYLEDON1 is a key regulator of fatty acid biosynthesis in Arabidopsis. Plant Physiol. 148: 1042–1054.
- Murphy, D. J. 2001. The biogenesis and functions of lipid bodies in animals, plants and microorganisms. Prog. Lipid Res. 40: 325–438.
- Obermeier, C., B. Hosseini, W. Friedt and R. Snowdon. 2009. Gene expression profiling via Long SAGE in a non-model plant species: a case study in seeds of Brassica napus. BMC Genomics 10: 295. DOI: 10.1186/1471-2164-10-295.
- Pelletier, J. M., R. W. Kwong, S. Park, B. H. Le, R. Baden, A. Cagliari, M. Hashimoto, M. D. Munoz, R. L. Fischer, R. B. Goldberg and J. J. Harada. 2017. LEC1 sequentially regulates the transcription of genes involved in diverse developmental processes during seed development. Proc. Nat. Acad. Sci. USA 114: E6710–E6719.
- Siloto, R. M., K. Findlay, A. Lopez-Villalobos, E. C. Yeung, C. L. Nykiforuk and M. M. Moloney. 2006. The accumulation of oleosins determines the size of seed oilbodies in Arabidopsis. Plant Cell 18: 1961–1974.
- Song, L., C. M. Fan, Y. H. Chen, X. Y. Zhang and Z. M. Hu. 2016. The molecular regulation mechanism of the plant lipid biosynthesis. Mol. Plant Breed. 14: 2178–2187.
- Tan, H., X. Yang, F. Zhang, X. Zheng, C. Qu, J. Mu, F. Fu, J. Li, R. Guan, H. Zhang, G. Wang and J. Zuo. 2011. Enhanced seed oil production in canola by conditional expression of Brassica napus LEAFY COTYLEDON1 and LEC1-LIKE in developing seeds. Plant Physiol. 156: 1577–1588.
- Tao, Z., L. Shen, X. Gu, Y. Wang, H. Yu and Y. He. 2017. Embryonic epigenetic reprogramming by a pioneer transcription factor in plants. Nature 551: 124–128.
- Tzen, J. T. C. 2012. Integral proteins in plant oil bodies. ISRN Botany 2012: 173954.
- Tzen, J. T. C., Y. Z. Cao, P. Laurent, C. Ratnayake and A. H. Huang. 1993. Lipids, proteins and structure of seed oil bodies from diverse species. Plant Physiol. 101: 267–276.
- Wang, X., H. Wang, Y. Long, D. Li, Y. Yin, J. Tian, L. Chen, L. Liu, W. Zhao, Y. Zhao, L. Yu and M. Li. 2013. Identification of QTLs associated with oil content in a high-oil Brassica napus cultivar and construction of a high-density consensus map for QTLs comparison in B. napus. PLOS ONE 8: DOI: 10.1371/journal.pone.0080569.
- Zhang, M., X. Cao, Q. Jia and J. Ohlrogge. 2016. FUSCA3 activates triacylglycerol accumulation in Arabidopsis seedlings and tobacco BY2 cells. Plant J. 88: 95–107.