Materials and Methods
Growth conditions
Experiments were conducted in a greenhouse (width, 9 m; length, 18 m; gutter height, 4.75 m) at the Institute of Vegetable and Floriculture Science, National Agriculture and Food Research Organization, Tsukuba, Japan (36°26'N, 140°10'E). A commercial sweet pepper (Capsicum annuum L.) cultivar, ‘Artega’ (Enza Zaden, North Holland, The Netherlands) was grown hydroponically using a rockwool system. Seeds were sown in plug trays filled with nursery soil (Tane Baido 1; Sumitomo Forestry Landscaping, Tokyo, Japan) and incubated in a germination chamber in the dark at 28°C for three days. Seedlings were then placed in a growth chamber (Nae-terrace; Mitsubishi Chemical Agri Dream, Tokyo, Japan) and grown under constant illumination with a 16-h day (25°C)/8-h night (20°C) cycle at 1000 μmol·mol−1 CO2. The seedlings were fertilized every day with a 1:3 mixture of two commercial nutrient solutions (High-Tempo Ar and High-Tempo Cu; Sumitomo Chemical, Tokyo, Japan). The mixture contained 6.45 mEq·L−1 P2O5, 9.20 mEq·L−1 NO3-N, 1.35 mEq·L−1 SO4, 0.87 mEq·L−1 NH4-N, 5.61 mEq·L−1 K2O, 1.67 mEq·L−1 MgO, 4.96 mEq·L−1 CaO, 3.39 mg·L−1 Fe, 0.23 mg·L−1 B2O3, 0.34 mg·L−1 MnO, 0.13 mg·L−1 Zn, 0.04 mg·L−1 Cu, and 0.06 mg·L−1 Mo, and the electrical conductivity was 1.8 dS·m−1. After three weeks, the seedlings were transplanted into rockwool cubes (7.5 × 7.5 × 6.5 cm, Grodan Delta Block; Rockwool B.V., Limburg, The Netherlands) and placed in the greenhouse for one week.
On 10 July 2019, the seedlings were transplanted into six rows of rockwool slabs (width, 20 cm; length, 100 cm; height, 7.5 cm, Grodan Expert; Rockwool B.V.). Each row was 16 m long with 1.6 m between rows. A total of 384 plants were transplanted in the four middle rows, and 96 plants were transplanted in the two border rows as guard plants. The planting densities were 3.75 plants·m−2 and 7.5 stems·m−2. Plants were trained to two main stems, and the weaker laterals of each dichotomous branch above the second phytomer at 36 days after transplanting (DAT), or above the first phytomer from 37 DAT, were pruned. Spacing between the sets of training wires was 50 cm.
The plants were supplied with a mixture of three commercial fertilizer solutions (OAT House; OAT Agrio, Tokyo, Japan) with a modified SA prescription. Concentrated stock solutions of the three fertilizers were mixed in a ratio of 1:1:0.25 (OAT-S1:OAT-2:OAT-5) and diluted with water. According to the manufacturer, the nutrient contents at the standard dilution (100-fold) were 17.1 mEq·L−1 NO3-N, 0.4 mEq·L−1 NH3-N, 4.4 mEq·L−1 P2O5, 10.2 mEq·L−1 K2O, 8.2 mEq·L−1 CaO, 3.0 mEq·L−1 MgO, 2.75 mg·L−1 MnO, 3.05 mg·L−1 B2O3, 7.95 mg·L−1 Fe, 0.07 mg·L−1 Cu, 0.17 mg·L−1 Zn, and 0.07 mg·L−1 Mo. Under our experimental conditions, the electrical conductivity values of the raw water and the 100-fold diluted nutrient solution were 0.27 and 2.1 dS·m−1, respectively. As the plants grew larger, the electrical conductivity of the nutrient solution was increased from 1.5 dS·m−1 at 0–47 DAT, to 2.0 dS·m−1 at 48–70 DAT, and to 2.5 dS·m−1 until the end of the experiment (12 March 2020, 246 DAT). Application of the nutrient solution was controlled based on outdoor solar radiation and the frequency was every 0.6 MJ·m−2. Drainage was discarded, and the daily drainage rate was maintained above 30% of the total nutrient solution applied.
The environmental conditions in the greenhouse were controlled and recorded every minute by a modified Ubiquitous Environmental Controlling System (YoshiMax; Sanki Keiso, Tokyo, Japan; Yasuba et al., 2013). Natural ventilation began at 25°C (0–70 DAT) or 28–29°C (71–119 DAT). The roof window was closed from 119 DAT for CO2 application. A heat pump (Green Package; Nepon, Tokyo, Japan) set at 20°C was used for night cooling in the summer (until 72 DAT). Heating was achieved by using a liquefied petroleum gas heating system (House Kaonki; Nepon) and heating initiation was set at 18°C in the winter (from 104 DAT). A shade curtain (approximately 50% shade; SLS30 Harmony; Seiwa, Tochigi, Japan) started to close when the outdoor solar radiation was greater than 0.7 kW·m−2. A fogging system consisting of a power spray (Set Doufun; Maruyama Mfg, Tokyo, Japan) and an air compressor (Super Oil-free Bebicon; Hitachi Industrial Equipment Systems, Tokyo, Japan) were used during the day-time for humidification, and a relative humidity > 70% was maintained. Daily mean air temperature in the greenhouse was 22.4 ± 2.5°C, and daily cumulative outdoor solar radiation was 10.8 ± 6.2 MJ·m−2 (mean ± SD). The daily environmental conditions during the experimental period are summarized in Supplemental Figure S1.
Sampling and measurement
Plant growth characteristics were measured both non-destructively and destructively. The plants in the border rows and at both ends of the middle rows (final 1 m at both ends) were excluded from the study.
The node appearance rate was determined in 12 plants (two branches per plant). Leaves of main stems longer than 5 cm were assumed to be node appearances and the number of nodes on each plant was counted every week. According to Saito et al. (2020b), node appearance at n DAT (Nn) can be expressed in relation to daily mean temperature. Rate of node appearance (dNn/dt; nodes per plant per day) was calculated as
|
logedNndt=a×logeTn-b,
| Eq. 1 |
where T
n is the daily mean air temperature in the greenhouse, and a and b are coefficients obtained from the regression analysis. Mature fruits were harvested once or twice a week from 64 to 246 DAT and their fresh weights were measured; fruit dry matter content was measured in 88 randomly selected harvested fruits after drying at 105°C for 72 h.
For the destructive measurements, whole plants were sampled at 0, 15, 30, 49, 84, 118, 160, 184, 198, 212, and 246 DAT (n = 8 for each time point, except for 246 DAT where n = 12). To avoid the effects of sampling on the light condition on remaining plants, sampling was conducted from north to south, and the plants that were located adjacent to the sampled plants were excluded from the study. The sampled plants were divided into leaves (including petioles), stems, and fruits, and the leaf area and aboveground dry weight were determined. The belowground portion of the plant was discarded. Leaf area was measured by using an automatic leaf area meter (AAC-400; Hayashi Denko, Tokyo, Japan). The dry weights of the leaves, stems, and fruits were measured after drying at 105°C for 72 h. Pruned young branches and axillary buds were included in the measurement of leaf dry weight. The total aboveground dry matter production (TDM, g·m−2) of each plant was calculated as the sum of the dry weights of the leaves, stems, and fruit.
To measure fruit yield, harvested and immature fruits were measured separately. Fruit fresh weight yield (FFW, g·m−2) and fruit dry weight yield (FDW, g·m−2) were obtained as the sum of the immature fruit weight at each destructive sampling point and harvested fruit weight at that point. The FDW of harvested fruits was calculated by multiplying the FFW of harvested fruits by the dry matter content.
Light extinction coefficient and light interception
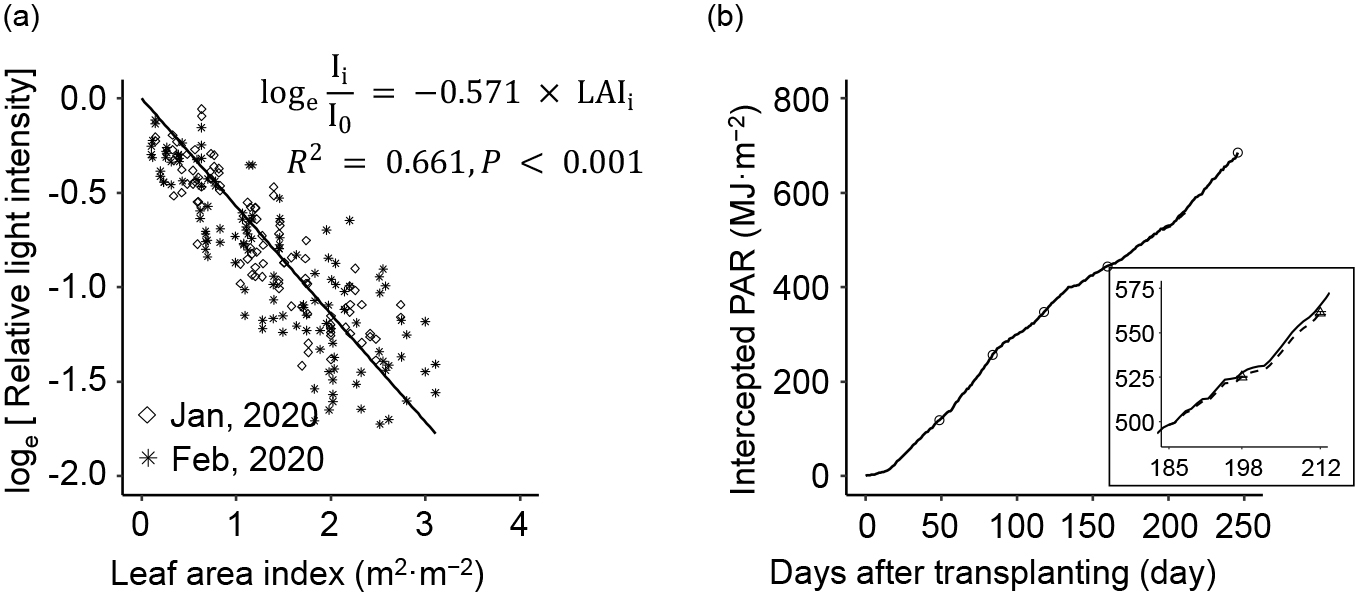
To obtain the light extinction coefficient, photosynthetic photon flux density (PPFD, μmol·m−2·s−1) and leaf area index (LAI, m2·m−2) values of the plant canopy were each measured as follows: PPFD at 196 DAT (22 January 2020) and 210–211 DAT (5–6 February 2020) and destructive measurement of LAI at 198 DAT and 212 DAT. Layers of different height within the plant canopy were established to examine the decrease in light intensity (four layers at 196 DAT and five layers at 210–211 DAT). The PPFD at each height was measured by using a line quantum sensor and light meter (LI-191R and LI-250A, respectively; LI-COR, NE, USA). PPFD outside the plant canopy was measured with a quantum sensor (LI-190R; LI-COR). Relative PPFD was calculated using the following equation (Monsi and Saeki, 2005 [1953]):
where I
i is the PPFD at a given point in the plant canopy, I
0 is the PPFD above the canopy, and LAI
i is the cumulative LAI at each point from the top of the canopy. The light extinction coefficient (k) was obtained from the slope of the linear regression analysis curve.
Daily cumulative photosynthetically active radiation (PAR, MJ·m−2) intercepted by each plant (INPn) was calculated as
|
INPn=(1-e-k·LAIn)×Srn×Tg×Rp,
| Eq. 3 |
where Sr
n (MJ·m
−2) is the daily cumulative outdoor solar radiation, T
g is the light transmittance of the greenhouse without plants (0.65 MJ·MJ
−1), and R
p is the ratio of PAR to solar radiation, which was assumed to be 0.5 MJ·MJ
−1 (
Ohtani, 1997). The daily LAI (LAI
n) of destructively sampled plants (n = 8 for each time point, except for 246 DAT where n = 12) were obtained by linear interpolation between the LAI of each plant and the mean LAI of the preceding destructive sampling.
Light use efficiency
As described by Saito et al. (2020b), daily light use efficiency (LUE, also called radiation use efficiency, g·MJ−1) is determined by the day-time mean CO2 concentration. To generate a CO2 response curve, the CO2 concentration in the greenhouse was maintained by application of liquid CO2 and recorded minute-by-minute by the Ubiquitous Environmental Controlling System. Target day-time CO2 levels of 85–118, 119–160, 185–198, and 199–212 DAT were set at 400, 800, 1600, and 1200 μmol·mol−1, respectively. Night-time CO2 concentrations were not controlled. The day-time mean CO2 levels are shown in Supplemental Figure S1c. Before the CO2 concentration was increased to 1600 μmol·mol−1 (i.e., on 184 DAT), leaves were pruned to make the number of leaves per plant uniform.
LUE was defined as dry matter production per cumulative INP and determined by using a conventional method (Higashide and Heuvelink, 2009). The LUE at each period of CO2 concentration (LUEpr) was calculated as
|
LUEpr=TDMend-TDMstartINPpr,
| Eq. 4 |
where TDM
end and TDM
start are the individual total dry matter production at the end of each CO
2 concentration period (n = 8) and the mean dry matter production at the start of the period, respectively, and INP
pr is the mean cumulative intercepted PAR in each period (n = 8). The CO
2 response curve was obtained by the logarithmic regression of LUE
pr as a function of day-time mean CO
2 concentration in each period. The equation was
|
LUEpr=c×loge[CO2]-d,
| Eq. 5 |
where c and d are coefficients obtained from the regression analysis and [CO
2] is the day-time mean CO
2 concentration. Then, daily LUE (LUE
n) was estimated by assigning the day-time mean CO
2 concentration for each day to the equation.
In the correlation analysis, LUE by the conventional method (LUEcv) was calculated as the slope of the linear regression of total dry matter production as a function of the cumulative intercepted PAR at each sampling point from transplantation through 246 DAT, as described by Higashide and Heuvelink (2009).
Gas exchange measurement of individual leaves
To compare individual leaf photosynthesis with the LUE in the plant community in response to the ambient CO2 concentration, the photosynthetic rate of individual leaves was measured at 225–245 DAT by using a portable gas analyzer system (LI-6800; LI-COR). The measurement was conducted between 10:00 and 13:00 using three randomly selected leaves of the eighth proximal node at anthesis. To generate an atmospheric CO2 response curve, leaves were first equilibrated at a CO2 concentration of 400 μmol·mol−1. Then, the CO2 concentration was gradually decreased to 200 and then gradually increased to 600, 800, 1200, and 1600 μmol·mol−1. Each measurement for each leaf at each CO2 concentration was carried out in triplicate at 1-min intervals. Other environmental conditions were set as follows: irradiance, 1000 μmol·m−2·s−1; leaf temperature, 30°C; and relative humidity, 70%.
Regression and correlation analyses among yield and its components
All regression analyses were performed by fitting linear equation models to the data set by using the R statistical software (v.4.0.3, <https://www.R-project.org/>). For node appearance rate and LUE, the data were log transformed. Pearson correlation matrices among yield, its components and growth characteristics were constructed from the three timeframes at 0–84 DAT (from summer to autumn), 85–160 DAT (until winter), and 161–246 DAT (until spring). The variables used in the correlation analyses were FFW, FDW, TDM, LAI, INP, LUE, fraction of dry matter distributed to fruit (FDF, g·g−1), average number of nodes on each plant (NNO, nodes per stem), number of fruits per plant (NFR, fruits per plant), and fruit set ratio (FSR, NFR per NNO) (n = 8 for each timeframe, except for at 246 DAT where n = 12). FFW, FDW, TDM, LAI, INP, NNO, and NFR were obtained as differences between the measured values at each time point and the mean values of preceding time points. LUE, FDF, and FSR were calculated as quotients of the differential values of TDM divided by INP, FDW divided by TDM, and NFR divided by doubled NNO (nodes per two main stems per plant), respectively. P-values for significance of the correlation coefficients were obtained by Student’s t-distribution (n = 8 for each timeframe, except for at 246 DAT where n = 12). The false discovery rate (FDR) was controlled for multiple testing; FDR-adjusted P-values ≤ 0.05 were considered statistically significant (Benjamini and Hochberg, 1995).
Results
Figure 1 shows the plant growth throughout the experimental period. At 246 DAT, LAI was 7.61 ± 0.58, TDM was 2249.2 ± 291.1 g·m−2, and FFW was 15,286.8 ± 2394.9 g·m−2 (mean ± SD, n = 8 plants, except for at 246 DAT where n = 12). The average dry matter content of fruit was 0.074 (n = 88), resulting in an estimated FDW of 1228.0 ± 192.3 g·m−2 (mean ± SD). Although TDM steadily increased during the experimental period, LAI plateaued at 118 DAT due to defoliation of senescent leaves.
The number of nodes after the first branching reached 44.9 ± 2.3 nodes at 246 DAT (mean ± SD, n = 12 plants, i.e., 24 stems; data not shown). The node appearance rate increased with increasing daily mean temperature, and the coefficient of determination (R2) of the regression curve was significantly different from zero (R2 = 0.422, P < 0.001, Fig. 2).
The light extinction coefficient was determined twice and was 0.562 at 196 DAT and 0.576 at 210–211 DAT (data not shown). There was no difference between the two slopes of the regression lines when an analysis of covariance (ANCOVA) was performed (P = 0.54, not significant). Therefore, the two data sets were combined and regressed as one (Fig. 3a), resulting in an overall light extinction coefficient of 0.571 (R2 = 0.661, P < 0.001). At 246 DAT, intercepted PAR, estimated by using the obtained light extinction coefficient, was 684.7 ± 0.6 MJ·m−2 (Fig. 3b). LUEcv determined for the whole experimental period was 3.29 ± 0.42 g·MJ−1.
The average day-time CO2 concentrations at 85–118, 119–160, 199–212, and 185–198 DAT (415, 786, 1197, and 1505 μmol·mol−1, respectively) were comparable with the target values (Fig. S1c). Obtained LUEpr values (mean ± SE) were 2.34 ± 0.38 g·MJ−1 (85–118 DAT), 3.82 ± 0.57 g·MJ−1 (119–160 DAT), 5.92 ± 0.97 g·MJ−1 (199–212 DAT), and 7.15 ± 2.27 g·MJ−1 (185–198 DAT). LUEpr was significantly correlated with day-time CO2 concentration in the greenhouse (R2 = 0.205, P < 0.01; Fig. 4). The average LUEn during the experiment was 3.16 g·MJ−1, as estimated by using Eq. 5. The average LUEn remained similar to the LUEpr throughout the experiment.

The photosynthetic rate of individual leaves at different atmospheric CO2 concentrations was determined (Fig. S2). At 400 μmol·mol−1 CO2 (tropospheric concentration), the average photosynthetic rate was 19.5 ± 2.7 μmol·m−2·s−1. The photosynthetic rate then increased with increasing atmospheric CO2 concentration until it plateaued at a CO2 concentration of 1200 μmol·mol−1 CO2 (around a photosynthetic rate of 40 μmol·m−2·s−1).
A comprehensive correlation analysis among the growth characteristics at 0–84, 85–160, and 161–246 DAT was performed (Fig. S3; n = 8 for each timeframe, except for at 161–246 DAT where n = 12). At all three timeframes, FFW was significantly correlated with TDM and LUEcv. Otherwise, correlation between FFW and characteristics except for the above varied depending on the timeframe. Using the data from the correlation analysis, we constructed a hierarchy of growth characteristics for sweet pepper as they relate to fruit yield (Fig. 5). Significant correlations were observed between FDW and TDM, TDM and LUE, TDM and INP, INP and LAI, and NFR and FSR at all three timeframes. FDW was significantly correlated with FDF at 0–84, but not at 85–160 and 161–246 DAT. There were no correlations between FDF and NFR, or between NFR and NNO, at any timeframe.
Discussion
In the present study, we examined the relationships between yield and various growth characteristics in greenhouse sweet pepper to determine the most important yield components and the relationship between dry matter production and yield. We found that several of the growth characteristics related to dry matter production were strongly correlated with one another. The correlation between TDM and LUEcv was notably strong (Fig. 5) and LUE was well correlated with FFW and FDW (Fig. S3). We also found that LUE was significantly improved by atmospheric CO2 enrichment (Fig. 4), which is consistent with previous findings in tomato (Higashide et al., 2015; Itoh et al., 2020; Saito et al., 2020b). Higashide and Heuvelink (2009) reported that the increase in Dutch tomato yield over the past 50 years has resulted from an increase in LUE due to breeding. Together, these findings suggest that improving LUE should be helpful in increasing sweet pepper yield in Japan. The FFW obtained in the present study was approximately 15.3 kg·m−2 (Fig. 1c), which is higher than the Japanese average (8.7 kg·m−2), but lower than the Dutch average (27 kg·m−2). By improving LUE via CO2 enrichment and/or choosing a high-LUE cultivar, we expect the fruit yield to be further improved.
In the present study, we obtained several findings that were similar, and some that were different, to the findings from previous studies in tomato and cucumber (Higashide et al., 2012a, b, 2015; Kaneko et al., 2015). Here, we found that TDM was significantly correlated with both LUE and INP (Fig. 5). This is consistent with studies in tomato that have reported that TDM was correlated with LUE in long-term experiments (Higashide and Heuvelink, 2009) and with INP in short-term experiments (Kaneko et al., 2015; Ohkubo et al., 2019). Similarly, in cucumber, TDM was reported to be correlated with INP during the early stage of growth and with LUE during the late stage of growth (Higashide et al., 2012a). This suggests that increases in LAI during the early stages of growth when LAI is relatively small have a marked influence on INP, and therefore TDM, whereas the opposite is true during later stages of growth. However, it should be noted that for long-term, but not short-term, experiments in tomato and cucumber, lowering is required. Sweet peppers cannot be lowered due to stem lignification; therefore, in the present study we ended the experiments when the plants reached the height of the training wire in the greenhouse. Also, in the present study, the plant canopy height and its spacial occupancy in the greenhouse did not reach the stationary state; therefore, TDM may have been affected by changes in INP caused by expansion of the canopy during growth.
The light extinction coefficient determined in the present study (k = 0.571; Fig. 3) was lower than that reported previously (0.7–0.9; Sarlikioti et al., 2011; Ta et al., 2011; Yildirim et al., 2017). Based on Eq. 2 with the present coefficient, when the LAI value exceeded 2.82, 80% of the light was intercepted. If the coefficient is assumed to be 1, 80% of the light was intercepted when the LAI was 1.61. In real-world tomato production, light extinction coefficients ranged around 0.7–1.0 and an LAI value of around 3 is usually maintained by leaf pruning to ensure sufficient light interception (Higashide et al., 2012b; Saito et al., 2020b). In the present study, LAI exceeded 3 and reached 6–8 in the latter half of the cultivation period (Fig. 1a). Even at higher LAI values than that of tomatoes, lower layer leaves may be able to intercept light efficiently due to the smaller light extinction coefficient than tomatoes. In sweet pepper, leaf longevity is more than 120 days; however, photosynthetic compensation for the decreased photosynthetic performance of old leaves remains elusive. A strong correlation between INP and TDM suggests that improving INP may also contribute to increase sweet pepper yield (Fig. 5). INP was narrowly distributed when the LAI values ranged around 6–8 (Fig. S4h, i); however, in sweet pepper production, leaf pruning is not appropriate due to the labor costs involved (Heuvelink and Kierkels, 2015). Thus, considering this point, INP may be difficult to adjust to improve the yield in sweet pepper.
In the present study, FDW was significantly correlated with FDF at 0–84 DAT (r = 0.84, P < 0.05; Figs. 5 and S3), but not at 85–160 and 161–246 DAT (r = −0.44 and 0.47, respectively). On the contrary, FDW was significantly correlated with NFR at 85–160 and 161–246 DAT (r = 0.93 and 0.87, P < 0.01, respectively), but not at 0–84 DAT (r = 0.44). At 0–84 DAT, FDW and NFR were narrowly distributed and FDF may have been well reflected in FDW (Fig. S5a, g). Subsequently, fruit drop occurred frequently and NFR contributed more to FDW at 85–160 and 161–246 DAT (Fig. S5h, i). These results suggest the occurrence of a cyclic fluctuation in yield known as “flush” (Heuvelink and Körner, 2001). This fluctuation in yield is caused by physiological fruit drop and may be a characteristic that often occurs in sweet pepper production (Marcelis and Baan Hofman-Eijer, 1997). The effect of fruit load by fruit setting may be a primary concern (Heuvelink et al., 2004; Wubs et al., 2009a, b; Ma et al., 2011). Although phytohormones, auxins and gibberellins, are known to improve fruit setting in sweet pepper (Wien and Zhang, 1991; Tiwari et al., 2012; Das et al., 2015; Kaur et al., 2017), the factors involved in fruit abscission are poorly understood.
In the present study, we determined the relationships among growth characteristics. A previous study in tomato (Saito et al., 2020a) showed that it is possible to use these relationships to predict yield by using non-destructive measurements and climate data. Similar to the study by Saito et al. (2020a), we modeled plant growth in sweet pepper as a function of environmental factors (Eqs. 1, 3, and 5). In tomato, Saito et al. (2020b) proposed a procedure to estimate the total leaf area per plant based on the individual leaf position. In sweet pepper, node appearance determines the numbers of fruit and leaves per plant. Therefore, we modeled node appearance rate as a function of daily air temperature (Eq. 1; Fig. 2) and succeeded in accurately estimating the number of nodes. However, the number of leaves in sweet pepper depends on the pruning strategy used on the stem, because dichotomous branching occurs at each sympodial meristem. Thus, to estimate the leaf area of sweet peppers with different leaf pruning regimens, we need to investigate the details further.
We also modeled LUE as a function of daytime CO2 concentration (Eq. 5). The LUEpr obtained at 400 μmol·mol−1 CO2 (2.34 g·MJ−1; Fig. 4) was close to a previously reported value (2.20 g·MJ−1; Karam et al., 2009). CO2 responsivity in the LUE was saturated at high CO2 concentrations, and a similar saturated tendency was seen in an individual leaf photosynthetic curve at a CO2 concentration of more than 1200 μmol·mol−1 (Fig. S2). Many models that estimate LUE response curves have been proposed in cereal crops (Vanuytrecht and Thorburn, 2017). Our study suggests that similar models can be used to estimate LUE in sweet pepper.
In conclusion, we confirmed that fruit yield in sweet pepper was highly correlated with growth characteristics related to dry matter production and that the relationship between fruit yield and dry matter partitioning varied depending on the stage of plant growth. The strongest correlation was observed between TDM and LUEcv, suggesting that to improve fruit yield in Japan, we should first focus on improving LUE. We also successfully constructed models to estimate the node appearance rate, INP, and daily LUE as functions of temperature, LAI, and CO2 concentration, respectively. These models will be useful to predict sweet pepper yield under different environmental conditions.


