原著論文
Developing a Growth Model to Predict Dry Matter Production in Broccoli (Brassica oleracea L. var. italica) ‘Ohayou’
2023 年 92 巻 1 号 p. 77-87

詳細
2023 年 92 巻 1 号 p. 77-87
The demand for broccoli (Brassica oleracea L. var. italica) is increasing for use as fresh produce and for use in the processing industry. Therefore, growth prediction technology is required for its stable production. In this study, several cultivations of experiments were conducted to clarify the critical characteristics of the parameters needed to predict the growth of broccoli in a dry matter production model. The extinction coefficient was determined based on the leaf area index and intercepted solar radiation rate. Radiation-use efficiency was demonstrated using a linear function of the accumulated solar radiation intercepted amount and the total dry weight above-ground. The distribution of dry matter to the head and stem was indicated by the sigmoid function of the accumulated average temperature. The dry matter percentage of the leaf, dry matter percentage of the head and stem, and the ratio of leaf area to the fresh weight of the leaf were represented by a power function with dry weight above-ground. The fresh weight above-ground (R2 = 0.92) and the fresh weight of the head and stem (R2 = 0.98) were highly correlated with the estimated and observed values. Verification was performed using the developed growth model. As a result, the error between the harvest date and the predicted harvest date could be forecasted to within 4 days and the error in the fresh weight of the head could be predicted with an accuracy of −0.3 ~ +7.7 g·plant−1.
In open-field vegetable cultivation, plant growth and yield are greatly influenced by external and abiotic stresses. Shifts in the weather can quickly result in premature or delayed growth, consequently fluctuating the yield. Additionally, when such events occur, field disposal is commonly experienced because the harvest is unable to meet the demands of overproduction together with labor shortages. All open-field producers face the issue of fluctuating market prices in response to unstable supplies. To address this issue, it is necessary to quantitatively evaluate the environmental influence on growth at the time of cultivation. This will allow producers to understand the growth situation for the season better and adjust the expected yield and shipment requirements based on these predictions. Presently, the growth prediction model used at production sites is a calendar day model based on previous cultivation cases. To construct a more accurate and adaptable growth model, it is essential to quantitatively incorporate the relationship between environmental conditions and growth.
While the acreage and yield of primary open-field vegetables have been steadily declining in recent years, broccoli (Brassica oleracea L. var. italica) has been garnering attention in response to its high nutritional value. Furthermore, both the acreage and broccoli yield has doubled in the past 20 years (MAFF, 2021 <https://www.maff.go.jp/j/tokei/kouhyou/sakumotu/sakkyou_yasai/index.html>). The proportion of broccoli for use in the processing industry, which requires regular and fixed-quantity transactions, is similarly increasing (Takahashi et al., 2021). For these reasons, broccoli production among open-field vegetables requires growth prediction.
To date, predictions for broccoli growth have primarily relied on accumulated temperature models according to seed sowing and seedling transplanting stage through to head initiation (Fellows et al., 1997; Grevsen, 2000; Grevsen and Olesen, 1999; Lindemann-Zutz et al., 2016a, b; Mourão and Brito, 2000; Tan et al., 2000a). Another model incorporated temperature and solar radiation, predicting head growth from the initiation to the harvest stage (Tan et al., 2000a, b; Wurr et al., 1995). Based on these models, a combination of them has been used to predict the expected harvest date (Cammarano et al., 2020; Lindemann-Zutz et al., 2016b; Mourão and Brito, 2000; Tan et al., 2000a; Wurr et al., 1995).
On the other hand, a model (Monteith, 1977) used to estimate dry matter production has helped predict growth in spinach (Kamada et al., 2021), cabbage (Okada and Sasaki, 2016), tomato (Saito et al., 2020), sweet potato (Sumi and Koriyama, 2013), and radish (Takada et al., 2020). This particular model estimates dry matter production by dividing it into the amount of solar radiation shielded by the community and the amount of dry matter produced per amount of solar radiation-shielded. If this model can be applied to broccoli for the simulation of growth and dry matter production in various environments, it may help to improve the profitability and stabilize domestic supply by reducing the disposal rate of the production area.
Dry matter production is typically determined by the amount of light blocked by the plant and the light-use efficiency (Higashide, 2018). The amount of intercepted solar radiation is determined by the amount of solar radiation received by the leaf area index (LAI) and the light extinction coefficient in the plant canopy. Based on the observed models, in this study, a broccoli growth model was created that simulates growth amounts based on meteorological information, including the amount of solar radiation (Fig. 1).
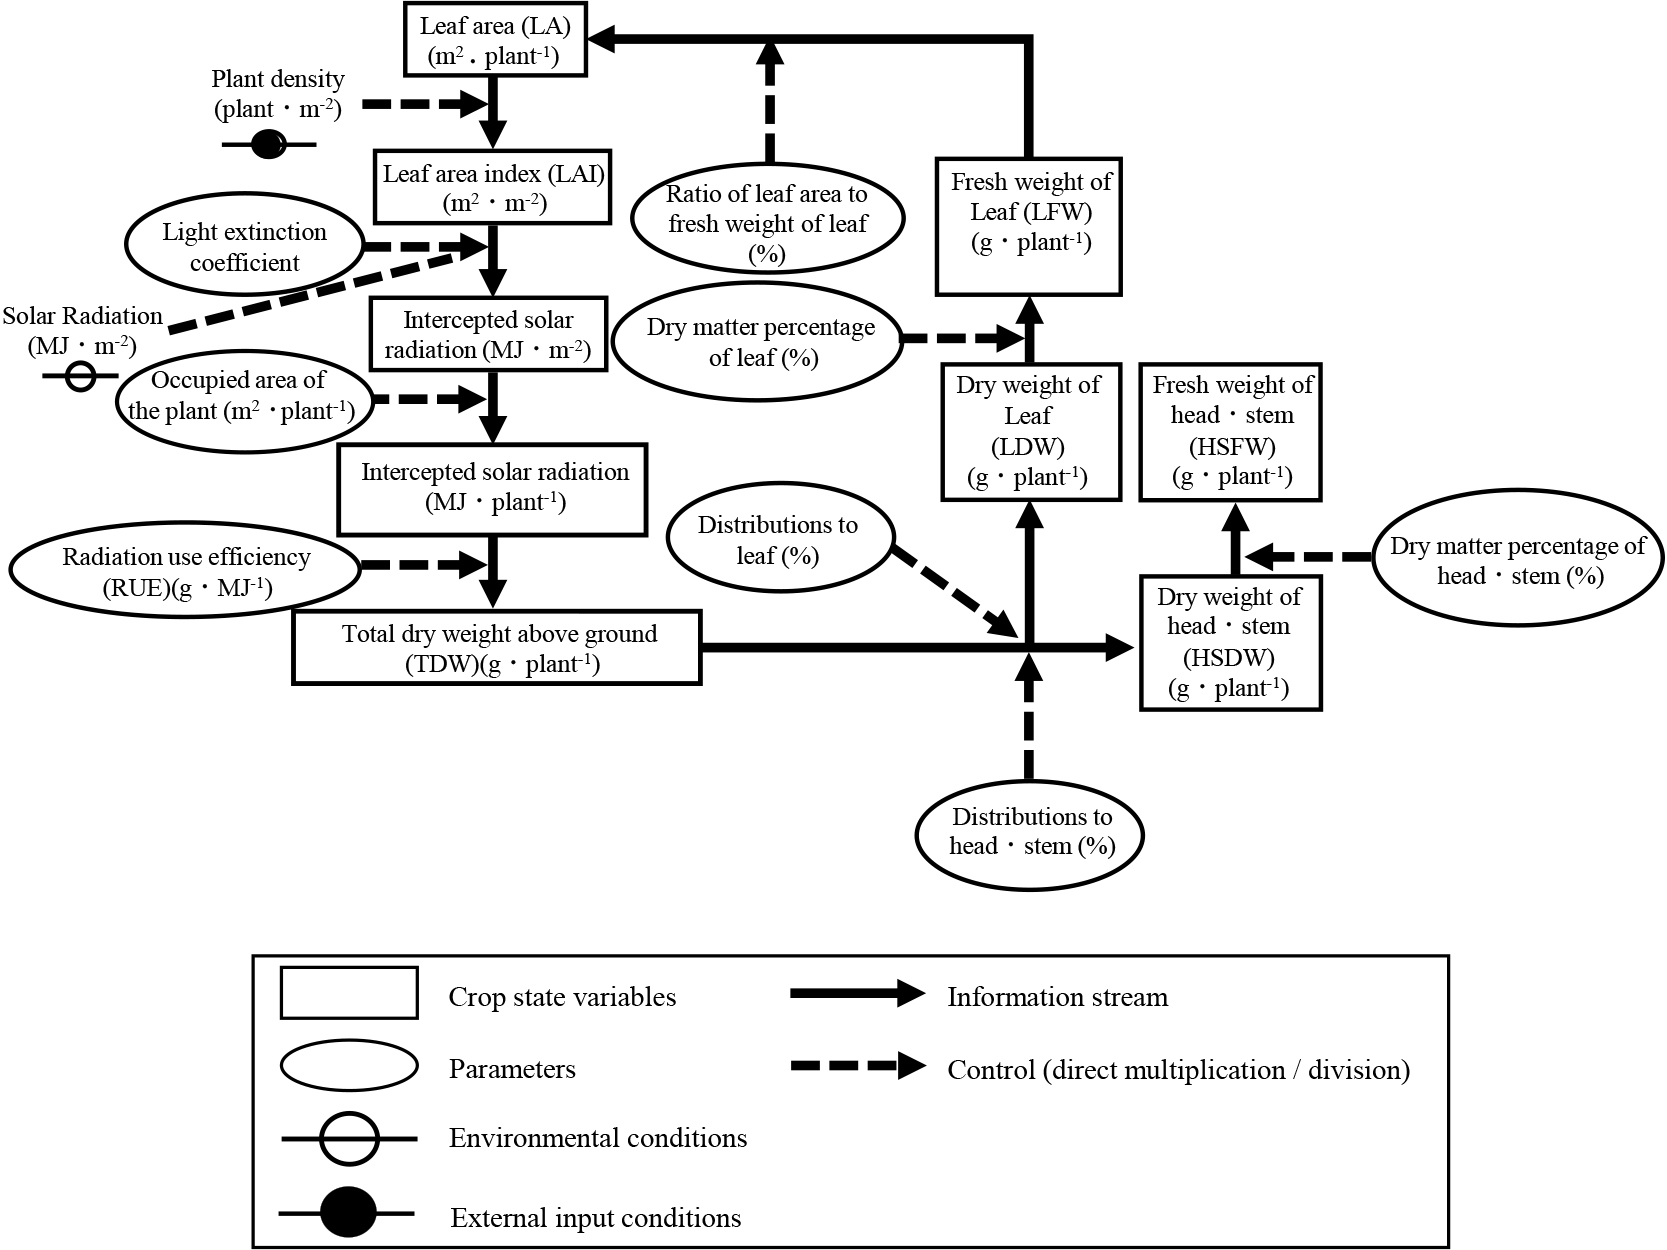
Schematic of the dry matter production model used for broccoli.
The following six parameters were designed for the model: 1) extinction coefficient (K); 2) radiation-use efficiency (RUE, g·MJ−1); 3) distribution of dry matter to the head and stem (DDHS, %); 4) dry matter percentage of the leaf (%); 5) dry matter percentage of the head and stem (%), and 6) ratio of leaf area to the fresh weight of leaf (LALFW, cm2·g−1).
In this study, to predict the growth of broccoli using a dry matter production model, the characteristics of the parameters were defined together with observed changes in any of the parameters that accompany growth in the two standard cropping seasons in the Kanto Plain, namely, spring-sown early-summer-harvested (spring cropping), and summer-sown autumn/winter-harvested (autumn cropping). Since actual cultivation is cultivated at various plant densities, the effect of halving the plant density from standard in situ cultivation was also investigated. The accuracy of predicting the fresh weight above-ground and the head weight of broccoli using the growth model was verified using the defined and obtained parameters in this study.
Experiments were conducted in a field based at the Institute of Vegetable and Floriculture Science of the National Agriculture and Food Research Organization (NARO), in Kannondai, Tsukuba City, Ibaraki Prefecture, Japan (36°01' N, 140°06' E). The weather conditions for each year of the study are shown in Table 1. The broccoli (Brassica oleracea L. var. italica) cultivar ‘Ohayou’ (Sakata Seed Corporation, Yokohama, Japan) was used as the test cultivar. Seeds were sown in cell trays (25 ml × 128 cells) filled with compost (N:P2O5:K2O = 50:500:100 mg·L−1) (NAPLA type S, YANMAR Co., Ltd., Osaka, Japan) on February 22, 2019, and February 15, 2021, for spring cropping, and on August 1, 2019, and August 3, 2020, for autumn cropping. The seedlings were grown in a greenhouse. For the spring cropping, the temperature was controlled through heating so that the minimum temperature did not fall below 10°C. From the second week after sowing, the seedlings were fertilized with liquid fertilizer, OK-F-9 (N:P2O5:K2O = 300:300:300 mg) (OATAgrio Co., Ltd., Tokyo, Japan), per cell tray. For the spring cropping, the seedlings were transplanted on April 5, 2019, and March 30, 2021, and for the autumn cropping on August 26, 2019, and September 3, 2020.
Weather conditions during the experiment.
For transplanting, seedlings with two or three true leaves were used. There were two treatments, the control (60 cm between rows and 35 cm between plants, plant density 4,761 plants per 10a) and low-density (60 cm between rows and 70 cm between plants, plant density 2,380 plants per 10a). The field was fertilized with N:P2O5:K2O = 35:35:35 kg/10 a and carbonated magnesium lime = 100 kg/10a.
Investigation of growthDuring each cropping season, 4–9 plants that showed no extreme poor growth were sampled between the growing and harvesting seasons. This took place between four and seven times per cropping season. The fresh weight, dry matter weight, and leaf area of parts above-ground (leaves, stems, and heads) were measured. Leaf area (including leaf stalk) was measured using an open-source image analysis platform ImageJ Fiji (Schindelin et al., 2012). For each investigation, four plants were tested for spring 2019, eight plants for autumn 2019, and nine plants each for autumn 2020 and spring 2021. The data for the two years of the spring and autumn cropping were integrated according to the treatments to form one dataset.
Parameter calculation Extinction coefficientFurthermore, light intensity outside the canopy was measured with a photon sensor (LI-190, Li-Cor, Lincoln, NE, USA) to calculate the extinction coefficient. The light intensity of the horizontal plane of each plant was measured using a long photon sensor (LI-191, Li-Cor) at six points per plant. A total of four plants were measured for spring 2019, eight plants for autumn 2019, and nine plants each for autumn 2020 and spring 2021. The light intensity was measured 4–6 times per cropping period between the growing and harvesting seasons. That is, spring 2019 was investigated four times, while autumn 2019, autumn 2020, and spring 2021 were investigated six times. The leaf area index (LAI, m2·m−2) is the value obtained by dividing the leaf area per plant by the area occupied by the plant (m2). Equation (1) holds from Lambert–Beer’s law, Monsi and Saeki (1953):
I/I0 = (1 − e−K·LAI) × 100 (1)
I: light intensity reaching each strain, I0: light intensity outside the community, K: extinction coefficient, e: base of the natural logarithm, and LAI: leaf area index. The K value for each treatment was set to the minimum value of the sum of squared errors between the simulated value of intercepted solar radiation amount starting from the transplanting date of each treatment using the solver function (GRG nonlinear option) of Microsoft Excel and the measured value of the intercepted solar radiation at each growth investigation.
Radiation-use efficiency (RUE)In this study, RUE (g·MJ−1) is the amount of dry matter production per amount of intercepted solar radiation. It is calculated by dividing the total dry weight above-ground for a day (TDW: g·m−2·day−1) by the daily accumulated intercepted solar radiation received by the plant in a day during the same period (DIR, MJ·m−2·day−1).
RUE = TDW/DIR (2)
DIR is the product of the total solar radiation (MJ·day−1) and the intercepted solar radiation for each day.
DIR = S × (1−e−K·LAI) (3)
However, S: the solar radiation on each day (MJ·m−2·day−1), and 1−e−K·LAI: the intercepted solar radiation. For the leaf area other than the investigated day, the value obtained by dividing the difference in leaf area between two consecutive investigations by the accumulated temperature during the period was used as the amount of increase in leaf area per 1°C. It was supplemented by multiplying by the daily average temperature. For RUE throughout the investigated period of each dataset, a scatter plot was created by plotting the accumulated intercepted solar radiation per field area on the horizontal axis and the TDW at that time on the vertical axis for each cropping season and plant density. Moreover, a linear regression line was created from this figure for each cropping season and plant density; when this regression line was statistically significant (P < 0.05), the slope of the straight line was RUE (g·MJ−1).
Distribution of dry matter to the head and stem (DDHS)The distribution of dry matter to the head and stem (DDHS: %) used when estimating the dry weight of the head and stem (HSDW: g) from the dry weight above-ground (TDW: g) was calculated using the following equation:
DDHS = HSDW/TDW × 100 (4)
The relationship between DDHS and the average accumulated temperature was examined between two consecutive investigations (n−1, n) and TDW.
Dry matter percentageThe dry matter percentage of the leaf (DPL: %) used when estimating the fresh weight of leaf (LFW: g) from the dry weight of leaf (LDW: g) was calculated using the following equation:
DPL = LFW/LDW × 100 (5)
The relationship between DPL, accumulated temperature, and dry weight of above-ground. The dry matter percentage of the head and stem (DPHS: %) used when estimating the fresh weight of the head and stem (HSFW: g) from the dry weight of the head and stem (HSDW: g) was calculated using the following equation:
DPHS = HSFW/HSDW × 100 (6)
The relationship between DPHS, the accumulated temperature, and TDW was also examined.
Ratio of leaf area to the fresh weight of leaf (LALFW)The ratio of leaf area to the fresh weight of leaf (LALFW: %) used when estimating the leaf area (LA: m2) from LFW was calculated by dividing LA by LFW.
LALFW = LA/LFW × 100 (7)
The relationship between LALFW, the accumulated temperature, and TDW was also examined.
Accuracy verification of the growth modelTo create and verify a model from the results obtained so far (Fig. 1), ‘Ohayou’ was cultivated in a field of the NARO in Yawara, Tsukubamirai City, Ibaraki Prefecture, Japan (36°00' N, 140°04' E). Seeds were sown on February 15 and March 5, 2021, for spring cropping, and on July 16 and August 16, 2021, for autumn cropping. Spring cropping was transplanted on March 30 and April 15, 2021, with autumn cropping transplanted on August 20 and September 15, 2021. The seedlings were cultivated with 60 cm between rows and 40 cm between plants (plant density 4,167 plants per 10a). The cultivation method and fertilizer management were carried out as described above. During the cropping season, six plants that were not extremely poor in growth were sampled between the growing and harvesting seasons. This was done six times per cropping season. The fresh weight of the parts above-ground (leaves, stems, and heads) was taken and dry weight above-ground and LA were measured. The simulation was performed using the dry weight above-ground obtained in the first sampling after transplanting as the initial value. The coefficient of determination of the estimated value and the measured value was calculated and verified by the model.
Collection of solar radiation and temperature dataThe meteorological data during the cultivation period were acquired using the Agro-Meteorological Grid Square Data, NARO (Ohno et al., 2016) (https://amu.rd.naro.go.jp/).
Impact of typhoonTwo typhoons hit the experimental field of the autumn cropping—typhoon #15 (Faxai) on September 9 and typhoon #19 (Hagibis) on October 12, 2019—with minimal damage to the seedlings in the control field. In contrast, the damage to seedlings in the low-density field was severe, resulting in the production of damaged plants.
The relationship between the intercepted solar radiation rate and the LAI at each investigated period is shown (Fig. 2). The solar radiation rate increased exponentially with the increase in LAI. Comparing the extinction coefficients by the 95% confidence interval, no significant difference was found regardless of the difference in cropping season and plant density. Therefore, the extinction coefficient K = 0.99 was obtained when the average extinction coefficient, including the entire dataset, was calculated.
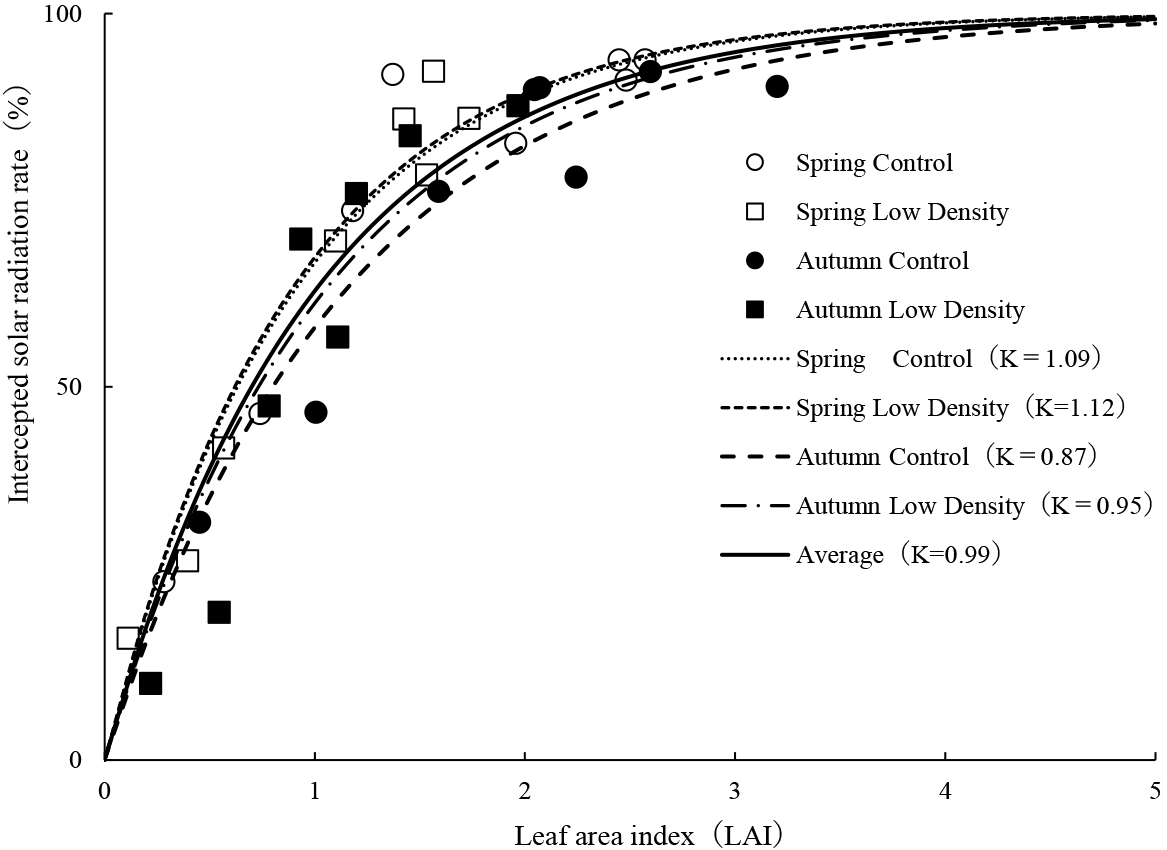
Relationship between the intercepted solar radiation rate and leaf area index (LAI) in the broccoli cultivar ‘Ohayou’ grown with different plant densities and across different cropping seasons. Spring Control: y = (1−e−1.09·x)·100 (R2 = 0.69), Spring Low-density: y = (1−e−1.12·x)·100 (R2 = 0.68), Autumn Control: y = (1−e−0.87·x)·100 (R2 = 0.77), Autumn Low-density: y = (1−e−0.95·x)·100 (R2 = 0.74) Average: y = (1−e−0.99·x)·100 (R2 = 0.73).
The relationship between the accumulated solar radiation intercepted during each investigated period and TDW is shown (Fig. 3). Regardless of the cropping season and plant density, a significant correlation was observed between the accumulated solar radiation intercepted and TDW. A significant regression line was obtained. Autumn low-density was significantly lower than the other treatments when compared with the 95% confidence interval. Two typhoons hit the experimental field of the autumn cropping and damage to the seedlings in the low-density field was severe, resulting in the production of damaged plants. The average RUE was 1.16 (R2 = 0.99) when the average RUE was calculated from the accumulated solar radiation intercepted and TDW included in all treatments.

Relationship between the total dry weight above-ground and accumulated solar radiation intercepted in the broccoli cultivar ‘Ohayou’ grown with different plant densities and across different cropping seasons. RUE (R2 value, 95% confidence intervals): Spring Control 1.16 (R2 = 0.98, 1.04–1.27), Spring Low-density 1.21 (R2 = 0.99, 1.15–1.26), Autumn Control 1.25 (R2 = 0.99, 1.16–1.32), Autumn Low-density 1.03 (R2 = 0.99, 0.96–1.10), Average 1.16 (R2 = 0.99). z Different letters indicate significant differences with the 95% confidence interval.
The relationship between DDHS (%) and the accumulated average temperature is shown (Fig. 4). The distribution of dry matter to the head and stem tended to increase from ~700°C in spring cropping and from ~1,000°C in autumn cropping to the sigmoid type concerning the accumulated average temperature.

Relationship between the distribution of dry matter to the head and stem (%) and accumulated average temperature in the broccoli cultivar ‘Ohayou’ grown with different plant densities across different cropping seasons. Relationship between the distribution of dry matter to the head and stem and accumulated temperature. The accumulated average temperature was calculated by averaging the accumulated temperature between two consecutive investigations (n−1, n). Spring Control: y = 6.23+93.57/(1 + exp(1125.58/151.26 − Accumulated average temperature/151.26)) (R2 = 0.70), Spring Low-density: y = 7.85+92.15/(1 + exp(1180.5/164.36 − Accumulated average temperature/146.56)) (R2 = 0.73), Autumn Control: y = 7.48+92.52/(1 + exp(1370.09/130.46 − Accumulated average temperature/130.46)) (R2 = 0.63), Autumn low-density: y = 7.12+92.87/(1 + exp(1450.98/166.74 − Accumulated average temperature/166.74)) (R2 = 0.66).
The relationship between DPL and the accumulated temperature and dry weight above-ground is illustrated (Fig. 5). The DPL reached its maximum at the time of transplanting regardless of the relationship between the accumulated temperature and the dry weight above-ground and decreased exponentially as these values increased. Comparing DPL by the 95% confidence interval, the spring cropping was significantly smaller than the autumn cropping. No significant difference was observed between the plant densities. Therefore, DPL was calculated based on all treatments. It was the average y = 43.24x−0.21 (R2 = 0.72) in relation to the accumulated temperature. It was the average y = 16.15x−0.12 (R2 = 0.79) in relation to the dry weight above-ground. The coefficient of determination tended to be more related to the dry weight above-ground than the accumulated temperature.
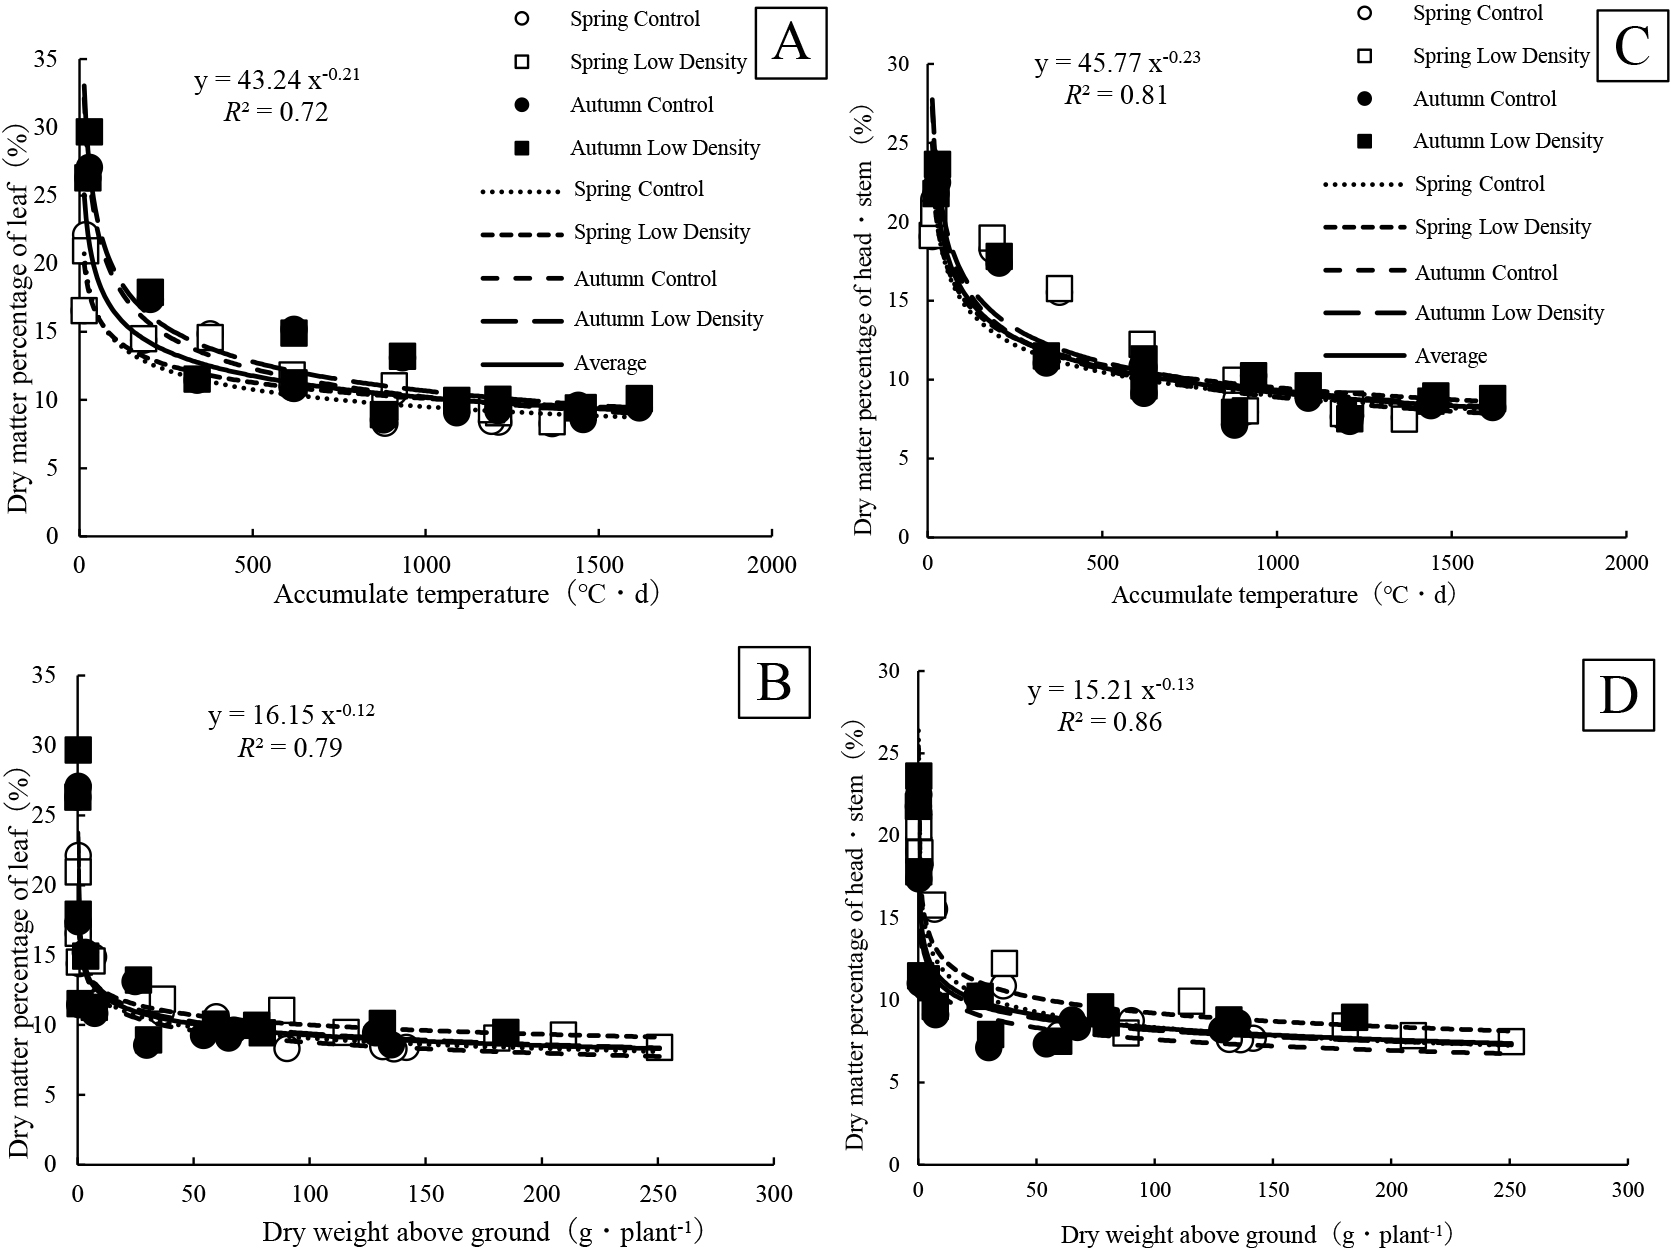
Relationship between dry matter percentage of leaf (%), dry matter percentage of the head and stem (%), accumulated temperature and dry weight above-ground in the broccoli cultivar ‘Ohayou’ grown with different densities across different cropping seasons. A: Relationship between dry matter percentage of the leaf (%) and accumulated temperature. Spring Control: y = 33.22x−0.18 (R2 = 0.79), Spring Low-density: y = 30.21x−0.16 (R2 = 0.81), Autumn Control: y = 64.18x−0.27 (R2 = 0.93), Autumn Low-density: y = 65.49x−0.26 (R2 = 0.92), Average: y = 43.24x−0.21 (R2 = 0.72). B: Relationship between dry matter percentage of the leaf (%) and dry weight above-ground. Spring Control: y = 15.84x−0.12 (R2 = 0.83), Spring Low-density: y = 15.78x−0.10 (R2 = 0.86), Autumn Control: y = 16.10x−0.13 (R2 = 0.82), Autumn Low-density: y = 16.68x−0.13 (R2 = 0.79), Average: y = 16.15x−0.12 (R2 = 0.79). C: Relationship between dry matter percentage of the head and stem (%) and accumulated temperature. Spring Control: y = 41.44x−0.22 (R2 = 0.77), Spring Low-density: y = 39.20x−0.21 (R2 = 0.73) Autumn Control: y = 53.65x−0.26 (R2 = 0.92), Autumn Low-density: y = 53.64x−0.25 (R2 = 0.92), Average: y = 45.77x−0.23 (R2 = 0.81). D: Relationship between dry matter percentage of the head and stem (%) and dry weight above-ground. Spring Control: y = 17.03x−0.15 (R2 = 0.93), Spring Low-density: y = 17.28x−0.14 (R2 = 0.93) Autumn Control: y = 13.89x−0.13 (R2 = 0.88), Autumn Low-density: y = 14.44x−0.12 (R2 = 0.87), Average: y = 15.21x−0.13 (R2 = 0.86).
The relationship between DPHS and the accumulated temperature (Fig. 5C) and dry weight above-ground (Fig. 5D) is also shown. The accumulated temperature and the dry weight above-ground indicated the same relationship as DPL. Comparing DPHS by the 95% confidence interval, no significant difference was observed regardless of the difference in cropping season and plant density. The average y = 45.77x−0.12 (R2 = 0.81) was obtained for the dry matter percentage of head and stem and the accumulated temperature, and the average y = 15.21x−0.13 (R2 = 0.86) was obtained for the dry matter weight above-ground. The coefficient of determination also showed the same relationship as DPL.
Ratio of leaf area to fresh weight of leaf (LALFW)The relationship between LALFW and accumulated temperature and dry weight above-ground is illustrated (Fig. 6). LALFW was its maximum at the time of transplanting regardless of the relationship between the accumulated temperature and the dry weight above-ground and decreased exponentially as these values increased. Comparing the ratio of leaf area to fresh weight of leaf by the 95% confidence interval, no significant difference was observed regardless of the difference in cropping season and plant density. The average y = 69.14 x−0.29 (R2 = 0.68) was obtained for LALFW and the accumulated temperature, and the average y = 18.17x−0.19 (R2 = 0.92) was obtained for the dry matter weight above-ground. The coefficient of determination tended to be more related to the dry weight above-ground than the accumulated temperature.

Relationship between the ratio of leaf area to the fresh weight of leaf, accumulated temperature, and dry weight above-ground in the broccoli cultivar ‘Ohayou’ grown with different densities across different cropping seasons. A: Spring Control: y = 56.42x−0.29 (R2 = 0.83), Spring Low-density: y = 52.1x−0.28 (R2 = 0.83), Autumn Control: y = 95.37x−0.32 (R2 = 0.76), Autumn Low-density: y = 108.63x−0.34 (R2 = 0.81), Average: y = 69.14x−0.29 (R2 = 0.68). B: Spring Control: y = 16.74x−0.20 (R2 = 0.89), Spring Low-density: y = 16.29x−0.18 (R2 = 0.86), Autumn Control: y = 18.90x−0.18 (R2 = 0.94), Autumn Low-density: y = 19.72x−0.19 (R2 = 0.97), Average: y = 18.17x−0.19 (R2 = 0.92).
The relationship between the estimated and measured values of the fresh weight above-ground (Fig. 7A) and the fresh weight of the head and stem (Fig. 7B) by the dry matter production model of broccoli using the obtained parameters are shown (Fig. 1). The coefficient of determination and RMSE (Root Mean Squared Error) were fresh weight above-ground (R2 = 0.92, RMSE = 149.64) and fresh weight of the head and stem (R2 = 0.98, RMSE = 44.16), respectively. They showed a high correlation between the estimated value and the measured value. The error between the harvest date and the predicted harvest date could be forecasted to within 4 days, and the error in the fresh weight of the head could be predicted with an accuracy of −0.3~+7.7 g·plant−1 (Table 2).

Relationship between observed and predicted weights in the broccoli cultivar ‘Ohayou’ grown through different cultivation periods. A: Fresh weight above-ground, B: Fresh weight of the head and stem.

Comparison of broccoli observed values and simulation values using the meteorological data of Yawara.
In this study, the characteristics of the parameters used in the dry matter production model for predicting broccoli growth were clarified to verify the prediction accuracy of the model.
The results from this study showed no significant difference between the cropping season and the plant density (Fig. 2), meaning the extinction coefficient was calculated as the average extinction coefficient (K = 0.99). The extinction coefficient (K = 0.99) calculated in this study is consistent with the report that the extinction coefficient of crop communities with broad leaves and horizontally arranged leaves is in the range of 0.7–1.2 (Nakaseko, 1985). On the other hand, Francescangeli et al. (2006) obtained y = 1.7459e−0.2981x (R2 = 0.95) (y: extinction coefficient, x: plant density) by the relationship between the extinction coefficient and plant density. Substituting the plant densities in this study into this equation gave the extinction coefficients K = 0.42 and K = 0.86, respectively. The extinction coefficient K = 0.99 obtained in this study was larger than the extinction coefficient obtained through the formula of Francescangeli et al. (2006). The maximum leaf area of ‘Legacy’ used by Francescangeli et al. (2006) was 4,805 cm2 and the maximum head weight was 181.6 g. In contrast, the maximum leaf area of ‘Ohayou’ in this study was 8,261 cm2, and the maximum head weight was 1,538 g. We concluded that this is because ‘Ohayou’ had larger leaf areas and heads than ‘Legacy’ used by Francescangeli et al. (2006). There was no significant difference in the amount of light received due to the difference in plant density, in the extinction coefficient, and during the cropping period, the extinction coefficient may not be affected by temperature throughout the growth. Our results show that the constant extinction coefficient can be used for any plant density and for the cropping season in Japan. This finding is useful for actual cultivation at various plant densities and seasons.
Many crops have shown a high correlation between accumulated solar radiation intercepted and TDW (Kamada et al., 2021; Okada and Sasaki, 2016; Sumi and Koriyama, 2013; Takada et al., 2020), with similar results obtained in this study (Fig. 3). RUE in autumn low-density was significantly the lowest of all treatments. Two typhoons hit the experimental field of the autumn cropping with minimal damage to the seedlings in the control field. In contrast, the damage to the seedlings in the low-density field was severe, resulting in the production of damaged and yellow leaves. In this way, we should consider RUE need not change due to plant density in an unforeseen environment, but under general cultivation conditions.
Lindemann-Zutz et al. (2016a) reported that the formation of broccoli flower buds started at the accumulated temperature of 400°C when the average temperature was ~13°C and started at an accumulated temperature of 1,100°C when the average temperature was ~20°C. In our study, DPHS increased sharply to ~700°C in spring cropping and ~1,000°C in autumn cropping (Fig. 4). These turning points in the distribution of dry matter to the head and stem are the phase transition period when the growth stage of broccoli ‘Ohayou’ changes from vegetative growth to reproductive growth. Therefore, the distribution of dry matter to the head and stem increased sharply because the formation of flower buds was completed, and the head began to enlarge. Moreover, the distribution of dry matter to the head and stem based on the accumulated average temperature started to increase earlier in the spring cropping than in autumn cropping (Fig. 4). In spring crops, where cultivation begins in the low-temperature period, the temperature and the amount of solar radiation gradually increased. The amount of light received by the plants also increased (Table 1). Therefore, to promote growth, the growth stage changed at an early stage.
On the other hand, in autumn cropping, the high temperature at the time of transplanting took a long time to take root, meaning the temperature and the amount of solar radiation gradually decreased (Table 1). As the amount of light received by the plant decreased, the growth also decreased, and it took time for the growth stage to change, and the time to start increasing the distribution of dry matter to the head and stem was delayed. Our results suggest that we should set the DDHS for each cropping season.
In the relationship between the dry matter percentage and the accumulated temperature, there was a significant difference in the leaf during the cropping season, with no significant difference in the plant density (Fig. 5A). In fact, the temperature during the growing season gradually rises in spring cropping (Table 1). The accumulated temperature from transplanting to harvest is smaller than in autumn cropping. However, in the relationship between DPHS and TDW, there was no significant difference between the cropping season and the plant density (Fig. 5B, D). On the other hand, the relationship between DPL or DPHS and TDW was not affected by the cropping season or plant density. From these results, we adopt the parameter of DPL and DPHS expressed with TDW.
LALFW was at the maximum at the transplanting time (Fig. 6). As the growth progressed, the leaves became thicker and LALFW decreased. There was no significant difference in the ratio of LALFW between cropping type and plant density. In other words, although LALFW showed morphological changes depending on the influence of the growing environment due to different cropping seasons and planting densities, LALFW did not change quantitatively. The coefficient of determination tended to be higher in the relationship between LALFW and TDW than between LALFW and the accumulated temperature. In this model, we conclude that LALFW can be expressed by one parameter setting with dry weight above-ground regardless of the cultivation condition.
In this study, we clarified the characteristics of the parameters used in the dry matter production model of broccoli and predicted their growth. The error between the harvest date and the predicted harvest date could be predicted within an accuracy of four days (Table 2). The results of this research make it possible to predict the broccoli yield from meteorological data such as the temperature and amount of solar radiation. The broccoli heads can be harvested since they keep their qualities suitable for commerce. This growth prediction model can be expected to be used for practical purposes such as improving the profits of producers by reducing field waste and increasing the efficient operation of harvesters. ‘Ohayou’ is used nationwide in both summer cropping and winter cropping (ALIC, 2019 <https://www.alic.go.jp/content/001162830.pdf>). If the temperature and the amount of solar radiation are corrected to the values of the cultivated area, it may be applied immediately, but verification is required. ‘Ohayou’ is an early-maturing cultivar, and if it is the same as ‘Pixel’ and ‘SK9-099’, the same parameters as those in this experiment may be available.
In contrast, middle-maturing and late-maturing cultivars have a more extended cultivation period than ‘Ohayou’; they have different times of flower bud formation. It is necessary to acquire parameters with different constants. When changing the values of the existing parameters for the varieties cultivated in Japan, common parameters may be applied with high universality for the extinction coefficient, the dry matter percentage, and LALFW. The extinction coefficient and LALFW are unaffected unless there are extreme morphological differences between broccoli cultivars. Since the amount of water a plant can contain is determined by the species, the dry matter percentage does not change depending on the broccoli variety and cultivation method used in Japan. For other cultivars and cultivation methods, it is necessary to investigate RUE and the distribution of dry matter. RUE differs depending on the cultivars of the period from sowing to harvest. In the distribution of dry matter, the timing of flower bud differentiation varies depending on the cultivar. Therefore, it is necessary to acquire parameters with different constants for each cultivar.
We thank Kazumi Asari, Mitsuo Hattori, Kaori Morioka, Hiromi Nakamura, Yumie Inoue, Takeshi Okami, and Hiroyuki Shibayama of the Institute of Vegetable and Floriculture Science, NARO, for growing the plants and supporting the experiments.