原著論文
Prediction of Soluble Solids of Tomato Fruit Grown in Salinized Nutrient Solution Based on the Electrical Conductivity of the Drainage
2023 年 92 巻 1 号 p. 47-55

詳細
2023 年 92 巻 1 号 p. 47-55
The relationship between fruit Brix and the electrical conductivity (EC) of the nutrient solution was investigated under gradually increasing EC conditions to predict and control tomato fruit Brix in commercial greenhouses in Japan. Based on the three experiments, fruit Brix was significantly and highly correlated with the cumulative EC of the drainage during the period from anthesis to harvest (cECd). This relationship followed a linear regression function. We then modelled fruit Brix based on cECd and validated this model to predict and control fruit Brix in four other experiments in different growing seasons using two cultivars, slab substrates, and irrigation systems. Using this model, we calculated the target cECd (cECdt) to achieve a target fruit Brix of 6% or higher and used cECdt as an indicator to manipulate the EC of the nutrient solution. In the validation experiments, cECd was lower than cECdt at the beginning of harvest in all experiments. cECd reached cECdt at 72.3–214.0°C·day after the first harvest. When cECd was higher than cECdt, more than 86.9% of the fruit had a higher than Brix 6%. In addition, the marketable yield was higher than 88.2%. RMSEs between the observed fruit Brix and predicted fruit Brix were 0.60–1.25. These results indicate that our model can predict and control fruit Brix.
Japanese consumers and retailers require flavorful tomato fruits. Higashide et al. (2012) reported that soluble solids content per unit of dry matter content has increased in ‘Momotaro’ (released in 1985) and a sister cultivar compared with several older cultivars, which suggests that Japanese breeders have improved fruit quality. The soluble solid content of tomato fruit is measured in degrees Brix. For Japanese consumers favoring sweetness in fresh tomato fruit, high-brix tomatoes are produced commercially (Johkan et al., 2014) and sold at high prices in the Japanese market. High-Brix tomatoes must maintain high quality (Johkan et al., 2014; Yamada, 2008), even while environmental conditions such as air temperature and solar radiation change year-round. To produce high-Brix tomatoes, growers add water or salinity stress to the plants. Although water or salinity stress increase tomato fruit Brix, they often reduce yield and induce physiological disorders such as blossom end rot (BER) (Dorais et al., 2001). To avoid these problems, some Japanese growers produce high-Brix tomatoes year-round using a short-term, low-truss crop management system combined with stress treatment (Itoh et al., 2020a, b). Short-term cultivation has the advantage of stress application to improve fruit Brix because plants do not need to be maintained for long periods (Araki et al., 2009; Johkan et al., 2014; Saito et al., 2006). In short-term production, tomato plants are typically pinched above the 1st–3rd truss and grown at a high density, with renewal using transplants three or four times a year in the same greenhouse (Araki et al., 2009; Itoh et al., 2020a, b; Johkan et al., 2014; Ohkubo et al., 2019).
In high-Brix tomato production under salinity stress, salinization techniques are often applied by manipulating the electrical conductivity (EC) of the nutrient solution (Itoh et al., 2020b; Johkan et al., 2014). Many reports have shown a positive correlation between fruit Brix and increased EC (Cornish, 1992; Dorais et al., 2001; Li et al., 2001; Schwarz and Kuchenbuch, 1997). Li et al. (2001) and Schwarz and Kuchenbuch (1997) reported that the relationship between fruit dry matter content or fruit Brix and root zone or supply EC could be explained by a linear regression function. Based on these reports, fruit Brix can be controlled by EC. In previous reports (Cornish, 1992; Dorais et al., 2001; Li et al., 2001; Schwarz and Kuchenbuch, 1997), the supply EC of nutrient solutions was set at a constant level throughout the experiments, unlike in Japanese high-Brix tomato production. Hohjo et al. (1996), Sakamoto et al. (1999), and Saito et al. (2006) evaluated the relationship between fruit Brix and changing EC supply. They showed that fruit Brix changed depending on the period and strength of the increase in EC. Johkan et al. (2014) reported a method of gradually increasing EC supply to produce high-Brix tomatoes in Japan that reached a fruit Brix of 6% in a single truss crop management system. However, their reports did not quantify the relationship between Brix and EC. If the relationship between fruit Brix and EC of tomatoes grown with changing EC can be modelled, it will be possible to predict and control fruit Brix in Japanese commercial production.
This study investigated the relationship between tomato fruit Brix and the ECs of the nutrient solution to predict and control fruit Brix in commercial greenhouses in Japan. We produced high-Brix tomatoes with short-term cultivation in a commercial greenhouse. In the first three experiments, we investigated the relationship between gradual EC increases, such as the EC of the supply or drainage solution at the anthesis and harvest dates, the period from anthesis to harvest, and fruit Brix, and developed a model to predict fruit Brix based on EC management of the nutrient solution. We predicted and controlled the fruit Brix at the target Brix (%) using the model and validated the model in the last four experiments.
To investigate the relationship between nutrient solution ECs and fruit Brix and develop a model for fruit Brix prediction, we conducted short-term experiments in triplicate (Experiments M1 to M3) using the method described by Itoh et al. (2020b). The tomato (Solanum lycopersicum) cultivar ‘Momotaro York’ (Takii & Co., Ltd., Kyoto, Japan) was used. The greenhouse compartment was 1730 m2 with 30 double rows of coconut fiber slabs (Cocobag; Toyotane, Aichi, Japan). We used 10 double rows for each experiment. Each row was 28 m long, with a spacing of 1.6 m between rows. The distance between pots was 25 cm, the plant density was 5.0 plants·m−2, and 2240 seedlings were used per experiment. In all experiments, two nutrient solution levels (EC) were applied: non-salinized and salinized. Five rows were given non-salinized nutrient solution, and another five were given salinized nutrient solution. The nutrient solution was gradually increased in both treatments. The target EC of the nutrient solution at transplanting, first truss anthesis, second truss anthesis, and third truss anthesis were managed at 0.6, 1.0, 1.5, and 2.0 dS·m−1, respectively, in the non-salinized treatment and 0.6, 1.5, 2.5, and 3.5 dS·m−1 in the salinized treatment. To increase the drainage EC to > 10 dS·m−1 by the first harvest in the salinized treatment, the nutrient solution was gradually increased to approximately 7 dS·m−1 after third truss anthesis. The EC of the nutrient solution was only controlled by the nutrient solution components in the non-salinized treatment, and both the components and NaCl (Namishio; Naruto Engyo, Tokushima, Japan; > 95% NaCl) in the salinized treatment. ECs of the supply and drainage solutions in the salinized and non-salinized treatments were measured once a day with an EC meter (D-50; Horiba, Kyoto, Japan) at 13:00 daily (n = 1). The drainage solution was collected for one day, and the EC was measured after stirring well. The supply volume of the nutrient solution was controlled based on the drainage rate. The daily drainage percentage was maintained at 15–30% of the total quantity of nutrient solution supplied. The drainage solution was not reused in any experiment.
In each experiment, plants in the 1st, 5th, 6th, and 10th rows and in three slabs placed at both ends were considered guard plants and excluded from the measurements. We observed anthesis of inflorescences in three areas (eight plants per area) twice a week. The date of the 3rd flower anthesis for each inflorescence was recorded as the anthesis date. We harvested all mature fruits from three areas (8–12 plants per area) three times a week. The date on which the first fruit was harvested in each truss was recorded as the harvest date. The daily average air temperatures from the anthesis to the harvest date were calculated as the cumulative temperature (°C·day) for each truss. Cumulative temperatures were averaged for each experiment. The average cumulative air temperatures in Experiments 1, 2, and 3 were 1129, 1174, and 1231°C·day, respectively. These cumulative temperatures did not differ significantly between non-salinized and salinized treatments (data not shown).
A model for predicting and controlling fruit BrixTo develop a model for predicting and controlling fruit Brix, we investigated the relationships between fruit Brix and the EC of the supply or drainage solution at the anthesis and harvest dates and the period from anthesis to harvest. The ECs of the supply and drainage solutions were measured daily. In three experiments, we obtained correlations between the fruit Brix and EC factors, the EC of the supply or drainage solution and the anthesis and harvest date, and the cumulative EC of supply or drainage during the period from anthesis to harvest. The harvest date for each fruit was recorded, and the anthesis date was calculated from the harvest date and the average cumulative temperature in each experiment. The cumulative EC was defined as the sum of the daily EC from anthesis to the harvest date. The cumulative ECs of the supply or drainage (cECs or cECd; dS·m−1·day) are expressed as follows:
| Eq. 1.1 |
| Eq. 1.2 |
| Eq. 2 |
Independent experiments were conducted four times using the method described above to control and predict fruit Brix using the developed model. In the four experiments (Experiments V1 to V4), we controlled the target Brix (Brixt; %) at ≥ 6% and predicted the fruit Brix based on Eq. 2. To control Brix, we added the nutrient solution to the target cECx (cECxt; dS·m−1·day) as follows: Based on Eq. 2, cECxt is expressed as:
| Eq. 3 |
Based on Eq. 3, we calculated cECxt. Brixt (%) indicates the target Brix value of the fruit. In this experiment, we calculated cECxt when Brixt was ≥ 6%. We used cECxt as an indicator to manipulate the EC of the nutrient solution in the salinized treatment. To achieve cECxt for all the fruits, we manipulated the EC of the supplied nutrient solution.
The tomato cultivars ‘Momotaro York’ (My) and ‘Momotaro Haruka’ (Mh) (Takii &) were sown and grown using the same method as in the previous three experiments. Seedlings were transplanted into 10 double rows for each experiment. In Experiments V1 and V2, the same slabs as those in the previous experiments were used. In Experiments V3 and V4, rockwool slabs (Grotop Grodan, Roermond, Netherlands) were used. The distance between the pots, plant density, and number of seedlings in V3 and V4 were 22.5 cm, 5.5 plants·m−2, and 2480 seedlings, respectively. Except for V4, Mh was transplanted in the 3rd and 8th rows, and My was transplanted in the remaining rows. In V4, Mh was transplanted only in the 3rd rows and My was transplanted in the remaining rows. In V4, all 10 rows were given salinized nutrient solution: five rows did not reuse the drainage solution (salinized treatment; the same method as the salinized treatment in the previous experiments), and the other five rows reused the drainage solution (salinized-reuse treatment). In the salinized reuse treatment, we supplied the drainage solution and a new solution. The new solution contained the same amount as that used in the salinized treatment. As a result, the total amount of irrigation in the salinized reuse treatment was approximately 1.5 times that of the salinized treatment. In the salinized-reuse treatment, while the drainage passed through a polyvinylidene fluoride ultrafiltration membrane (Itoh and Iwasaki, 2018) to remove microorganisms and waste larger than 0.001 μm, the nutrient components and EC of the drainage were not controlled. EC was measured at 13:00 every day in the 2nd and 7th rows (My) in all experiments, similar to the modeling experiments. We observed the anthesis and harvest dates using the same method as in previous experiments. Anthesis dates were recorded only in My, and harvest dates were recorded for both My and Mh. In My, fruits were harvested from three blocks (8–12 plants per area) in V1 and V2 and two blocks (7–8 plants per block) in V3 and V4. In Mh, fruits were harvested from one block (three plants per block) for all experiments. The average cumulative air temperatures from the anthesis date to the harvest date in My were 993.0, 982.0, 1065.9, and 1151.2°C·day in Experiments V1, V2, V3, and V4, respectively (Table 2). The temperature did not differ between the non-salinized and salinized treatments and salinized and salinized-reuse treatments (data not shown). We measured the Brix of marketable fruits (observed Brix; Brixo; %) in both cultivars. In My, the number of measured fruits was 48, 57, 35, and 47 in Experiments V1, V2, V3, and V4, respectively; 59 fruits in the salinized-reuse treatment in Experiment V4; and 50, 71, and 25 fruits in Experiments V1, V2, and V3, respectively, in the non-salinized treatment. In Mh, the numbers were 14, 18, 7, and 23 fruits in Experiments V1, V2, V3, and V4, respectively, in the salinized treatment and 15 and 16 fruits in Experiments V1 and V2, respectively, in the non-salinized treatment.
For the validation of each fruit, cECx was calculated using Eq. 1. The Brixp was calculated using Eq. 2, and compared with Brixo. To calculate cECx for Mh, My data on the average cumulative air temperature from the anthesis date to the harvest date and EC of the drainage solution were used. The RMSE and ME were calculated to evaluate the fruit Brix model. RMSE as:
| Eq. 4 |
| Eq. 5 |
Relationships between fruit Brix and EC factors (i.e., ECs of supply or drainage solution), fruit Brix and cumulative ECs of supply or drainage solution (i.e., cECs and cECd), and Brixo and Brixp were compared using the Pearson product-moment correlation coefficient. Fruit Brix and fruit fresh weight in the salinized and non-salinized treatments were compared using the Kruskal-Wallis test using the method reported by Itoh et al. (2020a). Differences in the percentage of marketable yield between treatments were evaluated by modeling the following linear equation, assuming that (1) the percentage of marketable yield was positive and greater than zero, and (2) the data for fruit weight and number of fruits were not negative and thus emerged from the gamma and Poisson distributions, respectively:
| Eq. 6 |
| Eq. 7 |
| Eq. 8 |
Table 1 shows the correlation coefficients between fruit Brix and EC factors and the nutrient solution ECs at different dates or durations in the salinized and non-salinized treatments in Experiments M1–M3. In the salinized treatment, fruit Brix was significantly correlated with the supply and drainage solution ECs on the date of anthesis and harvest and the cumulative ECs of both supply and drainage. In the non-salinized treatment, significant correlations between the fruit Brix and EC of supply or drainage at anthesis and between the fruit Brix and the cumulative EC of supply and drainage during the period from anthesis to harvest were observed. However, the correlation coefficients were lower than those of the salinized treatment. The correlations between fruit Brix and EC of supply and drainage at harvest in the non-salinized treatment were insignificant.

Correlation coefficients (r) between fruit Brix and electrical conductivity (EC) factors in Experiments M1 to M3; EC of the supply and drainage solutions measured at anthesis, harvest date, or cumulated daily EC from anthesis to harvest.
Among all combinations, the correlation coefficient between fruit Brix and the cumulative drainage EC of the period from anthesis to harvest (cECd) was the highest in both treatments in Experiments M1–M3 (r = 0.49, P < 0.001 in the non-salinized treatment, and r = 0.89, P < 0.001 in the salinized treatment; Table 1). We subsequently created a prediction model for fruit Brix as a function of cECd in the salinized treatment. Figure 1 illustrates the relationship between fruit Brix and cECd in My in salinized treatments in Experiments M1–M3. This relationship follows a linear regression function as shown in Eq. 2, and the coefficient of determination (R2) was 0.79. From this formula, a prediction model for fruit Brix based on cECd was developed, and the coefficients a and b in Eq. 2′ were 0.0057 and 3.55, respectively.
| Eq. 2′ |

Fruit Brix as a function of the cumulative electrical conductivity (EC) in the drainage solution during the period from anthesis to harvest in salinized treatments in Experiments M1 to M3 (n = 222).
Figure 2 illustrates the daily supply and drainage EC values and cumulative drainage EC from transplanting to the end of the experiment in the salinized, salinized-reuse, and non-salinized treatments in Experiments V1–V4. Daily drainage EC was higher than daily supply EC around 1000°C·day after transplanting in the salinized and salinized-reuse treatments. cECds at the anthesis date and harvest date of the first truss in the salinized and salinized-reuse treatment were 21.1–60.5 dS·m−1·day and 353.4–402.1 dS·m−1·day, respectively.
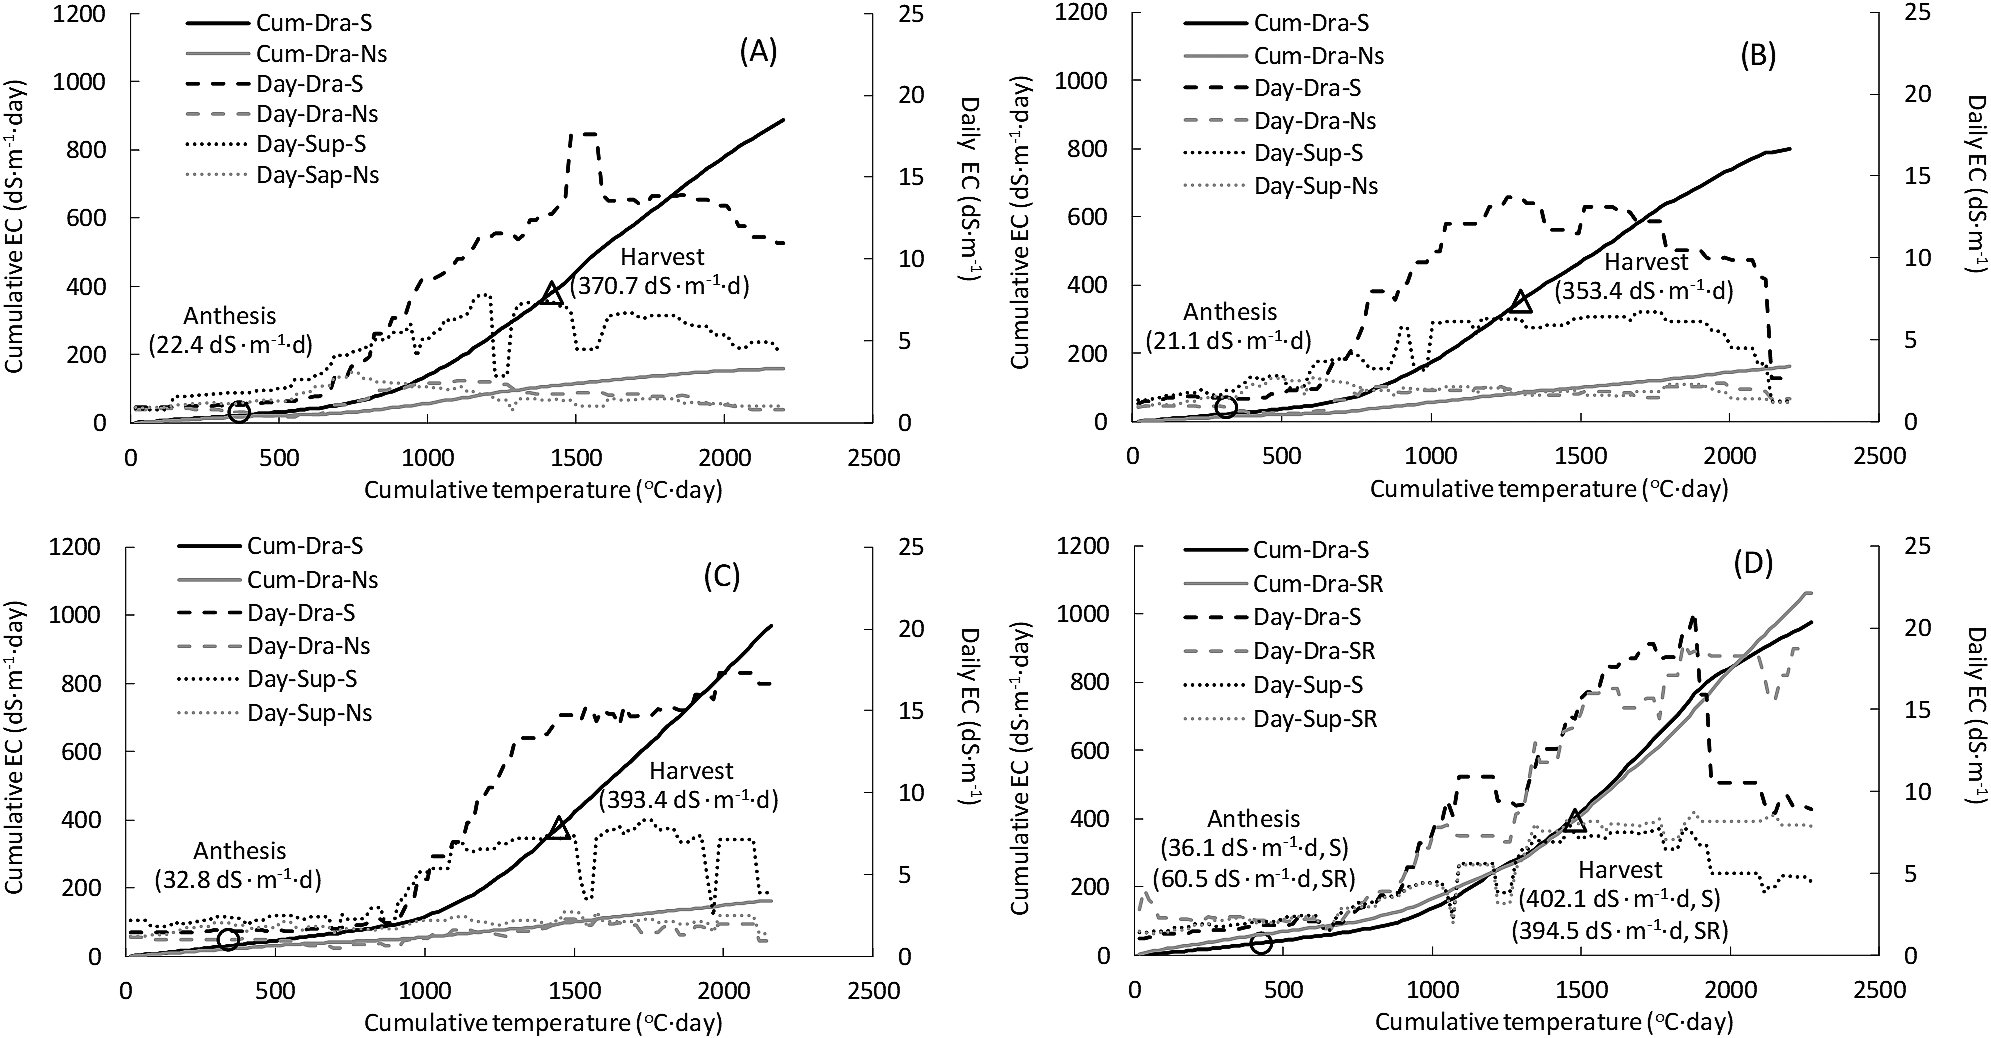
Change in cumulative and daily electrical conductivity (EC) according to cumulative temperature after transplantation in Experiments V1 (A), V2 (B), V3 (C), and V4 (D). Circles and triangles indicate the anthesis and harvest date of the first truss, respectively, and the ECs are cumulative drainage EC at each date in the salinized and salinized-reuse treatments. Cum: cumulative, Day: daily, Dra: drainage solution, Sup: supply solution, S: salinized treatment, Ns: non-salinized treatment, SR: salinized-reuse treatment.
Eq. 3′ was obtained from Figure 1 and Eq. 2′. cECdt shows the target cECd (cECdt; dS·m−1·day), and Brixt shows the target Brix of the fruit (%).
| Eq. 3′ |
Using Eq. 3′, at 6% ≤ Brixt, cECdt was obtained as 429.8 ≤ dS·m−1·day. In salinized and salinized-reuse treatments, cECds in the first harvested fruit were lower than the cECdt of 429.8 dS·m−1·day in all experiments (Fig. 2).
Figure 3 illustrates Brixp and Brixo in salinized, salinized-reuse, and non-salinized treatments in Experiments V1–V4. In both cultivars, Brixp and Brixo gradually increased according to the cumulative temperature in the salinized and salinized-reuse treatments in all experiments. In contrast, Brixo did not increase in the non-salinized treatments throughout the experiments. The harvest in each experiment started at 1492.8–1597.9°C·day after transplanting. Brixp reached the target value of 6% 72.3–214.0°C·day after the first harvest in the salinized and salinized-reuse treatments. In the salinized and salinized-reuse treatments, Brixo was higher than 6% in 71.2–96.5% of fruits in My and 95.7–100% of fruits in Mh in V1–V4. In the salinized treatment, the Brixo of My and Mh was significantly higher than in the non-salinized treatment (data not shown). In contrast, in the salinized treatment, the fresh weight of each fruit was significantly lower than that in the non-salinized treatment in My (data not shown). The percentage of marketable yield was higher than 88% for both treatments in all experiments (data not shown). It was significantly lower in the salinized treatment than in the non-salinized treatment in V2.

Predicted and observed fruit Brix as a function of cumulative temperature after transplantation in Experiments V1 (A), V2 (B), V3 (C), and V4 (D). Pred: Prediction, Obs: Observation, My: Momotaro York, Mh: Momotaro Haruka, S: Salinized treatment, Ns: Non-salinized treatment, SR: Salinized-reuse treatment. Dotted lines, the date when the predicted fruit Brix reached 6%; thin line, salinized treatment; thick line, salinized-reuse treatment.
Figure 4 illustrates the relationship between Brixp and Brixo in the salinized and salinized-reuse treatments in Experiments V1 to V4. In the salinized and salinized-reuse treatments, except for Mh in V3, Brixo was significantly correlated with Brixp (P < 0.001). In the salinized and salinized-reuse treatments, the slopes of the regression lines for Brixp and Brixo were 0.95 and 1.17 for My, and 1.10 and 1.20 for Mh (Fig. 4). RMSE was 0.50–1.17 for My and 0.89–1.25 for Mh (Fig. 4). ME was −1.03–0.58 in My and −1.21–0.70 in Mh. Except for My in V3, the RMSE and ME values were lower than those of Mh. Only salinized-reuse in V4 had a slope lower than 1.0, and the ME was higher than 0.

Observed fruit Brix as a function of predicted fruit Brix in salinized and salinized-reuse treatments, RMSE, and ME in Experiments V1 (A), V2 (B), V3 (C), and V4 (D). Dotted line, 1:1 relationship.
Previous studies have reported that a linear regression function can explain fruit Brix or dry matter content based on the relationship between fruit Brix and solution (Li et al., 2001; Schwarz and Kuchenbuch, 1997). Unlike these reports, which maintained a constant EC level throughout the experiments, Japanese growers gradually increase their EC. Therefore, these reports cannot be directly applied to predict and control fruit Brix in the Japanese commercial production of high-Brix tomatoes. This study observed significant correlations between fruit Brix and EC factors by gradually increasing EC levels. Among these relationships in Experiments M1–M3, the correlation with cECd was the highest (Table 1). This relationship followed a linear regression function (Fig. 1). We then modelled the prediction of fruit Brix based on cECd and validated this model in Experiments V1–V4. Using this model, Eq. 3′, we succeeded in predicting the fruit Brix in the present study.
Salinized irrigation has been shown to improve the quality of horticultural products, such as tomatoes, by increasing the dry matter content and sugar concentration (Li et al., 2001). Ehret and Ho (1986), Li et al. (2001), and Sakamoto et al. (1999) reported that this is because the uptake of water by plants or the accumulation of water by fruit was reduced under highly salinized conditions without a reduction in dry matter accumulation. In the present study, the correlation between fruit Brix and cECd was the highest among all EC factors (Table 1). Thus, cECd; EC of drainage during the period from anthesis to harvest, may be more closely related to the amount of water uptake or accumulation in fruit than other EC factors. Accordingly, cECd strongly correlated with Brix. Detailed investigations are required to confirm the correlation between cECd and fruit Brix values.
Based on Eq. 3′, we calculated cECdt and used it as an indicator to manipulate the EC of the nutrient solution in the salinized treatment in Experiments V1 to V4. At cECdt > 429.8 dS·m−1·day, 86.9%, and 100% of fruits from all experiments in My and Mh, respectively, were higher than the target fruit Brix value of 6% (Fig. 3). Thus, we can predict fruit Brix based on cECd in various seasons, cultivars, slab substrates, and irrigation systems. cECdt is a useful indicator of nutrient solution EC manipulation to control fruit Brix to the target value. It is necessary to control the air temperature in the greenhouse or to change the EC in response to the air temperature to maintain fruit Brix within a certain range.
Previous studies, which set nutrient EC at constant levels throughout the experiments, reported an increased incidence of BER (Adams and Ho, 1992; Li et al., 2001). However, when EC changed during fruit load, BER did not increase significantly (Hosokawa et al., 2006; Sakamoto et al., 1999). Johkan et al. (2014) also reported that tomato fruit could be grown normally by avoiding a rapid increase in nutrient solution concentration because of stabilized water inflow. In the present study, the gradual increase in EC may not have inhibited the inflow of water and prevented BER (data not shown), similar to reports by Johkan et al. (2014). Here, the marketable yield was higher than 88% in the salinized treatment. This was similar to previous studies on high-Brix tomatoes (Hosokawa et al., 2006; Johkan et al., 2014; Sakamoto et al., 1999). Thus, EC manipulation similar to that of the present study with the priority of achieving cECdt may not affect the marketable yield percentage, including the incidence of blossom-end rot.
There is one point to note when controlling for cECd using cECdt as an indicator. We had to change cECdt depending on the maturation days that determined the cumulative temperature from anthesis to harvest. In the present study, the cumulative air temperature from anthesis to harvest ranged from 982 to 1151°C·day for each experiment. We could not adjust the EC; cECd was lower than cECdt at the beginning of the harvest in all experiments (Figs. 2 and 3). Adams and Valdeés (2002) and de Koning (2000) reported that the difference in the cumulative temperature from anthesis to harvest was caused by the difference between the air temperature and fruit temperature and that the effect of temperature on maturity varies with the maturation stage of the fruit (Adams et al., 2001). Currently, only air temperature can be measured; however, if fruit temperature could be measured, the accuracy of ripening period prediction could be improved and would control EC.
Our Brix prediction model was obtained based only on My data from Experiments M1–M3. The cumulative air temperature from anthesis to harvest and drainage EC was obtained only in My in Experiments V1–V4. Only the harvest date was obtained for the Mh. However, we succeeded in predicting the Brix in Mh, which was predictable with an RMSE of 0.60–1.25, and the difference in RMSE between Mh and My was 0.04–0.36 (Fig. 4). Schwarz and Kuchenbuch (1997) and Dorais et al. (2001) reported that the response of fruit Brix to EC varied among cultivars. In the present study, Mh had a higher fruit Brix than My (Figs. 3 and 4). This difference in Brix between Mh and My may have caused a larger error in Mh than in My in the prediction.
Previous studies have reported that the environment influences the response of tomatoes to salinization. Cornish (1992) reported that the relationship between the nutrient solution EC and fruit Brix varied with the weather. Schwarz and Kuchenbuch (1997) reported linear relationships between EC and global radiation and growth parameters, such as fruit weight. Li et al. (2001) reported that controlling the shoot environment in a greenhouse could mitigate the effects of salinity in the root zone. Because the transplanting date differed from V1 to V4, the environmental conditions, such as temperature and photosynthetically active radiation (PAR) in the greenhouse, differed among the experiments (Table 2). Among the experiments, the difference between Brixo and Brixp was largest in V2 for both cultivars, suggesting the influence of environmental factors. In V2, the number of growing days was the shortest, and the average air temperature and cumulative PAR were the highest among the four experiments. These high temperatures and PAR may have increased the effect of EC, resulting in a high Brix value. Although our current model does not include environmental factors, it is necessary to examine whether the prediction can be further improved by adding environmental data.
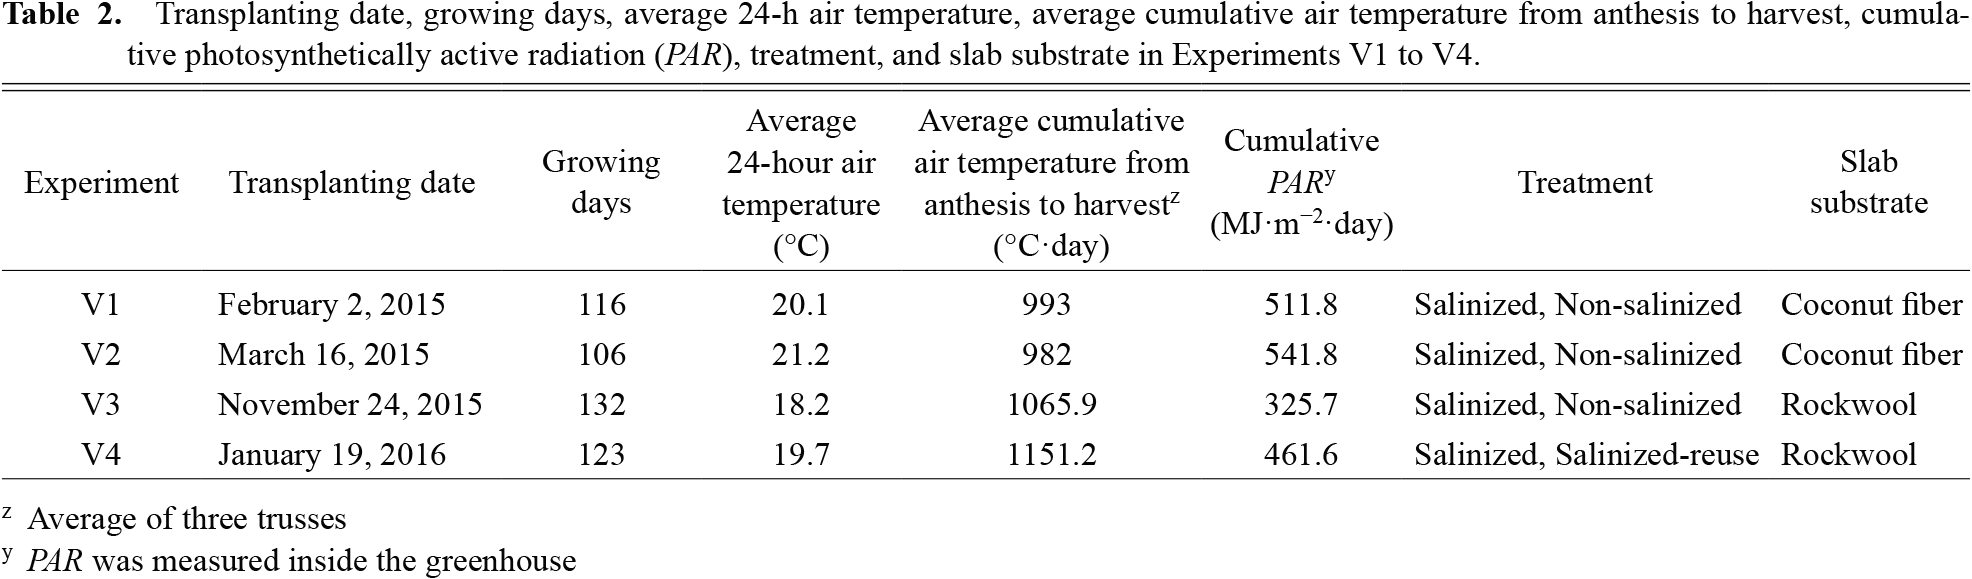
Transplanting date, growing days, average 24-h air temperature, average cumulative air temperature from anthesis to harvest, cumulative photosynthetically active radiation (PAR), treatment, and slab substrate in Experiments V1 to V4.
Using our model, we predicted fruit Brix with the same level of accuracy in the salinized-reuse treatment, in which the irrigation method differed from that of the experiments to obtain the modeling data (Fig. 4D). In contrast, in the salinized-reuse treatment, Brixo was lower than Brixp (Fig. 4). In the salinized-reuse treatment, while daily and cumulative drainage EC did not differ greatly, the total amount and irrigation frequency were higher than those in the salinity treatment. The total amount of irrigation water was approximately 1.5 times that of the salinized treatment. This was because both the new nutrient solution and the drainage were supplied. Helyes et al. (2014) and Zegbe-Domínguez et al. (2003) showed that increasing the water supply reduced fruit Brix and total soluble solids. Pires et al. (2011) reported that the fruit Brix decreased with increasing irrigation frequency. Similarly, increasing irrigation may reduce fruit Brix in the salinized-reuse treatment.
We concluded that fruit Brix was significantly correlated with cECd when the EC of the nutrient solution was gradually increased. Based on the relationship between fruit Brix and cECd, we successfully developed a model to predict and control fruit Brix values.