Abstract
The growing-degree-days (GDD) model for pineapple was developed to predict flowering and harvest dates; however, it has not been adapted to the climate in Japan’s growing regions, where air temperatures fluctuate over a wide range, and the prediction accuracy is low. The present study aimed to develop models for predicting flowering and harvest dates with high accuracy by analyzing a large phenological dataset from Japan’s main (Nago) and warmer (Ishigaki) production areas. The number of days between budding and flowering decreased at air temperatures of up to approximately 25°C and remained constant above 25°C. The number of days between flowering and harvest decreased until approximately 23°C. The effect of day length on both days to flowering and harvest was small. The relationship between air temperature and the developmental rate after budding to flowering and after flowering to harvest was modeled using the GDD and exponential function models, both with upper limits. The GDD model with an upper limit temperature was more accurate at predicting flowering and harvest dates compared to the conventional GDD model. In particular, the prediction accuracy of the harvest date was dramatically improved. Because the relationship between the developmental rate until flowering and the air temperature was exponential rather than linear, the exponential function model provided a more accurate prediction of the flowering date. The root-mean-square errors of the most accurate models were 3.7–6.1 days for predicting the flowering date and 6.1–10.2 days for the harvest date. We believe that these models will be useful for planning shipments of pineapple in regions with wide temperature ranges, such as Japan, and for cultivation management in response to climate change.
Introduction
Pineapple (Ananas comosus L. Merr.) is an important tropical fruit plant, with a production of 28 Mt globally in 2019 (FAO, 2022). It is cultivated at low latitudes that experience small seasonal variations in air temperature and day length. Costa Rica and the Philippines were the top producers of pineapples in 2019 (FAO, 2022). Normal year monthly mean air temperature in Costa Rica (San José, 10.0°N, 84.2°E) ranged from 21.9°C (October) to 23.8°C (March and April), and in the Philippines (Maynila, 14.5°N, 121.0°E) from 26.1°C (October) to 29.5°C (April); the annual air temperature ranges span just a few degrees (National Astronomical Observatory of Japan, 2018). However, in Japan, which is at the northern limit of economic pineapple cultivation (Ogata et al., 2016), there is an annual air temperature range of more than 10°C, from 16.5°C (January) to 28.9°C (July) in the main production area of Okinawa Island (Nago, 26.6°N, 128.0°E), and from 18.9°C (January) to 29.6°C (July) in Ishigaki Island (Ishigaki, 24.4°N, 124.2°E), which is a lower latitude production area (Japan Meteorological Agency, 2022).
In Japan, pineapple fruits are harvested throughout the year because of ethephon application, which results in flower bud induction, and other factors (Onaha, 1984). Because pineapple development is strongly affected by air temperature (Fleisch and Bartholomew, 1987; Lechaudel et al., 2010), the developmental rate after budding varies depending on the season and year. The prediction of flowering and harvest dates of pineapple is useful for the efficient management of growing systems. Moreover, it helps in planning the shipping of fresh fruits and the supply of fruits to canneries. If the fruit development period can be predicted, the relationship between temperature and the acid and soluble solid content during the fruit growing period (Sugiura et al., 2023) can be used to estimate the fruit quality at harvest.
The growing-degree-days (GDD) model was developed to predict the flowering and harvest dates of pineapple (Fleisch and Bartholomew, 1987; Lechaudel et al., 2010). However, the GDD model has not been adapted to the climate in Japan’s growing regions, where air temperatures fluctuate over a wide range; therefore, flowering and harvest dates of pineapple have not been predicted accurately in Japan. There are few reports on the sensitivity of pineapples to a wide range of air temperatures or photoperiodism.
In the present study, we aimed to clarify the quantitative relationship between the developmental rate of pineapple and climate conditions using a large phenological dataset from Japan’s main production area (Nago), as well as a warmer production area (Ishigaki), and to develop models for predicting flowering and harvest dates adapted to regions with wide temperature ranges such as Japan.
Materials and Methods
Plant materials and field observations
Budding, flowering, and harvest dates were collected for five pineapple cultivars, ‘N67-10’, ‘Soft Touch’, ‘Bogor’, ‘Gold Barrel’, and ‘Okinou P17’, that were harvested between 1999–2019 in experimental fields at the Okinawa Prefectural Agricultural Research Center in Nago (26.6°N, 128.0°E) and Ishigaki (24.4°N, 124.2°E). Ishigaki is located approximately 450 km southwest of Nago. ‘N67-10’, ‘Bogor’, ‘Soft Touch’, and ‘Gold Barrel’ are the top four cultivars produced in Japan (Ministry of Agriculture, Forestry and Fisheries, 2022), and most of the pineapples grown in Japan are one of these cultivars. ‘N67-10’, the leading pineapple cultivar in Japan, is a vegetative selection from ‘Hawaiian Smooth Cayenne’, while the other cultivars were bred using artificial hybridization techniques (Ogata et al., 2016; Shoda et al., 2012).
Pineapples were planted between March and October, and 25 mL of a mixture of 0.1% ethephon and 4% urea was applied to the growing point of each plant between April and November of the year following planting to trigger induction of the flower bud. However, most plants planted between August and October were excluded, and the mixture was not applied to these plants. Harvesting was conducted between September one year after planting and August two years after planting.
All plants were labeled for identification purposes. Each plant was considered to be budding when the growing point opened by approximately 2.4 cm, exposing the inflorescence. Additionally, when at least one corolla was visible, the plant was considered to be flowering. The harvest date was selected based on the peel color (percentage of the peel surface that turned yellow). As the pineapple peel contains more carotenoids in winter than in summer (Joomwong and Sornsrivichai, 2006), the peel color at the time of flesh ripening varies with the season (Onaha, 1984). In accordance with the harvest criteria of the Okinawa Prefecture Fruit Tree Cultivation Guidelines (Okinawa Prefecture, 2019), the fruit of ‘N67-10’ was harvested when the peel color ranged from 20% (June to August) to 80% (December to March). In the present study, the fruit was harvested when the peel color was 20–90% for ‘Soft Touch’ and 10–80% for the other cultivars. Other cultivation conditions, which included planting methods, soil management, and disease and pest control, were as recommended by prefectural guidelines.
Climate data
The daily mean air temperatures obtained from the Agro-Meteorological Grid Square Data (Ohno et al., 2016), a climate dataset with 1 km resolution (each grid cell measures 45" longitude × 30" latitude) based on records at observatories, were used for the two experimental fields owing to the distances between them and the observatories. Daily day lengths in each field were calculated using the method described by Yoshida (1985).
Statistical analysis
Only data pertaining to the first fruit of each plant were used in our analysis. The number of data pairs for budding and flowering dates of ‘N67-10’, ‘Soft Touch’, ‘Bogor’, ‘Gold Barrel’, and ‘Okinou P17’ were 2081, 2249, 1562, 220, and 957, respectively. The number of data pairs for flowering and harvest dates were 2092, 2286, 1565, 220, and 957, respectively.
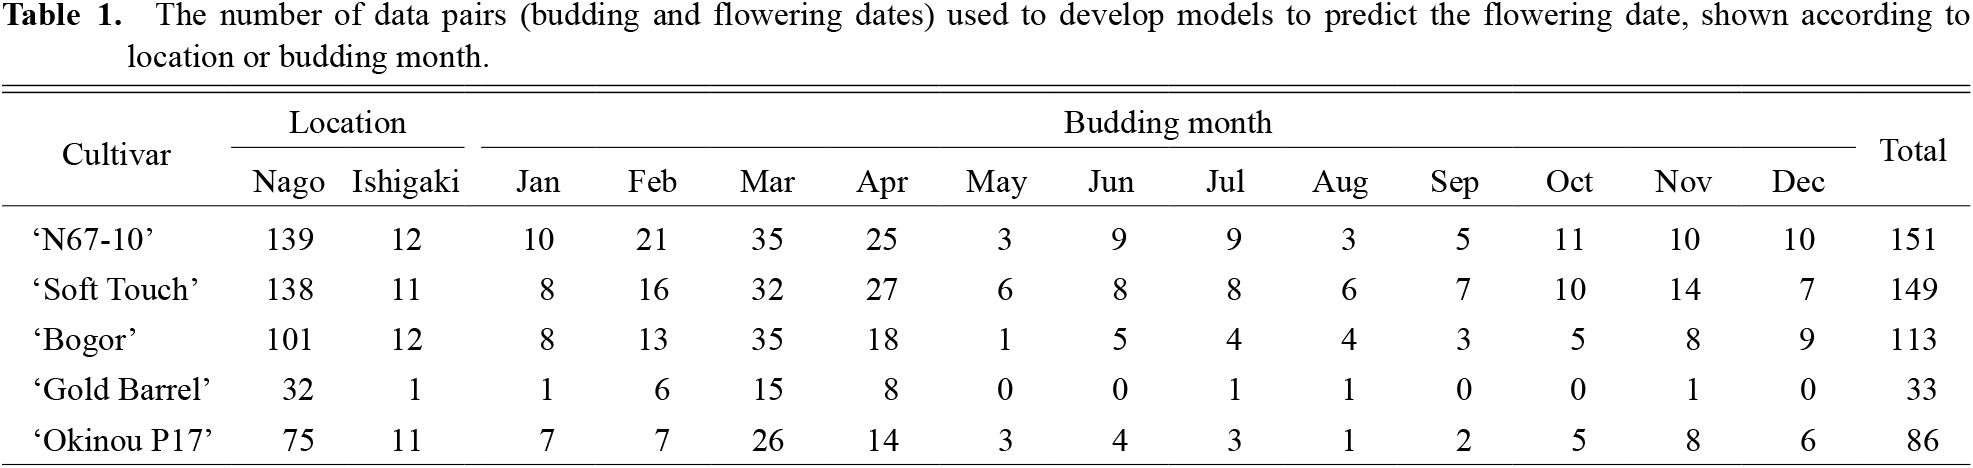
To minimize individual variations within each cultivar in each experimental field, the budding and flowering dates from plants that budded in the same month of the same year were averaged and considered as one data pair for subsequent steps in the development of models to predict flowering dates. However, when more than 30 plants budded in a given month, the month was divided into three 10-day periods, averaged, and used as a single data pair thereafter. The number of data pairs after averaging is presented according to location or budding month in Table 1. With the exception of ‘Gold Barrel’, data for budding and flowering dates were obtained throughout the year. More than 90% of the data were obtained from Nago.
Similarly, the flowering and harvest dates of plants that flowered in the same month of the same year or in the same 10-day period of the same year were averaged and used in the development of models to predict the harvest dates (Table 2).
The prediction accuracy of the model was evaluated using the root-mean-square error (RMSE) (day), which was calculated as follows:
where n is the number of data used in the calculation, De is the estimated date obtained from the model, and Dm is the observed date in the experimental field.
All calculations were performed using Excel for Microsoft 365, and coefficients for approximation by linear or exponential functions were calculated using the “Linest function” or “Logest function” in Excel.
Models to predict the flowering date
1) Modeling developmental rate
Previously, developmental rate (DVR) models have been used to predict the development of fruit tree buds and fruits (Konno et al., 2020; Sakamoto et al., 2015; Sugiura and Honjo, 1997a, b; Sugiura et al., 1991). These studies defined DVR as the amount of development per unit of time. The developmental stage index (DVI) was expressed as the accumulated value of DVR.
In the present study, to develop a DVR model to predict the pineapple flowering date, daily DVR (DVRd) after budding to flowering was defined as a function of daily mean air temperature:
where DVID is the developmental stage index on D (day) after budding and DVRd (day−1) is the amount of development per day. A value of 0 and 1 was assigned to the DVID for the budding and flowering dates, respectively.
If flowering occurs F (day) after budding, the DVI on the flowering date is expressed using the following equation:
If the relationship between the DVRd and daily mean air temperature is formulated, the flowering date can be estimated from the daily mean air temperature and equation (3). In this study, three models, namely the GDD model, GDD model with an upper limit temperature, and exponential function model with an upper limit temperature, were used to formulate the relationship between DVRd and daily mean air temperature.
2) GDD model
Fleisch and Bartholomew (1987) used the GDD model to predict pineapple flowering and harvest dates. The GDD model corresponds to a linear approximation of the relationship between the DVRd and daily mean air temperature (Sugiura, 1997) under a certain assumption described below. The relationship after budding to flowering was approximated with a linear function using the following method:
where Td (°C) is the daily mean air temperature and p (°C−1·day−1) and q (day−1) are the coefficients. From equations (3) and (4), the following equations are satisfied on the flowering date:
The GDD model determines the flowering date when the accumulated air temperature above the base air temperature (Tbase, °C) reaches a specific value (GDDF, °C·day). In cases where Td is lower than Tbase, 0 is normally accumulated. The GDD model can be described by the following equation:
|
∑d=1F
maxTd-Tbase,0=GDDF
| (7) |
where “max” is a function that returns the largest value in parentheses.
In a previous study, the Tbase of a GDD model to predict pineapple flowering date was 13.5°C (Fleisch and Bartholomew, 1987). Since most of the Td values observed in the present study were > 13.5°C, we performed subsequent analyses assuming that Td is always larger than Tbase. Then, the left side of equation (7) is the accumulated value of Td–Tbase, which is a linear expression for Td identical to equation (6). Therefore, by comparing the coefficients of equation (7) with those of equation (6), the following equation is obtained:
We determined p and q in equation (6) using the data from field observations and obtained the unknown coefficients Tbase and then GDDF in equation (7) from equations (8) and (9).
3) GDD model with the upper limit temperature
As detailed in the Results and Discussion section, the number of days after budding to flowering decreased for all cultivars as the mean air temperature increased; however, above a certain temperature (Tu, °C), the effect of air temperature decreaseed. Therefore, in this model, assuming Tu as the upper limit of air temperature, equation (4) was modified so that DVRd above Tu is equal to that at Tu.
|
DVRd=p·min(Tu, Td)+q
| (10) |
where “min” is a function that returns the least value in parentheses. Equation (7) was then modified as follows:
|
∑d=1Fmaxmin(Tu,Td)-Tbase,0=GDDF
| (11) |
The unknown coefficients Tu, Tbase, and GDDF in equation (11) were determined using data from field observations.
4) Exponential function model with an upper limit temperature
Temperature treatment experiments on trees showed that the relationship between air temperature and the developmental rate of Japanese pear (Sugiura et al., 1991) and grape buds (Sugiura et al., 1995) could be approximated by an exponential function. Exponential approximations have been employed in a few statistical studies on the developmental rates of tree buds, including cherry (Aono and Moriya, 2003) and Japanese apricot (Aono and Sato, 1996). Therefore, we considered using the following equation instead of equation (10):
|
DVRd=b·expa·min(Tu, Td)
| (12) |
where a (°C−1) and b (day−1) are coefficients. From equations (3) and (12), the following equation for the flowering date is satisfied:
|
∑d=1Fb·expa·min(Tu, Td)=1
| (13) |
By rearranging equation (13), equation (14) can be obtained.
|
∑d=1Fexpa·min(Tu, Td)=1/b
| (14) |
Once the unknown coefficients Tu, a, and b are determined, equation (14) can be used to predict the flowering date. These coefficients were determined using field observation data.
Models to predict harvest date
To predict the pineapple harvest date, the relationship between daily DVRd after flowering to harvest and daily mean air temperature were modeled using similar equations to predict the flowering date. In equation (2), a value of 0 and 1 was assigned to the DVID for the flowering and harvest dates, respectively. All equations in the present study were also used substituting “budding” to “flowering” and “flowering” to “harvest.”
Results and Discussion
Days to flowering and harvest
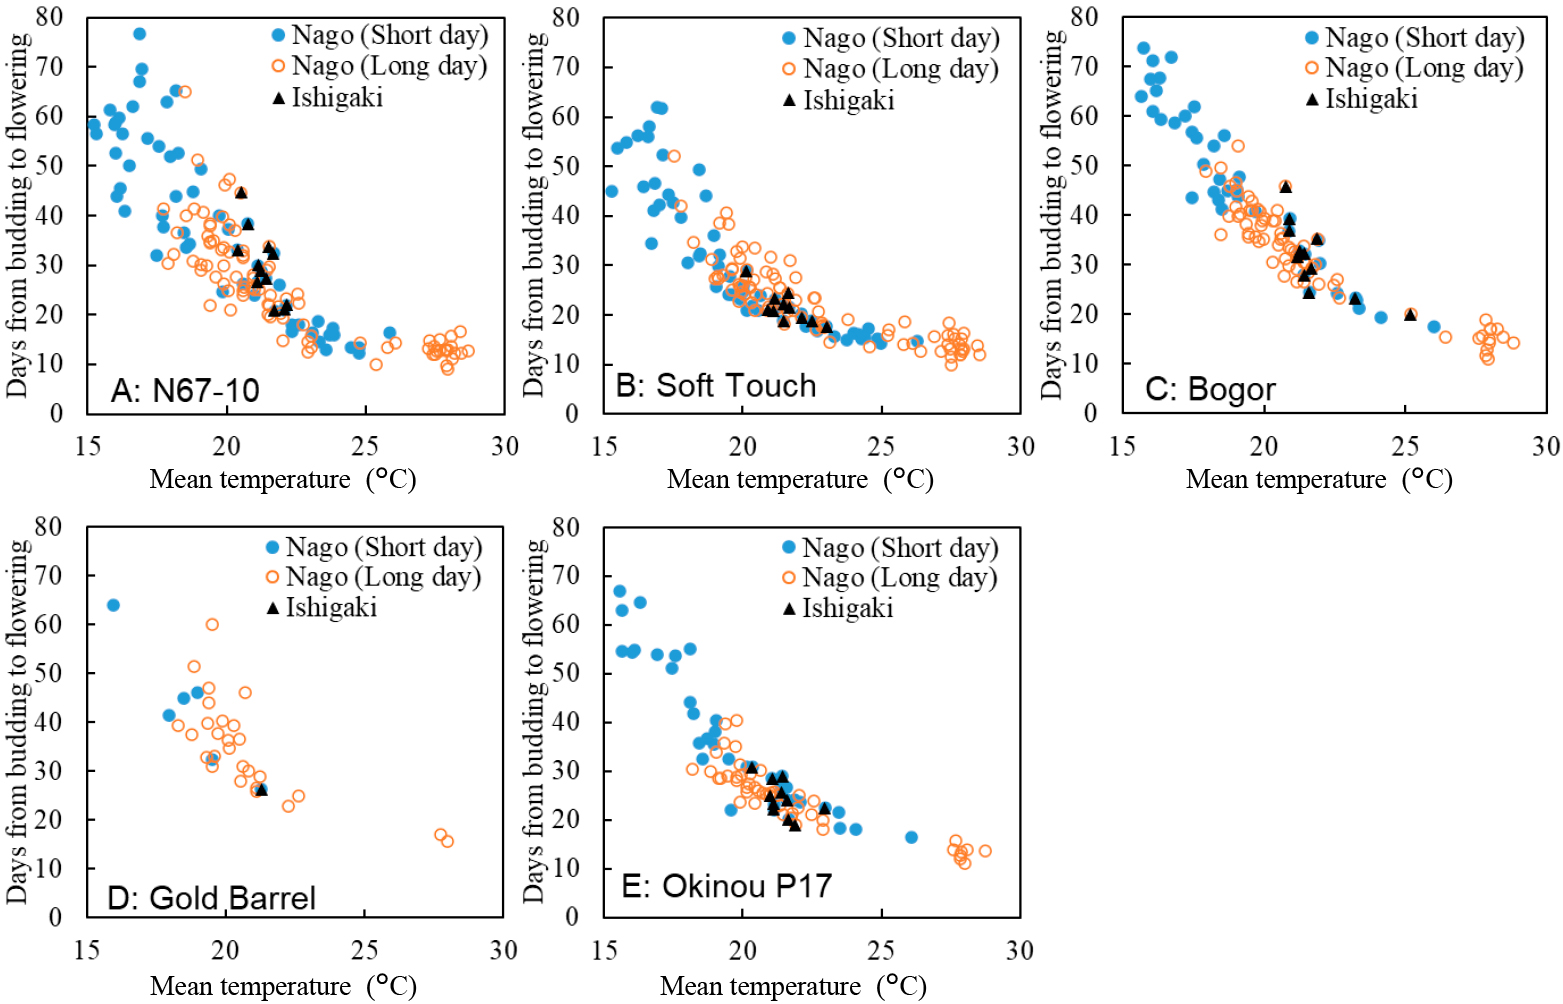
The mean number of days between budding and flowering was 26–37 days, with a standard deviation (SD) of 11–15 days (Table 3). The number of days between budding and flowering decreased for all cultivars as the mean air temperature after budding to flowering increased (Fig. 1). However, the effect of air temperature lessened when it exceeded around 25°C. The number of days between budding and flowering was similar in both experimental fields (Nago and Ishigaki) when air temperatures were equal. Data from Nago are presented according to mean day length after budding to flowering (Fig. 1): ≥ 12 h (long day) and < 12 h (short day). The effect of day length on the relationship between air temperature and days to flowering was unclear.

The mean number of days between flowering and harvest was 91–133 days, with an SD of 12–25 days (Table 3). The number of days between flowering and harvest also decreased as the mean air temperature after flowering to harvest increased (Fig. 2), and the effect of air temperature lessened when air temperature exceeded around 23°C. The effect of the region or day length on the relationship between air temperature and days to harvest was not clear. As the region and day-length conditions had little effect on these periods, data from both regions and all day-length conditions were combined for further analysis.
Predicting the flowering date
1) GDD model
To predict the flowering date using equation (7), we determined the coefficients Tbase and GDDF using the mean DVRd after budding to flowering (DVRmean, day−1). The DVRmean was calculated using the following equation:
As equations (3) and (15) yield equation (16), the DVRmean of each observed data pair can be calculated from the observed F.
Figure 3A shows the relationship between the DVRmean of ‘N67-10’ and the mean air temperature after budding to flowering. DVRmean increased as air temperature increased. There was a significant correlation between DVRmean and mean air temperature (Table 4). A similar relationship between DVRmean and the mean air temperature was observed for all cultivars as for ‘N67-10’, with a significant correlation (Table 4).
The relationship between DVRmean and the mean air temperature was approximated using a linear regression equation (the dashed line in Fig. 3A):
where Tmean (°C) is the mean air temperature after budding to flowering, and P (°C−1·day−1) and Q (day−1) are coefficients. The obtained P and Q values of ‘N67-10’ are as follows:
When Td > Tbase, in the GDD model, the relationship between DVRd and Td is linear (equation [4]). In such a case, the relationship between DVRd and Td is consistent with the relationship between DVRmean and Tmean. Therefore, from coefficients P and Q in equation (17), the coefficients p and q in equation (4) can be obtained.
The coefficients Tbase = 13.9 and GDDF = 171.9 (Table 4) were obtained from equations (8), (9), and (18–21). Tbase and GDDF of all cultivars were determined using the same calculation method (Table 4). The Tbase was approximately 13°C for each cultivar. Almost all Td observed in this study were > 13°C, thereby validating that the coefficients in equation (4) and equation (17) were consistent. The difference from Tbase = 13.5°C obtained using ‘Smooth Cayenne’ (Fleisch and Bartholomew, 1987) was small.
Using these coefficient values and equation (7), the flowering date could be estimated from the observed Td of each dataset. The RMSE of the estimated and observed flowering date was 4.3–7.9 days (Table 4). These RMSE values were less than the SD of the observed days between budding and flowering (Table 3), indicating the effectiveness of the GDD model.
2) GDD model with an upper limit temperature
To predict the flowering date using equation (11), we determined the coefficients Tu, Tbase, and GDDF. The number of days after budding to flowering decreased in all cultivars as the mean air temperature increased, and the effect of air temperature reduced above approximately 25°C (Fig. 1). Therefore, Tu was set to 25°C.
In the previous section, the relationship between DVRd and Td was represented by a single straight line (equation (4)), so that coefficients p and q in equation (4) could be obtained from the regression equation (equation (17)). However, when the relationship between DVRd and Td is considered as two lines in the range of air temperatures obtained from field observations, the relationship between DVRd and Td is not consistent with the relationship between DVRmean and Tmean. Therefore, coefficients p and q in equation (10) cannot be obtained directly using the regression equation. Thus, the unknown coefficients Tbase and GDDF in equation (11) were determined using the following methods.
A Tbase value was tentatively determined from the coefficients of the regression equations for DVRmean and Tmean at < 25°C and then this tentative value was optimized so that the RMSE becomes minimum. For example, the regression equation for ‘N67-10’ below 25°C is shown in Figure 3A. From the coefficients of this regression equation and equation (8), a tentative Tbase = 14.3 was obtained.
When the Tbase value is tentatively determined, the value for the left side of equation (11) (hereafter described as L11) can be obtained from the Tu and observed Td. The average of L11 (L11mean) was used as the tentative GDDF value corresponding to the tentative Tbase in this method.
When the tentative Tbase is 14.3, the L11mean obtained from the observed Td values for all ‘N67-10’ data is 159.7. Assuming Tbase = 14.3 and GDDF = 159.7, the flowering date can be estimated using the observed Td and equation (11). The RMSE of the estimated and observed flowering date is then 8.49 days.
If the tentative Tbase is changed, the corresponding GDDF and RMSE values also change. Figure 4A shows the RMSE value when the tentative Tbase was changed by 0.1°C from 10–15°C. When Tbase = 12.5, the corresponding GDDF was 208.5, and the RMSE was a minimum of 6.95 days (Table 4).
The Tbase and GDDF values based on the minimum RMSE of all cultivars were calculated using the same method (Table 4). The RMSE for each cultivar decreased by 0.1–1.5 days from that of the GDD model without the upper limit temperature. The Tbase values were approximately 12°C for each cultivar and were slightly smaller than those obtained using the GDD model without the upper limit temperature, but there was no clear difference.
3) Exponential function model with an upper limit temperature
To predict the flowering date using equation (14), we determined the coefficients a, b, and Tu as follows: the Tu was set to 25°C, the same as in the GDD model with the upper limit temperature.
The a value was tentatively determined using the exponential approximate equation for DVRmean and Tmean at < 25°C. The approximate curve and equation for ‘N67-10’ at < 25°C are shown in Figure 3A. From the coefficients of this equation, the tentative a = 0.173 was obtained.
When the coefficient of a is tentatively determined, the value for the left side of equation (14) (hereafter described as L14) can be obtained from the observed Td. The average of L14 (L14mean) was calculated, and the reciprocal of L14mean (1/L14mean) was obtained as b corresponding to this tentative a.
For example, when the tentative a is 0.173, the L14mean obtained from the observed Td values of all ‘N67-10’ data is 1039, and its reciprocal is 0.00096. Assuming a = 0.173 and b = 0.00096, the flowering date can be estimated using the observed Td and equation (14). The RMSE of the estimated and observed flowering date is then 6.18 days.
If the tentative a is changed, the corresponding b and RMSE values also change. Figure 4B shows the RMSE value when the tentative a was changed by 0.001°C from 0.15 to 0.20. When a = 0.168, the b corresponding a was 0.00107, and the RMSE was a minimum of 6.13 days (Table 4).
The a and b values based on the minimum RMSE of all cultivars were calculated using the same method and are shown in Table 4 along with RMSE values. The RMSE for each cultivar was 3.7–6.1 days. The RMSE of the model for predicting the flowering date was smaller for all cultivars using the approximation by the exponential function compared to the linear function. This may be due to the curvilinear relationship between DVRd and Td after budding to flowering, as suggested by the relationship between DVRmean and Tmean (Fig. 3A). This indicates that the exponential function model with the upper limit temperature is the optimal model for predicting the flowering date in the present study.
Predicting the harvest date
1) GDD model
Figure 3B shows the relationship between DVRmean of ‘N67-10’ and the mean air temperature after flowering to harvest. DVRmean increased as air temperature increased. A similar relationship between DVRmean and mean air temperature was found for all cultivars as for ‘N67-10’, with a significant correlation (Table 5).
The coefficients p and q in equation (4) were obtained from the linear regression equation between DVRmean and mean air temperature after flowering to harvest (the dashed line in Fig. 3B). Tbase, GDDF, and RMSE of each cultivar were determined using respective p and q (Table 5). The Tbase was 0.4–4.8°C, which is lower than Tbase after budding to flowering. The RMSE values were less than the SD of the observed days between flowering and harvest (Table 3).
2) GDD model with an upper limit temperature
The number of days between flowering and harvest decreased as the mean air temperature increased; however, the effect of air temperature lessened when air temperatures exceeded around 23°C (Fig. 2). Therefore, Tu was set to 23°C. The Tbase and GDDF values based on the minimum RMSE were calculated using the same method as that of the model for predicting flowering date (Table 5).
The Tbase values were 9.7–11.4°C. In a previous study, Tbase of GDD models for predicting pineapple harvest date was 9.2°C for ‘Queen Victoria’ (Lechaudel et al., 2010) and 11.7°C for ‘Smooth Cayenne’ (Fleisch and Bartholomew, 1987). The Tbase values of the GDD model without the upper limit were lower than Tbase of the previous study; however, Tbase values of the GDD model with the upper limit were close to them. These results suggest that the temperature response of DVRd at < 23°C was similar to those of previous studies.
The RMSE decreased dramatically and was about half of the RMSE of the GDD model without the upper limit temperature. The decrease in RMSE to predict the harvest date was more than that to predict the flowering date, i.e., the effect of adopting the upper temperature limit was higher in the prediction of harvest than in the prediction of flowering.
A peak (optimum) temperature is known to exist for the DVR of many plant species (Hatfield and Prueger, 2015). At temperatures lower than the peak temperature, the DVR increases as the temperature rises; however, near the peak temperature, the rate of change in DVR with respect to temperature is smaller. Therefore, in a narrow temperature range, the relationship between DVR and air temperature can be approximated by a single straight line; however, over a wider temperature range, the RMSE is expected to be smaller when approximated by multiple straight lines. As a result, the RMSE of the GDD model with the upper limit temperature would have been smaller than that of the conventional GDD model. Since the upper temperature limit was lower in the prediction of harvest than in the prediction of flowering, the effect of adopting the upper temperature limit may have been higher in the prediction of harvest.
3) Exponential function model with an upper limit temperature
The a and b values in equation (14) of the model for harvest date were calculated using the same method as the model for flowering date (Table 5). The RMSE values of the model for predicting the harvest date were smaller for ‘Bogor’, ‘Gold Barrel’, and ‘Okinou P17’ using the approximation generated by the exponential function than by the linear function. However, the RMSE values of ‘N67-10’ and ‘Soft Touch’ were larger than those obtained by a linear function. The small difference in RMSE between the linear and exponential functions was possibly because the curvature of the relationship between DVRd and Td after flowering to harvest was small, and the curve was close to a straight line, as suggested by the relationship between DVRmean and Tmean (Fig. 3B). Although optimal models for predicting the harvest dates differed by cultivar, the smallest RMSE for each cultivar was 6.1–10.2 days.
Conclusions
The present study confirmed that the development of pineapples after budding is controlled largely by air temperature, but not clearly by day length. The GDD model with the upper limit temperature was more accurate at predicting flowering and harvest dates in Japan, which has a wide air temperature range, compared to the conventional GDD model. In particular, the prediction accuracy of harvest date was dramatically improved. Because the relationship between the developmental rate after budding to flowering and the air temperature was exponential rather than linear, the exponential function model with the upper limit temperature was shown to give a more accurate prediction of the flowering date. The RMSE values of the best model for each cultivar were 3.7–6.1 days to predict the flowering date and 6.1–10.2 days to predict the harvest date.
Our proposed models could be used to predict flowering and harvest dates in most pineapple-growing regions in Japan as they correspond to the two studied growing regions and the majority of pineapple cultivars. We anticipate that the models will be useful for planning shipments of pineapple in regions with wide temperature ranges such as Japan, and for the management of cultivation in response to climate change.
Literature Cited
- Aono, Y. and C. Moriya. 2003. A generalized model to estimate flowering for cherry tree (Prunus yedoensis) considering both processes of endodormancy completion and development. J. Agric. Meteorol. 59: 165–177 (In Japanese with English abstract).
- Aono, Y. and K. Sato. 1996. Estimation of flowering date for Japanese apricot tree (Prunus mume) in western Japan considering both processes of rest break and development. J. Agric. Meteorol. 52: 125–134 (In Japanese with English abstract).
- FAO. 2022. FAOSTAT. Available at: https://www.fao.org/faostat/en/#data/QCL.
- Fleisch, H. and D. P. Bartholomew. 1987. Development of a heat unit model of pineapple (Smooth Cayenne) fruit growth from field data. Fruits 42: 709–715.
- Hatfield, J. L. and J. H. Prueger. 2015. Temperature extremes: Effect on plant growth and development. Weather Clim. Extremes 10: 4–10.
- Japan Meteorological Agency. 2022. Historical Weather Data Search (In Japanese). https://www.data.jma.go.jp/obd/stats/etrn/index.php.
- Joomwong, A. D. and J. Sornsrivichai. 2006. Impact of cropping season in northern Thailand on the quality of Smooth Cayenne pineapple. II. Influence on physico-chemical attributes. Int. J. Agric. & Biol. 8: 330–336.
- Konno, S., T. Sugiura, E. Tanimoto, N. Hiehata, Y. Tsutaki, H. Yamada and K. Iwata. 2020. Development of a model to predict the date of loquat fruit ripening. Climate in Biosphere 20: 41–48 (In Japanese with English abstract).
- Lechaudel, M., G. Damour, P. Fournier, J. Joas and M. Jahiel. 2010. How to predict the harvest date of tropical fruit: From simple methods to complex models. Acta Hortic. 880: 175–182.
- Ministry of Agriculture, Forestry and Fisheries. 2022. Survey on Production of Local Fruit Trees (In Japanese). https://www.e-stat.go.jp/statistics/00500503.
- National Astronomical Observatory of Japan. 2018. Rika Nenpyo, Chronological Scientific Tables 2019 (In Japanese). Maruzen Publishing, Tokyo.
- Ogata, T., S. Yamanaka, M. Shoda, N. Urasaki and T. Yamamoto. 2016. Current status of tropical fruit breeding and genetics for three tropical fruit species cultivated in Japan: pineapple, mango, and papaya. Breed. Sci. 66: 69–81.
- Ohno, H., K. Sasaki, G. Ohara and K. Nakazono. 2016. Development of grid square air temperature and precipitation data compiled from observed, forecasted, and climatic normal data. Climate in Biosphere 16: 71–79 (In Japanese with English abstract).
- Okinawa Prefecture. 2019. Okinawa Prefecture Fruit Tree Cultivation Guidelines (In Japanese). Okinawa Prefecture, Naha.
- Onaha, A. 1984. Cultivation basics of pineapple. In Nogyogijutsutaikei-kaju 7 (In Japanese). Rural Culture Association Japan, Tokyo.
- Sakamoto, D., H. Inoue, S. Kusaba, T. Moriguchi and T. Sugiura. 2015. The relationship between temperature and endodormancy completion in Japanese chestnut ‘Porotan’ (Castanea crenata Sieb. et Zucc.): towards establishing a developmental rate (DVR). J. Agric. Meteorol. 71: 106–110.
- Shoda, M., N. Urasaki, S. Sakiyama, S. Terakami, F. Hosaka, N. Shigeta, C. Nishitani and T. Yamamoto. 2012. DNA profiling of pineapple cultivars in Japan discriminated by SSR markers. Breed. Sci. 62: 352–359.
- Sugiura, T. 1997. Analysis of meteorological responses of the Japanese pear and development of models for predicting a growth and development. Ph.D. Thesis. Kyoto Univ. (In Japanese). DOI: 10.11501/3131585.
- Sugiura, T. and H. Honjo. 1997a. A dynamic model for predicting the flowering date developed using an endodormancy break model and a flower bud development model in Japanese pear. J. Agric. Meteorol. 52: 897–900.
- Sugiura, T. and H. Honjo. 1997b. The effects of temperature on endodormancy completion in Japanese pear (Pyrus pyrifolia Nakai) and modeling the relationship. J. Agric. Meteorol. 53: 285–290 (In Japanese with English abstract).
- Sugiura, T., M. Takeuchi, T. Kobayashi, Y. Omine, I. Yonaha, S. Konno and M. Shoda. 2023. Relationship between acid and soluble solid content of pineapple and temperature. Hort. J. 92: 227–235.
- Sugiura, T., T. Maejima and H. Honjo. 1995. A model for development from budding to flowering of grape. J. Japan. Soc. Hort. Sci. 64 (Suppl. 2): 210–211 (In Japanese).
- Sugiura, T., S. Ono, F. Kamota, T. Asakura, T. Okuno and S. Asano. 1991. A model for developmental rate from rest break to flowering of Japanese pear. J. Agric. Meteorol. 46: 197–203 (In Japanese with English abstract).
- Yoshida, S. 1985. The Sun. p. 1–10. In Taiyo-energy-riyo-handbook (In Japanese). Japan Solar Energy Society, Tokyo.