依頼総説
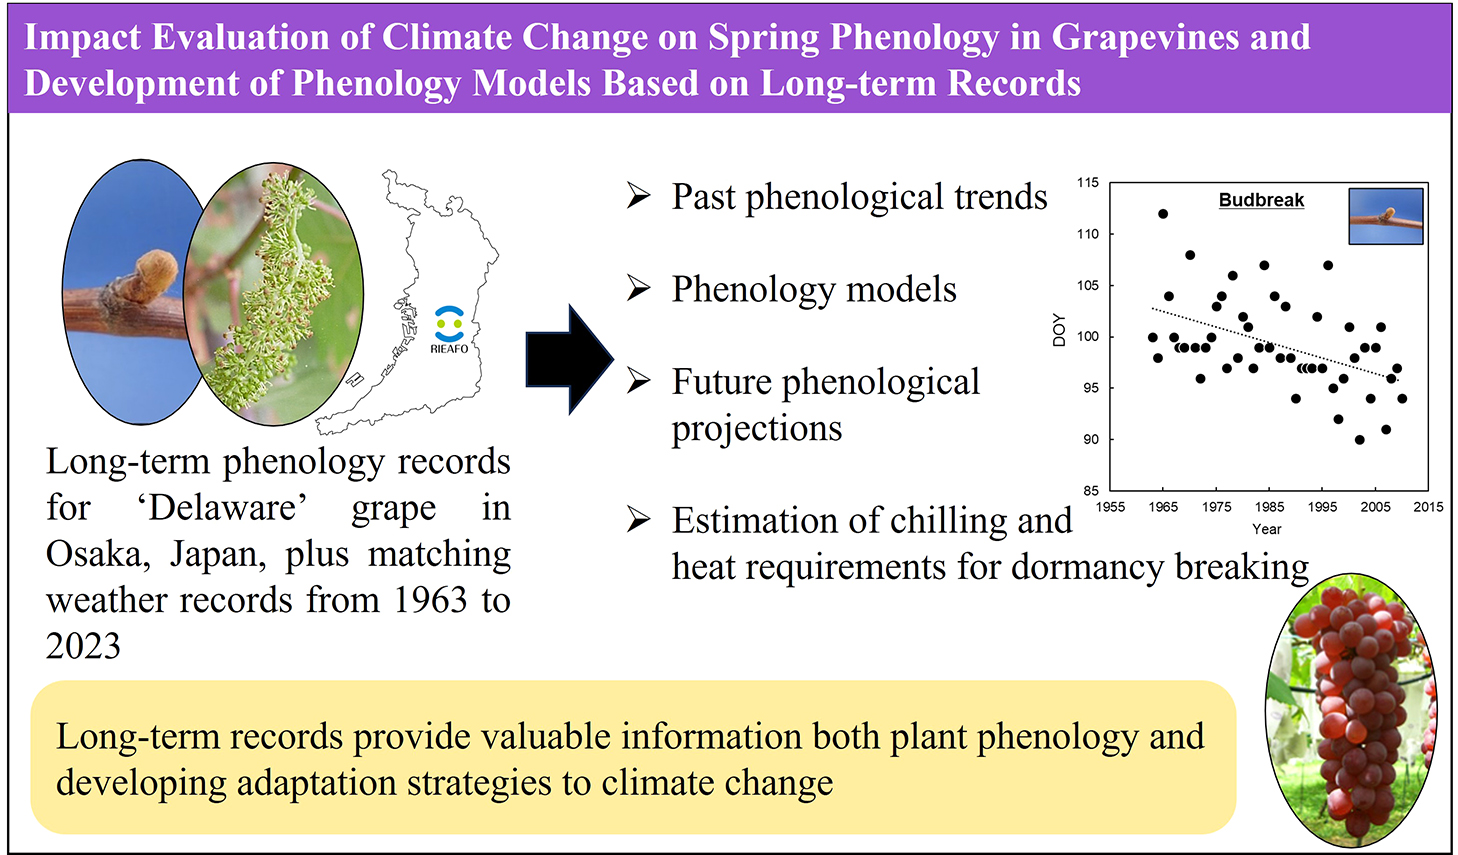
Impact Evaluation of Climate Change on Spring Phenology in Grapevines and Development of Phenology Models Based on Long-term Records
2026 年 95 巻 1 号 p. 1-9

詳細
2026 年 95 巻 1 号 p. 1-9
Recent climate change has altered the timing of spring phenology (budbreak and flowering) in grapevines. Specific phenological stages serve as key indicators for agricultural production planning in grapevine cultivation, including disease and pest control and gibberellic acid treatment. Therefore, predicting phenology based on its relationship with temperature (the main environmental factor) has become increasingly important. Long-term phenology data can be used to evaluate the climate change impact to date and develop phenology models. Additionally, future climate change impact assessments can be performed by applying future temperature scenarios to phenology models. Furthermore, the use of long-term phenology data is expanding, including the estimation of temperature responses during dormancy using recently developed statistical analytic methods, such as partial least squares regression. This review firstly describes the relationship between spring phenology and temperature in grapevines, then summarizes the current trends in spring phenology affected by climate change using long-term records. Next, the development of temperature-dependent phenology models and future climate change impact assessments using these models are outlined, along with key considerations for their use. Finally, the usefulness of long-term data in developing highly accurate and robust process-based models is emphasized.
According to the Intergovernmental Panel on Climate Change, the global average temperature in 2011–2020 was 1.09°C higher than in 1850–1990 (IPCC, 2021). Among environmental factors, temperature is the primary determinant of plant phenology timing (Menzel et al., 2020; Wolkovich et al., 2012). Variations in plant phenology due to temperature increases have been reported across various regions and species (Chmielewski and Rötzer, 2001; Cook et al., 2012; Grab and Craparo, 2011). In the grapevine (Vitis spp.) targeted in this study, spring phenology, including budbreak and flowering, occur earlier (Bock et al., 2011; Duchêne and Schneider, 2005; Jones and Davis, 2000; Kamimori et al., 2019; Tomasi et al., 2011; Urhausen et al., 2011; Wolfe et al., 2005). Predicting the timing of phenology in the current year is crucial as the phenological stages serve as key indicators for disease and pest control or gibberellic acid treatment in grapevine cultivation (Caffarra and Eccel, 2010; Kamimori et al., 2020). Therefore, developing phenology models based on the relationship between phenology and temperature as an adaptation measure to climate change has gained interest.
The development of broad-scale meteorological data has facilitated research on phenology models. In Japan, the Agro-Meteorological Grid Square Data, NARO from the National Agriculture and Food Research Organization (NARO) (hereafter referred to as AMGD-NARO) (Ohno et al., 2016), a climate dataset with a 1-km resolution, is available. AMGD-NARO provides temperature forecast values from “today” (the day of AMGD-NARO use) up to the next 26 days based on numerical forecasts from the Japan Meteorological Agency, making it useful for phenology prediction. Additionally, AMGD-NARO includes future temperature scenarios derived from global climate models spanning the period 1981–2100 (Nishimori et al., 2019) and has been applied to rice (Ishigooka et al., 2017) and maize (Kanno et al., 2019) to assess future climate change impacts and develop adaptation strategies. Therefore, if temperature-based phenology models for target plants can be developed, the dataset can be utilized for phenology prediction and future climate change impact assessments.
To develop accurate and robust phenology models, making a process-based model that considers the temperature response of grapevines is necessary. Process-based models describe known or hypothesized cause-effect relationships between physiological processes and environmental cues, allowing for more precise and robust predictions under novel conditions (Asse et al., 2020; Chuine and Régnière, 2017). For example, an understanding of dormancy physiology is important for predicting budbreak in grapevines. Grapevines stop growing and enter dormancy in the fall and winter due to a short photoperiod (Fennell and Hoover, 1991) or low temperature (10°C to 18°C) (Tohbe et al., 1998) (Fig. 1). Dormancy is a protective mechanism in which grapevines spontaneously suppress growth to adapt to unsuitable winter conditions. Based on differences in causative factors, dormancy is classified as endodormancy (caused by internal physiological factors within the bud) and ecodormancy (caused by external factors that limit growth) (Lang et al., 1987). Endodormant buds need to experience a specific amount of chilling accumulation (chilling requirement) to break endodormancy. When the chilling requirement is met, buds enter ecodormancy and budbreak occurs once a specific amount of heat accumulates (heat requirement). Since future temperature increases will affect fall and winter conditions, phenology models incorporating chilling requirements are advisable when assessing the future climate change impact (Caffarra and Eccel, 2010; Cook et al., 2012). Therefore, efforts are underway to develop a phenology model that considers chilling and heat requirements, while also quantifying chilling and heat requirements, for grapevines (described in detail below).
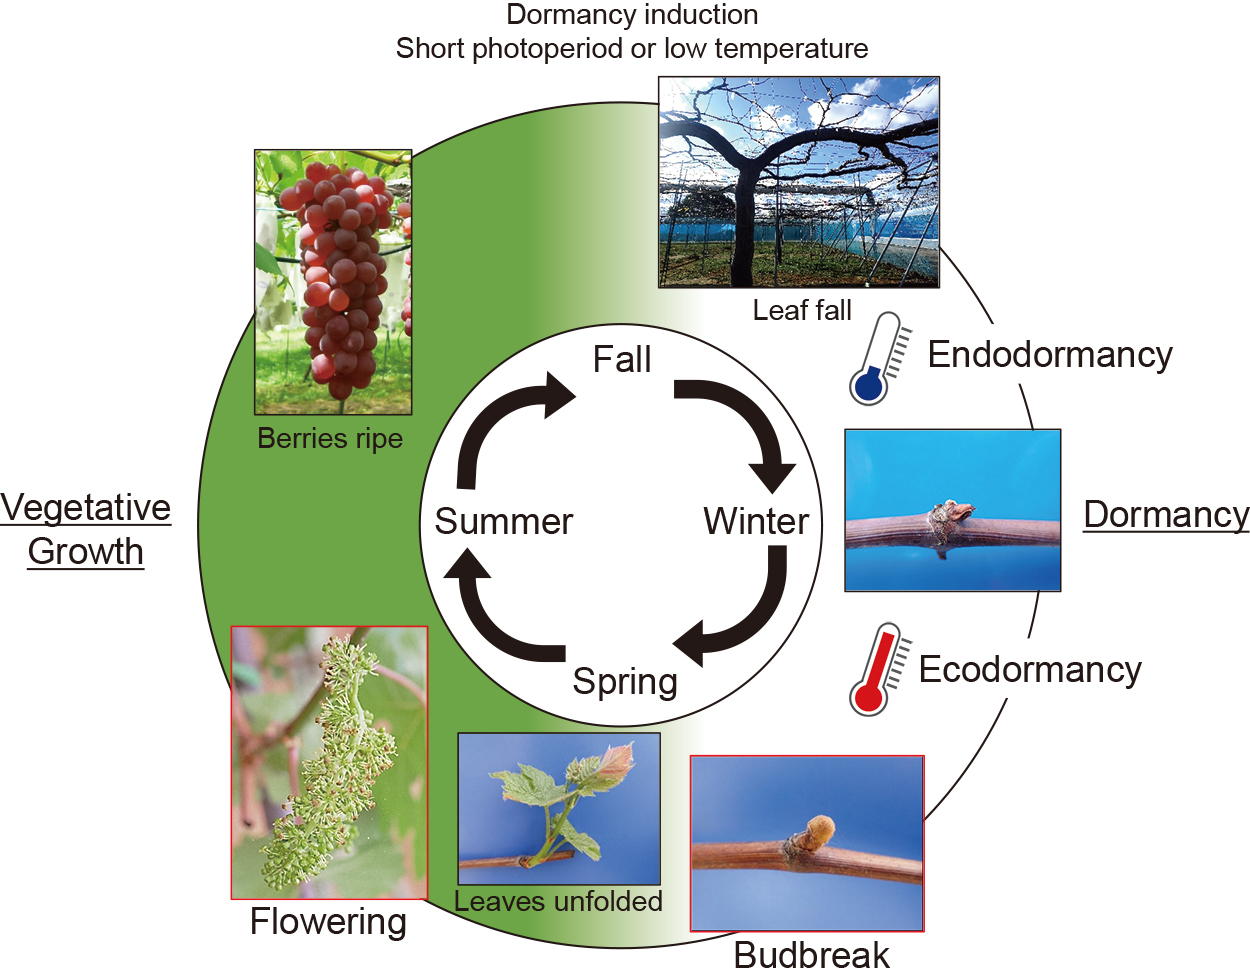
Annual phenology transition in grapevines (‘Delaware’ example).
The Research Institute of Environment, Agriculture and Fisheries, Osaka Prefecture (the author’s institution), has been collecting spring phenology data on the ‘Delaware’ grape (Vitis vinifera × (V. labrusca × V. aestivalis)) for several decades. In this review, impact evaluation of climate change on spring phenology in grapevines and the development of phenology models based on long-term records are summarized with reference to studies utilizing the ‘Delaware’ data. This review firstly describes the relationship between spring phenology (budbreak and flowering) and temperature in grapevines, then summarizes current trends in spring phenology affected by climate change using long-term records. Next, development of temperature-dependent phenology models and future climate change impact assessments are outlined, highlighting key considerations for their application. Finally, the usefulness of long-term data in developing highly accurate and robust process-based models is underscored.
Chilling and heat requirements are the primary factors determining dormancy breaking and budbreak in spring (Luedeling, 2012). During endodormancy, budbreak does not occur or requires more heat than usual even under favorable environmental conditions (Dokoozlian, 1999; Takagi and Tamura, 1987). In contrast, the timing of grapevine flowering is affected by temperature after budbreak, with higher temperatures during this period shortening the number of days from budbreak to flowering (Cameron et al., 2022; Sugiura et al., 1995). Thus, it seems that chill accumulation has little or no flowering-advancing effect.
How has climate change to date affected spring phenology in grapevines with such temperature-dependent responses? Analysis of long-term phenology and temperature data indicates that budbreak and flowering in grapevines are occurring earlier, correlating with rising temperature trends. Examples of published studies include budbreak and flowering in the Bordeaux (Jones and Davis, 2000), Alsace (Duchêne and Schneider, 2005), and Moselle regions (Urhausen et al., 2011) in France; budbreak and flowering in Franconia, Germany (Bock et al., 2011); flowering in the Veneto region, Italy (Tomasi et al., 2011); and flowering in New York, United States of America (Wolfe et al., 2005). Most reports originate from grape production areas in Europe and the United States. A similar trend is observed in Osaka, Japan, where budbreak and flowering of ‘Delaware’ have advanced from 1963 to 2010, corresponding to rising temperatures (Kamimori et al., 2019) (Fig. 2). These advances in spring phenology are attributed to the earlier fulfillment of heat requirements due to increasing spring temperatures. Although most temperate woody perennials also show accelerated spring phenology (Chmielewski and Rötzer, 2001; Menzel et al., 2020), some species show no change or even delayed trends in spring phenology (Cook et al., 2012). Delayed trends have been observed in mild winter regions such as for pistachios in Tunisia (semi-arid Mediterranean climate) (Elloumi et al., 2013) and apples in Mediterranean regions (Legave et al., 2013) and Brazil (Pertille et al., 2022). This may be due to a delayed fulfillment of the chilling requirement needed to break endodormancy by rising temperatures in fall and winter, thus delaying phenology (Guo et al., 2015a). To our knowledge, delayed spring phenology in grapevines has not been reported. However, delayed spring phenology may also occur in grapevines when the temperature increases in fall and winter and exceeds the point at which endodormancy breaking begins to be affected. On the other hand, grapevines have a relatively low critical chilling requirement (minimum amount of accumulated chill needed for budbreak to be possible) compared to other temperate woody perennials, suggesting that buds respond to heat at the initial stages of endodormancy (Dokoozlian, 1999; Horiuchi et al., 1981; Kamimori and Hosomi, 2024). In Japanese grapevine cultivation, heated cultivation that starts heating from early winter (e.g., early-December), combined with dormancy-breaking treatments is widely used. This suggests that endodormant buds are already somewhat responsive to heat at that time (Takagi and Tamura, 1987), allowing insufficient chilling to be compensated for with additional heat. Thus, in grapevines, the budbreak-delaying effect due to rising temperatures in fall and winter remains weak, and the trend of earlier spring phenology is expected to persist (Fila et al., 2014; Kamimori and Hiramatsu, 2022). It will be necessary to continue observations and note the trends in spring phenology in grapevines.
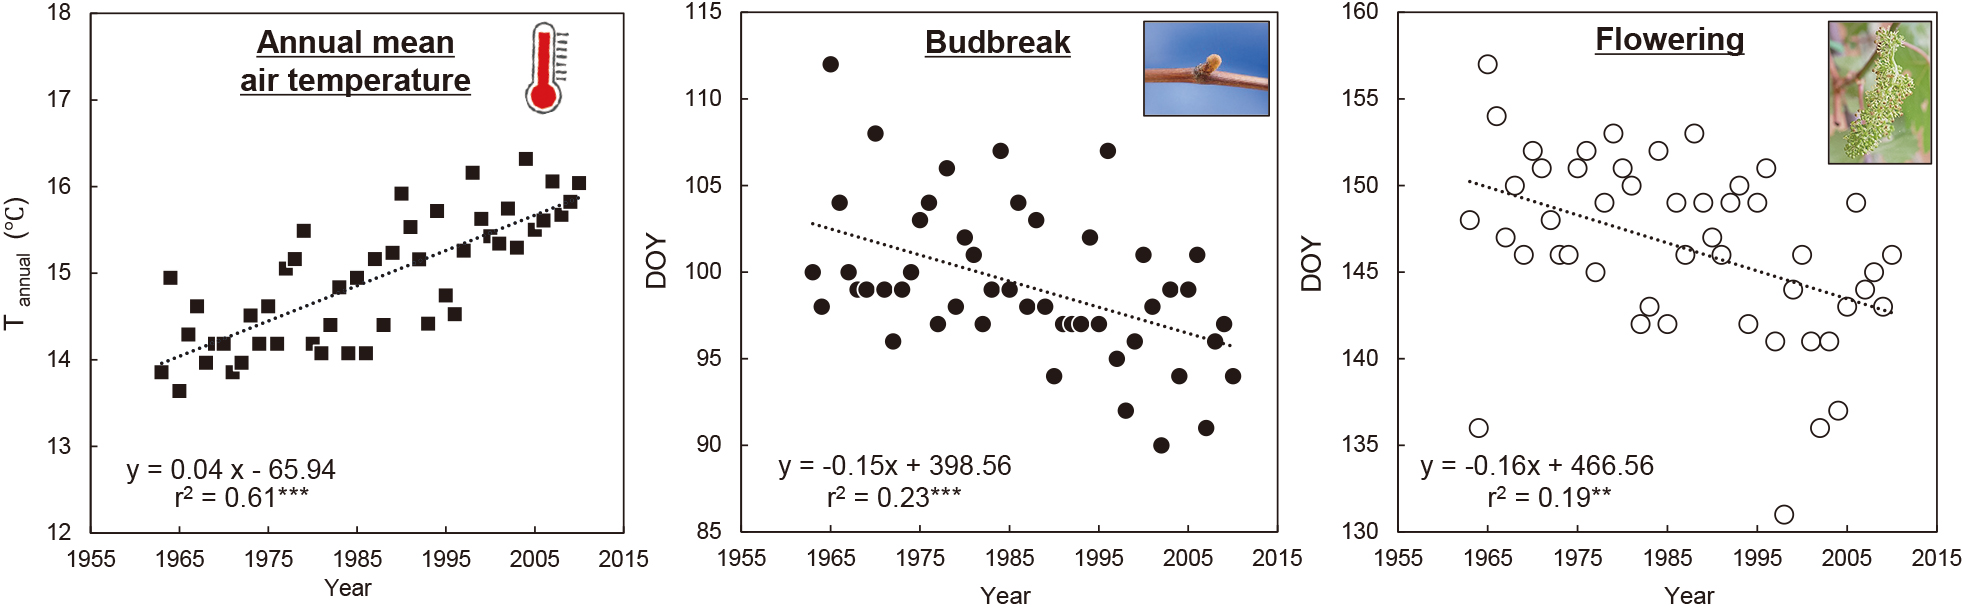
Temporal change in annual mean air temperature and distribution of budbreak and full bloom dates for ‘Delaware’ from 1963–2010 in Osaka, Japan (modified from Kamimori et al. (2019)). ** and *** indicate significance of the regression equation at P < 0.01 and P < 0.001, respectively. DOY, day of the year (number of days from January 1).
Climate change causes variations in grapevine phenology, making empirical cultivation management more challenging. This has raised interest in development of phenology models. While some recent phenology models incorporate environmental factors other than temperature (e.g., photoperiod or solar radiation) (Camargo-Alvarez et al., 2020; Iwasaki et al., 2022), temperature-dependent models are commonly used. Regarding the use of daily or hourly temperatures, it has been reported that hourly temperatures provide slightly more accurate predictions than daily temperatures (Sugiura et al., 2024). However, daily temperature forecast values are more readily available than hourly values. Additionally, using daily temperatures is more practical because they require less data and are easier to manage for individuals making actual predictions (e.g., agricultural extension workers or farmers) than hourly values. Therefore, it is advisable to decide whether to use daily or hourly temperatures for phenology models depending on the situation and purpose.
The most basic and classic temperature-dependent phenology model is accumulative temperature (Chuine and Régnière, 2017; Kamimori et al., 2021). Accumulative temperature consists of the starting date, temperature, and a base temperature (below which no heat accumulation occurred). In grapevine cultivation, the Huglin Index (Huglin, 1978) and the Winkler index (Amerine and Winkler, 1944), both using a base temperature of 10°C, have historically been used to assess climate suitability. Although the accumulative temperature is simple and easy to understand, it assumes a linear relationship between temperature and development. As a result, various methods have been proposed to account for nonlinear relationships between phenology and temperature, such as the Development rate model (de Wit et al., 1970), which has been applied to phenology prediction of grapevines (Kamimori et al., 2020; Sato and Takezawa, 2014).
As explained earlier, since the timing of flowering strongly depends on the temperature after budbreak, phenology models consisting of the heat requirement starting from a fixed date (e.g., budbreak) can achieve high predictive accuracy (Caffarra and Eccel, 2010; Kamimori et al., 2020; Parker et al., 2011; Sato and Takezawa, 2014). This type of phenology model belongs to the forcing (F) type. In contrast, since the timing of budbreak is affected by both the chilling period (when the chill requirement accumulates) and the forcing period (when the heat requirement accumulates), a model incorporating both chilling and forcing periods (CF type) is considered more process-based. However, the CF type does not always outperform the F type in predicting budbreak in grapevines (Caffarra and Eccel, 2010; Fila et al., 2014; Leolini et al., 2020; Parker et al., 2011). This may be due to overfitting caused by the high model complexity of the CF type (Fila et al., 2014). Although the CF type is preferable for developing a spatially robust model and future climate change impact assessment (Leolini et al., 2020; Luedeling and Brown, 2011), the F type may be sufficient for phenology prediction within the region where the phenology data were collected (Kamimori et al., 2020; Nendel, 2010). It is necessary to develop a phenology model that considers the model’s level of complexity and range of applications.
Among the methods used to quantify the chilling requirements of temperate woody perennials (e.g., 0 to 7.2°C model [Weinberger, 1950]), the Dynamic model (Fishman et al., 1987a, b) has been reported to be the best and most process-oriented (Guo et al., 2015b; Kamimori and Hosomi, 2024; Luedeling et al., 2013). Recently, phenology models for grapevine that incorporate the Dynamic model as a chill model have been developed (Kamimori and Hosomi, 2025; Prats-Llinàs et al., 2019). In the CF type, it is also debated whether the accumulation of chilling and heat occur sequentially (Fila et al., 2014; García de Cortázar et al., 2009) or overlap (Chuine, 2000; Prats-Llinàs et al., 2019). It has been suggested that chilling and forcing periods overlap (Kamimori and Hosomi, 2024; Pope et al., 2014), so the overlapping approach gives greater physiological meaning to the models. Recently, the PhenoFlex modeling framework was developed by Luedeling et al. (2021), incorporating the Dynamic and Growing Degree Hour models (Anderson et al., 1986) as sub-models for chilling and heat requirements. This framework accounts for chilling and heat interactions using a sigmoid function that translates accumulated chill into heat effectiveness. This approach allows the expression of all gradations, from sequential to fully overlapping (parallel) progressions, in the accumulation processes of chilling and heat. PhenoFlex has been applied to spring phenology predictions for temperate woody perennials, such as apples and pears, demonstrating greater accuracy than existing phenology models (Luedeling et al., 2021). A budbreak prediction model developed using PhenoFlex based on phenology data of ‘Delaware’ in Osaka, Japan, showed high prediction accuracy (Kamimori and Hosomi, 2025) and the overlap of chilling and heat accumulation (starting from late January). PhenoFlex has proved to be a valid method for predicting the budbreak dates of grapevines. PhenoFlex can be implemented using the open-source chillR package in R (Luedeling et al., 2024).
The final part of this section describes the methods of parameter estimation (calibration) in phenology models: (1) a statistical approach (calibration using long-term phenology data under field conditions) and (2) an experimental approach (calibration using temperature treatment data under controlled conditions). While statistical approaches can quickly produce phenology models when sufficient phenology data are available, errors in phenology models tend to be large in the temperature range of extrapolation (Asse et al., 2020); therefore, it should be noted when using statistically calibrated models for other regions or future climate change impact assessments. Most spring phenology models for grapevines are calibrated using statistical approaches. However, the experimental approach allows for measurement of temperature responses across a broad range of temperatures using cuttings or seedlings incubated under temperature-controlled conditions. Consequently, experimentally calibrated models are expected to be suitable for predicting phenology across different regions and assessing future climate change impacts (Sugiura et al., 2024). However, measurements of the temperature response using an experimental approach are not always valid, and experimentally calibrated models may perform worse in actual field conditions or vice versa (Asse et al., 2020; Chuine and Régnière, 2017). This discrepancy may be due to daily variations not represented under controlled conditions and epigenetic or acclimation effects in the field (Chuine and Régnière, 2017). Therefore, the importance of combining the statistical and experimental approaches has been noted (Asse et al., 2020; Chuine and Régnière, 2017; Fila et al., 2014; Hanninen et al., 2019). Comparing parameters obtained from both approaches and interpolating or modifying them can help develop a more accurate and robust model. Table 1 summarizes the phenology models of grapevines referenced in this section.
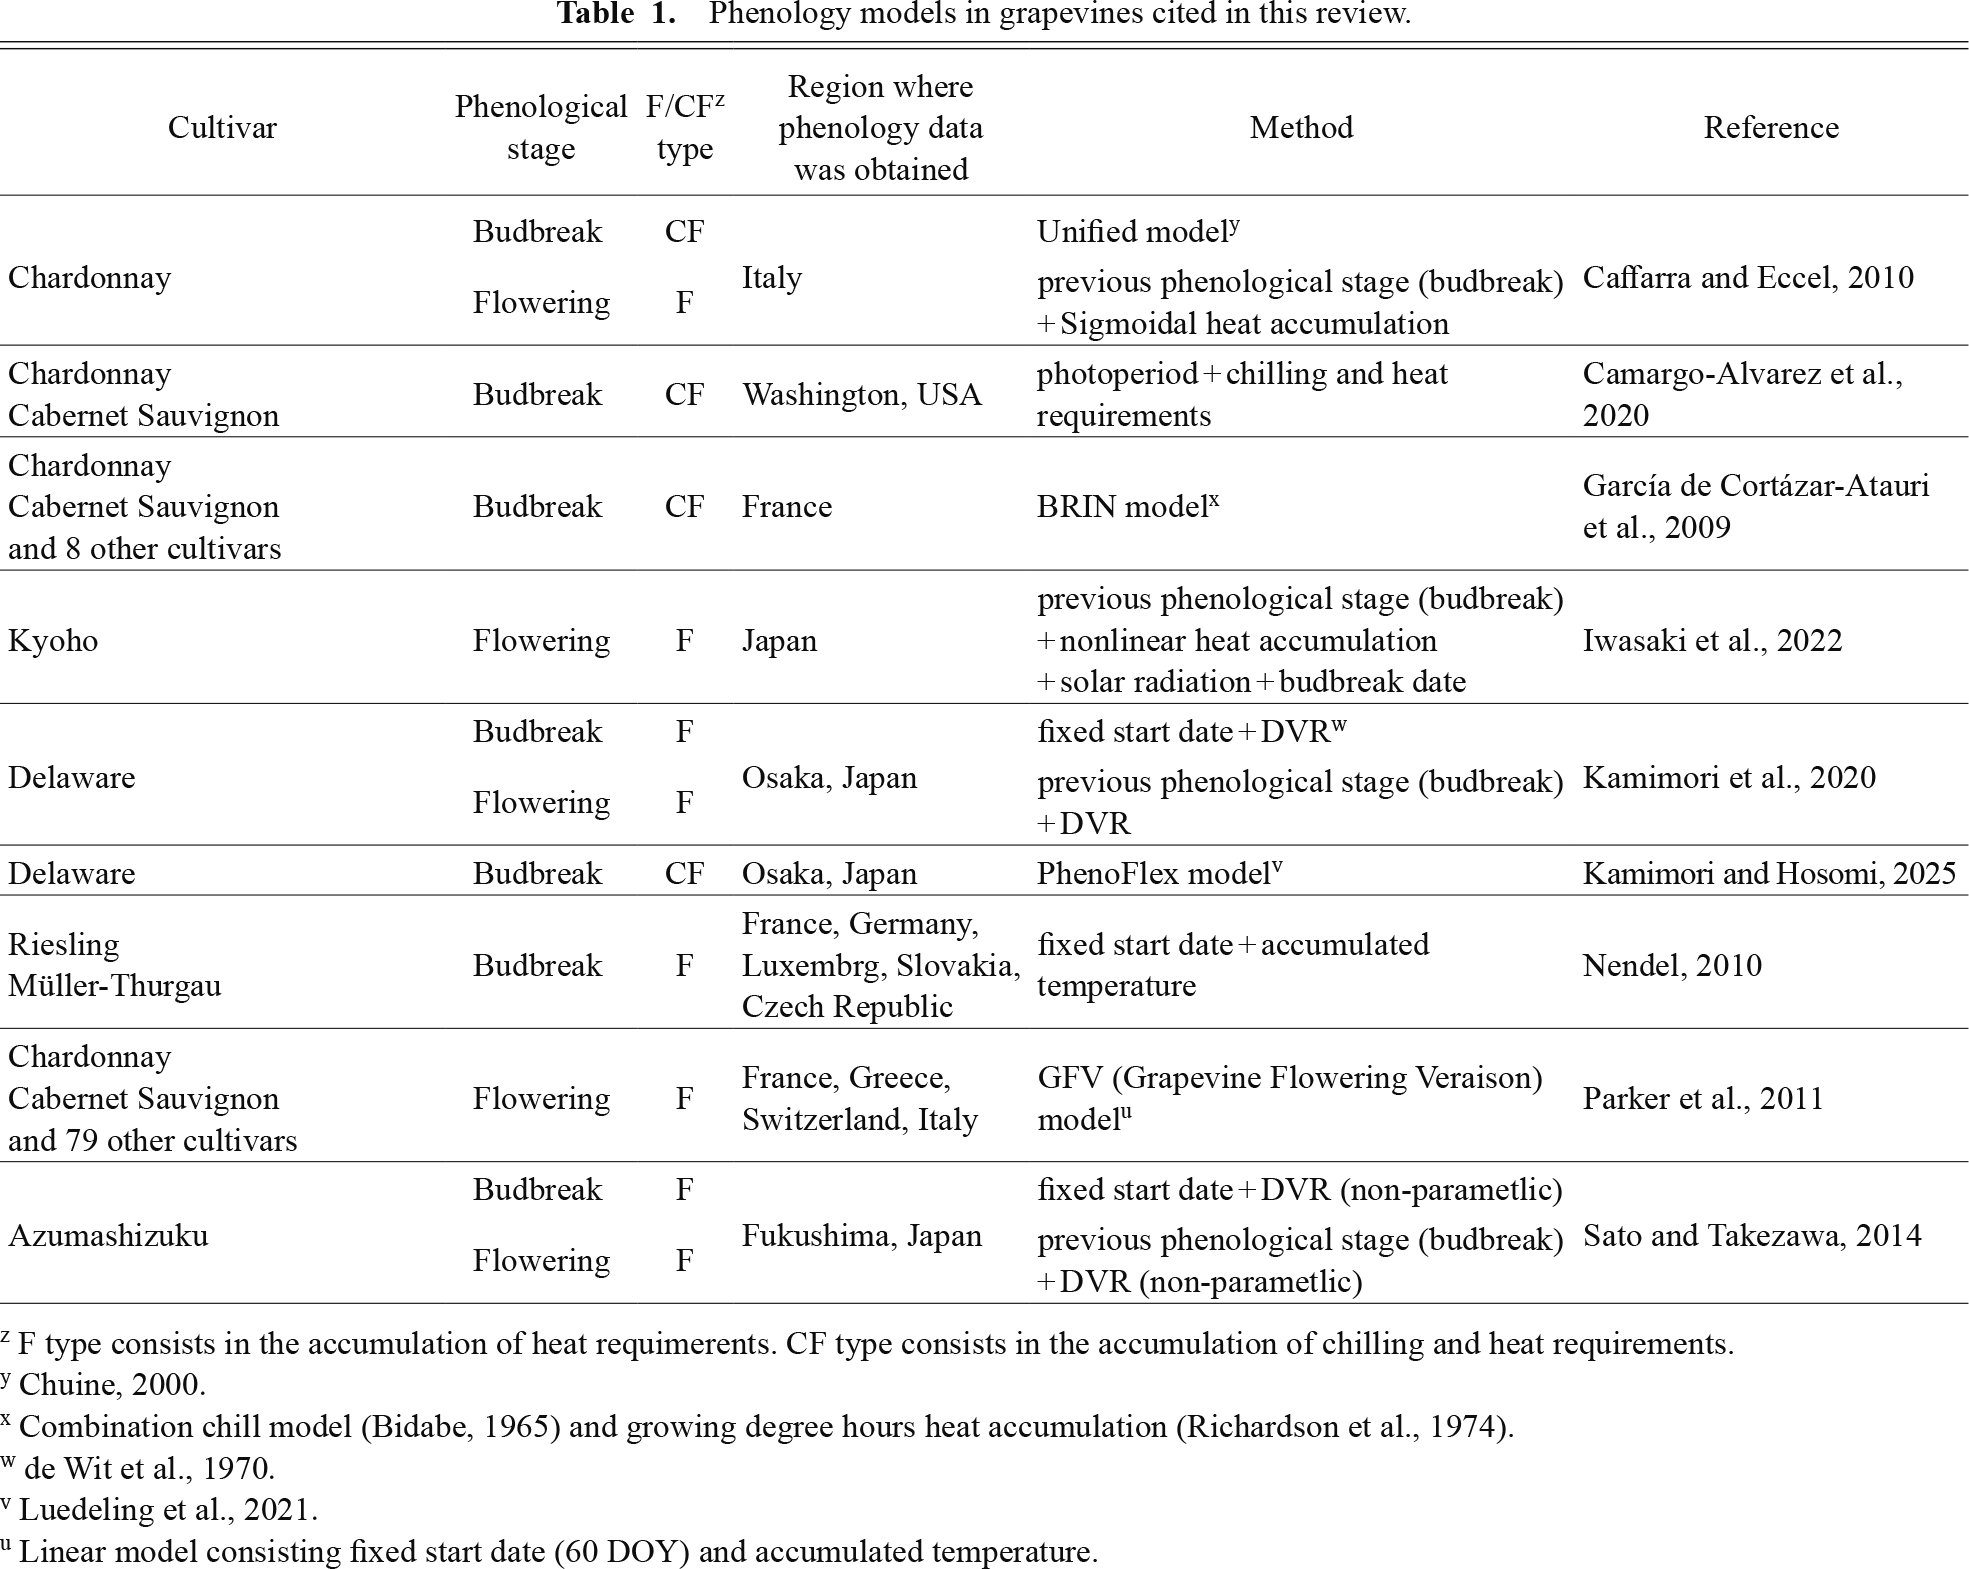
Phenology models in grapevines cited in this review.
Most studies assessing future climate change impacts on spring phenology in grapevines by applying future temperature scenarios to phenology models predict that the trend toward earlier spring phenology will continue (Caffarra and Eccel, 2011; Delelee et al., 2025; Duchêne et al., 2010; Fila et al., 2014; Kamimori and Hiramatsu, 2022; Webb et al., 2007). However, inadequate chilling is predicted in Japan after 2050 under RCP8.5 (a pessimistic scenario with very high greenhouse gas emissions) due to rising temperatures in fall and winter (Kamimori and Hiramatsu, 2022). Inadequate chilling causes delays and leads to decreased and non-uniform budbreak (Hirose et al., 2000; Lavee and May, 1997). Hence, changing the cropping type and efficiently using dormancy-breaking treatments are important for sustaining grapevine production.
The widespread use of high-resolution (1 km × 1 km) future temperature scenarios, such as AMGD-NARO (Ohno et al., 2016), has enabled the assessment of future climate change impacts at the prefectural and production area levels (Kamimori and Hiramatsu, 2022). While broad and long-term assessments (e.g., the second part of the 21st century) are preferred, more focused assessments targeting specific areas and shorter time frames (e.g., into the near future [approximately 2050]) may provide sufficient precision to evaluate future climate change impacts. Additionally, the cropping type and variety composition in grapevine cultivation vary widely among prefectures and production areas. Furthermore, temperature conditions can differ significantly even within the same production area due to variations in elevation and other factors. Thus, future climate change impact assessment at the prefectural or production area level will be useful for planning local adaptation measures.
Even in grapevines, developing a process-based phenology model has attracted interest and requires a better understanding of temperature responses. In particular, identifying chilling (endodormancy) and forcing periods (ecodormancy) and estimating chilling and heat requirements are useful for improving the phenology model of budbreak. However, in experimental methods, whether a bud is endodormant or ecodormant is primarily determined by evaluating its growth ability under favorable conditions. However, this method has not been standardized among researchers. Therefore, experimentally determing robust and comparable chilling and heat requirements remains challenging (Fadón et al., 2020).
Recently, Partial Least Squares (PLS) analysis (Luedeling and Gassner, 2012) has been successfully used to identify chilling and forcing periods and to estimate chilling and heat requirements based on long-term phenology and temperature records for many temperate woody perennial species (Benmoussa et al., 2017; Guo et al., 2015b; Luedeling et al., 2013; Martínez-Lüscher et al., 2017; Pertille et al., 2022). If long-term phenology data for at least 15 years (including meaningful variation in chill and heat accumulation necessary for PLS to work) from the same field or fields with very similar climatic conditions are available, a reasonable approximation of chilling and heat requirements can be quickly obtained using PLS analysis (Luedeling et al., 2013). Applying the phenology data of ‘Delaware’ in Osaka, Japan, to PLS analysis, the method effectively delineated the chilling period (mid-October to early February) and the forcing period (mid-January to budbreak). Additionally, the estimated chilling and heat requirements (Kamimori and Hosomi, 2024) were consistent with previous experimental studies (Hirose et al., 2000; Horiuchi et al., 1981). These findings contribute to the development of process-based models and can help guide physiological and genetic research by identifying different dormancy phases. PLS analysis can be performed using the open-source chillR package in R (Luedeling et al., 2024).
Long-term records of grapevine phenology provide valuable information on both plant phenology and practical grapevine cultivation. Furthermore, the use of long-term phenology data is expanding, including its application in estimating temperature responses during dormancy through recently developed statistical analytical methods. These amazing long-term data sets are expected to be maintained by Japanese research institutes (Sugiura et al., 2013) and should be utilized and shared.
Phenology prediction using the phenology models for ‘Delaware’ (Kamimori et al., 2020, 2021) are provided to grape growers on a website hosted by the author’s institution (http://www.kannousuiken-osaka.or.jp/nourin/gijutsu/techinfo_delaware/index.html) or by mailing list. It is possible to provide phenology predictions 2–3 weeks in advance that is comparable to the RMSE of each phenology model by using temperature forecast values from AMGD-NARO. When using mesh data generated by spatial interpolation such as AMGD-NARO, it is necessary to verify the difference in advance by comparing temperatures in mesh data with temperatures measured in actual vineyards (Ohno et al., 2016). If there is a temperature difference, mesh data should be corrected for more accurate phenology prediction.
Although developing a process-based phenology model for grapevines has generated interest, the process remains largely hypothetical (Kamimori and Hosomi, 2025; Luedeling et al., 2021). Advances in physiological and genetic research on dormancy are crucial for testing and revising these hypotheses. In Yoshino cherry trees (Cerasus × yedoensis ‘Somei-yoshino’), a genetically informed phenology model for dormancy release has been developed, incorporating the DORMANCY-ASSOCIATED MADS-box (DAM) (Yamane, 2014) genes as an indicator for the rate bud dormancy release (Miyawaki-Kuwakado et al., 2024). In grapevines, omics studies have been conducted to better understand the molecular mechanisms underlying dormancy (Shangguan et al., 2020; Shi et al., 2020; Smita et al., 2021). Gene expression, phytohormones, transcription factors, and other molecular regulators involved in dormancy progression should be identified. A future challenge is to incorporate these new dormancy findings into process-based phenology models.
The author thanks Dr. Akihiro Hosomi for providing valuable comments regarding this study. The author would also like to thank the staff of the Research Institute of Environment, Agriculture and Fisheries, Osaka Prefecture, who have collected consistent phenology data on the ‘Delaware’ grape over several decades.