Planning Assessment
A Multivariate Statistical Study of Dhaka’s Quality of Life Based on Residents’ Perception
2022 年 10 巻 2 号 p. 256-273
詳細
2022 年 10 巻 2 号 p. 256-273
Owing to rapid and uncontrolled urbanization and intense centralization, Dhaka has been experiencing extreme urban environmental and social problems in residents’ everyday lives. The purpose of the study is to understand the perception of the residents of Dhaka city and determine the quality of life from the perception of its citizens. Individual responses from 224 respondents have been evaluated qualitatively using the Likert scale method. The variables or as called dimensions influencing the livability of urban environment are studied under 8 domains- environment quality, social life quality, quality of health and education economic satisfaction, quality of transport and mobility, recreational quality, quality of utility services, governance quality. The subjective evaluation of QoL (Quality of Life) in Dhaka city has come out almost homogenous, respondents graded almost all the services to be Poor to Very Poor; especially negative feedback and judgments for almost all dimensions were observed among environment, utility service, transportation and government service relates issues. While analyzing using Principal Component Analysis (PCA), the variables had a higher correlation among themselves meaning maximum proportion of respondents had similar responses regarding these. These results indicate that Dhaka is far away from being a livable city where the quality of life is concerned despite having all modern amenities for the residents.
Quality of Life (QoL) is often identified using synonymous words and phrasings including ‘liveability’, ‘environment quality’, ‘satisfaction’, ‘standard of living’, ‘welfare of a population’, ‘wellbeing’ (Sultana & Asad, 2021; Ahmed, El-Halafawy, & Amin, 2019; Burton, 2014) . Fundamentally, it can be defined as the “the attributes of a community that affect its suitability for human living” where ‘suitability for human living’ depends on the context of the urban area. It is considered as a multi-faceted concept which often integrates interdisciplinary professional approaches with diverse factors of interests. Ley and Kaal viewed liveability as a proactive aesthetic, progressive, and humane policy which encouraged ‘diversified land use, community engagement, pollution control, green space preservation, neighbourhood aesthetics (Kaal, 2011; Ley, 1990).
On a much wider spectrum, QoL is described using multiple environmental and socio-economic factors that evaluate the basic welfare of individuals and societies. Sapena et al. (2021) evaluated QoL through multiple factors that comprises of living conditions, experience of life and employment (Sapena et al., 2021). Health, technical skills, education, environmental quality, security, social bondage, work life balance, civic participation, governance, and subjective well-being fall within the dimensions of QoL (OECD, 2013). This multidimensional nature of the QoL construct combines conceptual, empirical, spatial, and longitudinal domains which makes it easier to understand (Higgins & Campanera, 2011).
Three approaches which are explicitly used for describing the QoL and its causal elements include subjective, objective, and normative (Ballas & Dorling, 2013; Marans, R. W. & Stimson, R., 2011) approaches in the present literature. Subjective approach focuses on comprehending life integrated with qualitative singular dimensional aspects e.g., happiness and satisfaction; which are perceived by an individual (Douglas, Russell, & Scott, 2019; Leslie et al., 2010). On the contrary, objective approach is a conceptual approach which evaluates physical, environmental and social indicators (Apparicio, Séguin, & Naud, 2007). Normative outlook highlights the philosophical perspective of a decent life (Marans, R. W. & Stimson, R. J., 2011). (Serag El Din et al., 2013) scrutinized conceptually categorized into seven QoL dimensions concerning physical, psychological, social, environmental, mobility and movement, political, and economic viewpoints. These fundamental features are then classified into 30 intrinsic principles which can be practiced by communities in different combinations and blends to attain a certain quality life (Serag El Din et al., 2013). Liveability encompasses with several urban environment characteristics which increase competitiveness and ends up with increased attraction of a space (Norouzian-Maleki et al., 2015).
A liveable urban place should be secured, eco-friendly, clean (Lyndhurst, 2004), offer service opportunities to fulfill the needs, a good governance where the residents, the civil society, private sector, local government, and the central government work in harmony and decorum (UNDP, 2019), have a decent infrastructure, and economic feasibility (Wheeler, 2013; Hamilton & Atkins, 2008) . After the establishment of the core framework of a liveable community, it can incorporate personal independence which allows the inhabitants to grow old in peace and engage in community living and social activities (Lynott et al., 2018). If urbanization takes place while fulfilling the demands of the residents, then living standards will organically improve. Following the subjective pattern of thinking it is imperative to analyze the evaluation of the urban area from the perspective of the citizens. The expectations and the perceptions of the residents about their community, accessibility, safety etc. are a part of this multidimensional concept as well. Furthermore, equity, accessibility, dignity, participation, affability, empowerment, comfort, safety, walkability, transit etc. are some key indicators that provide substance to liveability (Ahmed, El-Halafawy, & Amin, 2019; Knox & Mayer, 2013; Balsas, 2004). The dwellers’ independence and social engagement should be ensured through suitable and affordable accommodation, affable community, and sufficient options for mobilityn (Kihl et al., 2005). Whether a place fulfills all the liveability requirements or not has been a matter of dispute for some time now.
Dhaka, being the developing and primate city of Bangladesh and one of the megacities of South Asia, acts as the epicenter of the centripetal forces of country. Most of the investment in the country happens in and around the capital city, leading to high employment opportunities, better education and health facilities, etc. This leads to rural to urban migration, aggravating the economy. Unfortunately, the city started off on the wrong footing when it came to balancing urban planning and quality of life. Urbanization can create economic and social inequalities which, in return, sanctions crime, anti-social activities, and social conflicts (Kundu & Gupta, 1996). It is evident that Dhaka has fallen victim to unplanned urbanization. The liveability ranking of Economist Intelligence Unit gave Dhaka a rating of 39.2 out of 100, which put Dhaka in the 138th place—third from the bottom (The-Daily-Prothom-Alo, 2018; Bank, 2018; Unit, 2017). This position of Dhaka in the global liveability ranking suggests that the policies haven’t been fruitful in sustaining urban development while maintaining QoL. When an under-planned city takes in a huge population, everything deteriorates including urban services and QoL (Ray, 2017). Therefore, understanding the progression of urban planning in Bangladesh is vital for understanding liveability and quality of life in Dhaka. Hence, going for a subjective approach instead of the objective one, will showcase the bigger picture of QoL. The objective of this study is to understand the perception of the residents of Dhaka city and discover the quality of life through the eyes of its citizens. The index chosen for this research highlights the general issues faced by the residents that hamper liveability and lead to lessen the quality of urban life quality and happiness for individual residents (Abdollahpour, Sharifi, & Ghazi, 2021). The flexibility of options enables each resident to point out their ideal liveability standards.
In order to measure the QoL of a specific urban location, researchers used econometric models in the context of amenities (Liu, 1977). Ben-Cheih Liu specified five factors for QoL index. Based on these, Sherwin Rosen identified the QoL index as an accumulation of house rents, wages, and facilities (Rosen, 1979). This approach of quantifying QoL was further developed by Roback as she built a model that ranked geographic units based on the differences in housing rents and wages (Roback, 1982). Based on similar principles from previous researches, 253 U.S. counties were ranked according to the QoL index for urban areas (Blomquist, Berger, & Hoehn, 1988). Others had taken a much different approach and tried to identify a relation between QoL and psychology (Carr et al., 2011; Campbell, 1976), and QoL and political guidelines (Milbrath, 1979). Each of the specific urban unit in this analysis can have an opposing understanding of QoL as well (Wish, 1986). This literature also suggested that future researchers should focus on combining multiple characteristics and variables of the study location, preferably a homogenous one.
As there is no ideal QoL index for evaluation, the best way to move forward is to use existing research as a guideline for measuring livability and urban development (Ahmed, El-Halafawy, & Amin, 2019). In most studies, researchers have used their self-made structures and urban contexts to assess livability in the broader domain of quality of life (Paul & Sen, 2018; Pacione, 2003). Every urban region has a separate set of variables that dictate QoL. As Inkeles suggested, the context of personal development and wellbeing is set by the society itself, by scrutinizing individual citizen’s components like education, employment, income, and so on (Inkeles, 1997). In accordance with that, (Psatha, Deffner, & Psycharis, 2011) identified 12 indicators measuring QoL in Europe, a developed region of the world. They hoped that these 12 categories could provide the much-needed structure to evaluate and rank urban areas for future research in this subject.
Widely accepted generalized urban livability assessment techniques, such as the Global Livability Index by The Economist Intelligence Unit (EIU), Mercer Quality of Living Survey, ‘Most Livable City Index’ by Monocle Magazine, BLI index of OECD, examine cities’ livability performance with ascending or descending orders worldwide (Vijayakumar & Sangeetha, 2021; Ahmed, El-Halafawy, & Amin, 2019; Setijanti et al., 2015). Monocle is a global affairs and lifestyle magazine; however, its Most Livable City Index is well-researched and includes 11 indicators to evaluate livability. These indicators are safety/crime, climate/sunshine, global connectivity, access to nature, architecture aesthetics and quality, urban design, medical aid, policy and tolerance development, public transportation, environmental concerns, and business condition. ‘Quality of living index’ by American asset management firm Mercer comprises 39 indicators categorized under 10 sections—health and medical considerations, political circumstances, social and cultural atmosphere, education facility, public transport service, habitat, natural condition, economic environment, commodity, and recreation. Mercer then labels the cities as intolerable, undesirable, uncomfortable, tolerable, and acceptable and, lastly, ideal. The EIU Global Livability Index uses five broad categories to rank urban regions across the globe. Healthcare, stability, education, infrastructure, culture, and environment are among the categories (Kashef, 2016). Additionally, evaluating regional and local planning policies may also be a possible procedure to determine livability (Herrman & Lewis, 2015).
Therefore, to evaluate QoL of Dhaka city, eight domains (environmental issues, recreational problems, utility and services, transportation and mobility problems, social issues, economic satisfaction, governance issues, health and medical services) have been scrutinized, assessing 45 dimensions (Table1). The subjective domains and dimensions (Table1) were chosen according to literature review in the urban and spatial context (Rajaei & Mansourian, 2017; Rezvani, Mansourian, & Sattari, 2013; Azami & Razavian, 2013; Zebardast, 2009).
| Domain | Dimensions |
|---|---|
| Environmental quality | Air quality, Water quality, Pleasant environment (smell), Tranquility (sound), Cleanliness |
| Social life quality | Social Cohesion, Amenities for disabled, Satisfying workplace, Impartial and unbiased approach, Sense of security, Amiable locality, Judicial system. |
| Quality of Health and education | Hospital accessibility, Ambulance services, Quality education, Modern medical amenities, Doctor’s attitude and cordiality, Hygienic food |
| Economic satisfaction | Employment opportunities, Income facilities, Affordable living, Opportunities for private investment |
| Quality of Transportation and Mobility | Transport adequacy, Affordable transport, Safe vehicles, Women and children friendly transport, Parking facility, Quality of road, Walkability, Traffic rules regulation |
| Recreational quality | Physical availability of parks, Quality neighborhood playgrounds, Adequate recreation centers (cinema hall, theatre), Restaurant facility |
| Quality of Utility Services | Gas supply, Power supply, Pure water availability, Drainage network and maintenance, Emergency response, Waste collection, Pest (mosquito) control, Public toilet facility. |
| Governance quality | Corruption free environment, Integration among authorities, Political situation |
Source: Developed by authors, 2020
Dhaka has been chosen as the study area. It is the capital and primate city of Bangladesh, which experienced tremendous growth in different fields and became the hub of economic, social, industrial, educational activities after the Liberation War of 1971. The level of urbanization went up to 29.1% in 2020, from 7.1% in 1972 (BBS, 2019). The city has 18 million residents (Ijjasz-Vasquez & Mason, 2018) . About 58% of Dhaka’s population (BBS, 2019) fall under the working age group to whom the city of Dhaka provides many economic, environmental, and social opportunities.; However, haphazard population growth has become a major challenge.
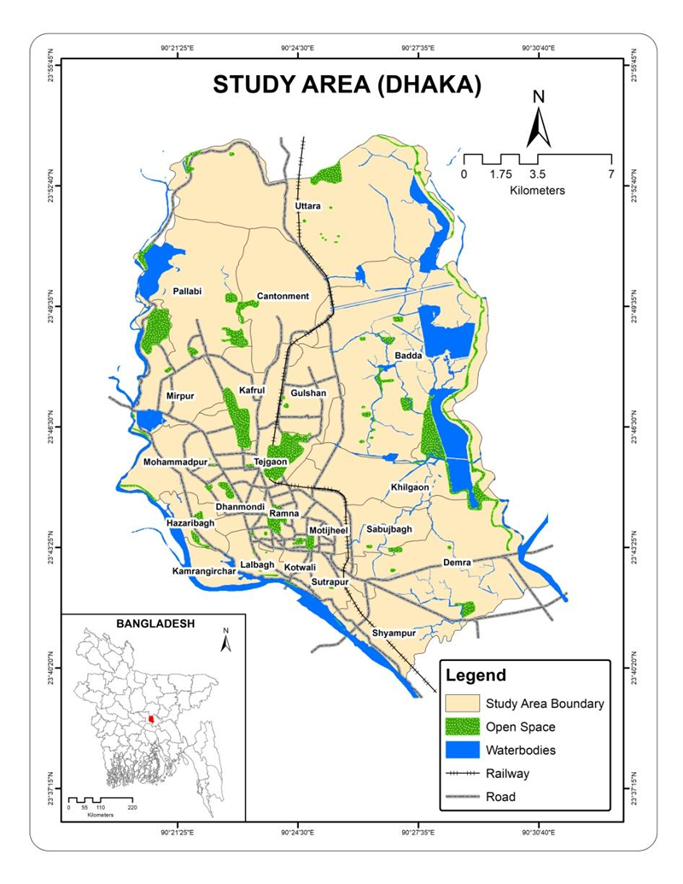
Figure 1. Study area (Dhaka city) (Developed by authors, 2020)
This empirical study is mainly based on primary data. Respondents from different locations in Dhaka Metropolitan Area have been chosen as samples. A survey is a usual approach for QoL measurement to collect information on individuals’ subjective assessment (Türksever & Atalik, 2001) in the form of self-appraisal of well-being, happiness, satisfaction, etc. (Santos & Martins, 2007; Costanza et al., 2007; Omuta, 1988). A questionnaire-based survey was executed, aiming to measure the QoL in Dhaka. Responses were evaluated in each QoL aspect using a Likert scale (Harpe, 2015; McCrea, Shyy, & Stimson, 2006). A 5-point Likert scale was used to rank— ranging between 1 (Excellent) and 5 (Very Poor) — the parameters mentioned in the questions. Using a random stratified sampling method, interviews were carried out among 254 residents of Dhaka, aged between 18 and 64 years (49.2% males and 51.8% female). The sample size (n=254) was primarily determined using a Sample Size Calculator (Confidence level = 99%, Margin of Error = 8%, Population size portion = 58%). However, owing to incomplete questionnaires, a few had to be omitted to increase accuracy, which led to a final sample size of 224. The age group of 20–29 years was the most abundant (80%) in the matrix, as this age group consists of major portion of the working age group population (more than 26%, BBS, 2019); followed by the age groups 30–39 years (11.1%), 18–20 years (4%), 40–49 years (2%), 50–59 years (0.4%), and above 60 years (2%). Before implementation, each item of the questionnaire was examined. A total of 30 pre-test questionnaires were handed out to select respondents. Relevant components were kept and irrelevant items were removed, corrected, or modified, in order to increase the survey’s reliability and validity.
Data AnalysisData collected from questionnaire surveys were digitized and analyzed using spreadsheets. In order to assess the internal reliability of each variable in the questionnaire, Chronbach’s Alpha Coefficient was used to ameliorate the reliability of the questionnaire. The threshold for the reliability of the questions ranged between 0 and 1, where α=0 represent no consistency, and α=1 stand for perfect consistency of the variables in the questionnaire. The reliability of the variables in the questionnaire was α=0.9, which implies a 90% variance in the score, which can be considered as reliable.
Principal Component Analysis (PCA) was implemented on the data matrix comprising a total of 50 variables (45 dimensions and five socio-economic parameters e.g., age, gender, marital status, education, monthly income). It is a multivariate statistical tool which reduces dimension of data composition, highlights dataset variables’ latent pattern i.e., correlation among a subset of variables and analyzing a large data matrix (Zambon et al., 2018). It is expressed as below:
PCA efficiency = Total Explained Variance (%)/{Number of Principal Components/Total number of input variables/dimensions)}
The component explaining the maximum proportion of variance explains the data closest to the original. Each component has included variables which correlate with each other comparatively more than with the rest. The extracted component interprets the large data matrix of variance and analyzes the complex relationship between the QoL dimensions, based on the socio-economic attributes of the respondents. The component loading of the data matrix describes the amount of correlation between variables and the extracted component. In a given analysis, PCA efficiency is measured by the ratio between explained variance and an eigenvalue greater than 1, which is extracted out of the input variables’ total whole number. A PCA efficiency value greater than 1 indicates that PCA has magnified with the data matrix and the value of more than 4 indicates an ample magnification power (Colantoni et al., 2015). Following these, the research aimed to quantify the dimensions and investigate their impact on the urban quality of life.
Haphazard rapid urbanization has led more people to face increased complexities resulting from the disharmonious pace of development around the city.
First Domain, the environmental issues, including the different environmental aspects that affect urban quality of life. The environmental problems of Dhaka city have been divided into five variables. A large number of responses are 4 to 5 on the Likert scale that presents very poor to poor levels of environmental pollution. On the basis of the empirical findings of this study, it can be said that people expressed their dissatisfaction about air quality (about 92.5%), followed by sound pollution (77.8%), cleanliness (68.4%), water quality (42.2%), and odor pollution (33%). According to the responses, about 98.2% of the respondent expressed their dissatisfaction about the environmental condition of Dhaka city, while the rest revealed disappointment.
Second Domain, social life quality, presents the process of socialization and observance of social norms that have an optimistic approach on the improvement of urban life standard. A large number of responses were either 4 or 5 on the Likert scale, signaling poor to very poor level of social life quality. More than 74% of the population felt that security is a major issue in Dhaka city. For social equity and justice, nepotism (45.8%) was identified as one of the major impediments by the residents, followed by workplace issues (32.4%) and social cohesion (32.4%). A mere 3.1% of the respondents were satisfied with the social condition of Dhaka city.
Third domain, quality of health, presents a stereophonic concept which involves physical, social, emotional, and mental functioning. Health and medical facilities are one of the basic needs of human beings; however, the health facilities of the residents are not equally distributed in Dhaka city. It sometimes favors the wealthy and privileged sections of the society. More than 77% of the population expressed their opinion regarding unhygienic food in the city. According to the responses, only 10.7% of the respondents of Dhaka city remain satisfied with health facilities, whereas 89.3% of the respondents showed dissatisfaction.
The fourth domain relates to urban economic growth that impacts the urban standard of living. The economic issues of Dhaka city have been divided into four variables. Employment crisis, inadequate income facilities, high living costs, and lack of public investment. Unsatisfactory economic issues degrade the urban living condition. Failure in the creation of adequate basic economic activity impedes economic stability by proliferating informal jobs with the absence of any regulatory management (about 62%). Neighbors in districts lack proper management for environmentally-sound housing and high housing rent often fails to provide proper accommodation for all income levels of people (70.2%). A mere 11.6% of the respondents are satisfied with the economic condition of Dhaka city.
Fifth domain, quality of transportation and mobility in Dhaka city, was assessed using eight variables. Based on this empirical study, respondents complained about improper and inefficient provision of transport services (82%) which result in haphazard road conditions and road accidents. Pavements in Dhaka cityare totally or partially usurped either by floating vendors or due to informal economic activities, with 72.9% of respondents ranking pavement availability as very poor. Only 3.6% of the respondents are satisfied with the transport and mobility facilities in Dhaka city.
Sixth domain, recreational quality, has been examined covering four variables. Recreation is related to life satisfaction and mental health. More than 80% of the respondents of the city expressed their dissatisfaction with the recreational opportunities. Specifically, dissatisfaction includes inadequate number of quality parks and open spaces, which were often considered as unsafe places. Planned neighborhoods are rare which resulted in the absence of children’s playground with proper sport facilities (74.7%). Among other variables, approximately 45% respondents were happy with the restaurant services and stated it as their only means of recreational facility.
Seventh domain, quality of utility services, is one of the crucial QoL aspects in urban setups. A total of eight variables have been assessed, among which multiple variables of utility services are under this category. Respondents expressed their dissatisfaction regarding pest control services (specifically that of mosquito) the most (81.3%), followed by access to public toilets (77.3%). Poor drainage facilities that need improvement on an urgent basis following the other existing utility problems (about 65%) e.g., water supply, gas supply, electricity supply and thus, promoting urban hazards.
The eighth domain, governance quality of Dhaka city, has been divided into three variables. Proper integration among primary stakeholders of the city is a must to ensure good urban governance. A corruption-free, equitable society is regarded as the most desirable (about 90%), followed by integration among the different authorities (82.6%). According to the responses, only 4.9% of the respondents are satisfied with the governance system in Dhaka city, and the rest remain dissatisfied with the system.
| Do-main | Variables | Likert Scale | Mean | Standard Deviation | Residents’ satisfaction (%) N=224 | |||||
|---|---|---|---|---|---|---|---|---|---|---|
| 5= Very poor |
4= Poor |
3= Fair |
2= Good |
1= Excellent | Satisfied |
Dis- Satisfied |
||||
|
|
Air quality | 92.5 | 6.2 | 1.3 | 0 | 0 | 19.3 | 4.4 | 98.2 | 1.8 |
| Water quality | 42.2 | 44 | 10.3 | 3.1 | 0.4 | 14.4 | 3.8 | |||
| Pleasant environment (Smell) | 32.9 | 53.8 | 11.6 | 1.3 | 0.4 | 13.8 | 3.7 | |||
| Tranquility (Noise) | 77.8 | 17.3 | 4.9 | 0 | 0 | 17.9 | 4.2 | |||
| Cleanliness | 68.4 | 26.7 | 4.4 | 0.4 | 0 | 17.2 | 4.1 | |||
|
|
Social Cohesion | 32.4 | 53.3 | 11.6 | 2.3 | 0.4 | 13.6 | 3.7 | 3.1 | 96.9 |
| Amenities for disabled | 52.9 | 36 | 10.3 | 0.4 | 0.4 | 15.5 | 3.9 | |||
| Satisfying workplace | 32.4 | 48.9 | 16.4 | 1.3 | 1 | 13.4 | 3.7 | |||
| Impartial and unbiased approach | 45.8 | 40.9 | 11.6 | 0.4 | 1.3 | 14.8 | 3.8 | |||
| Sense of security | 74.2 | 19.1 | 5.8 | 0.9 | 0 | 17.5 | 4.2 | |||
| Amiable locality | 23.6 | 46.2 | 24.4 | 3.1 | 2.7 | 11.8 | 3.4 | |||
| Judicial system | 24.9 | 52 | 19.6 | 2.2 | 1.3 | 12.4 | 3.5 | |||
|
|
Hospital accessibility | 34.7 | 48.4 | 13.3 | 2.7 | 0.9 | 13.6 | 3.7 | 10.7 | 89.3 |
| Ambulance services | 31.1 | 48.4 | 17.8 | 2.7 | 0 | 13.2 | 3.6 | |||
| Expense | 41.8 | 45.9 | 8.9 | 3.1 | 0.4 | 14.5 | 3.8 | |||
| Modern medical amenities | 60 | 31.1 | 6.7 | 1.3 | 0.9 | 16.2 | 4.0 | |||
| Doctors’ attitude and cordiality | 42.7 | 40 | 14.2 | 2.7 | 0.4 | 14.2 | 3.8 | |||
| Hygienic food | 77.3 | 17.8 | 3.6 | 0.9 | 0.4 | 17.8 | 4.2 | |||
|
|
Employment opportunities | 62.2 | 31.6 | 4.9 | 1.3 | 0 | 16.6 | 4.1 | 11.6 | 88.4 |
| Income facilities | 47.6 | 44 | 7.1 | 1.3 | 0 | 15.3 | 3.9 | |||
| Affordable living | 70.2 | 24.9 | 4.4 | 0.4 | 0 | 17.3 | 4.2 | |||
| Opportunities for private investment | 36 | 53.8 | 7.1 | 3.1 | 0 | 14.1 | 3.8 | |||
|
|
Transport adequacy | 44 | 39.6 | 12.9 | 2.7 | 0.9 | 14.4 | 3.8 | 3.6 | 96.4 |
| Affordable transport | 35.1 | 41.8 | 18.2 | 4.9 | 0 | 13.2 | 3.6 | |||
| Safe vehicles | 71.6 | 23.6 | 3.6 | 1.3 | 0 | 17.4 | 4.2 | |||
| Women and children friendly transport | 58.2 | 30.7 | 9.8 | 0.9 | 0.4 | 15.9 | 4.0 | |||
| Parking facility | 66.2 | 27.6 | 5.8 | 0.4 | 0 | 16.9 | 4.1 | |||
| Quality of road network | 61.8 | 28 | 8.9 | 1.3 | 0 | 16.3 | 4.0 | |||
| Walkability | 72.9 | 20 | 5.3 | 1.8 | 0 | 17.3 | 4.2 | |||
| Traffic rules regulation | 82.2 | 13.8 | 3.1 | 0.9 | 0 | 18.3 | 4.3 | |||
|
|
Physical availability of parks | 62.7 | 26.2 | 9.3 | 1.8 | 0 | 16.3 | 4.0 | 19.6 | 80.4 |
| Quality neighborhood playgrounds | 74.7 | 18.7 | 4.9 | 0.9 | 0.9 | 17.5 | 4.2 | |||
| Adequate recreation centers (cinema hall, theatre) | 34.7 | 43.1 | 16 | 5.8 | 0.4 | 13.2 | 3.6 | |||
| Restaurant facility | 18.2 | 36 | 31.1 | 9.3 | 5.3 | 10.0 | 3.2 | |||
|
|
Gas supply | 27.1 | 44 | 21.8 | 4.4 | 2.7 | 12.1 | 3.5 | 16 | 84 |
| Power supply | 11.6 | 33.3 | 37.8 | 13.6 | 3.6 | 8.9 | 3.0 | |||
| Pure water availability | 36.4 | 37.3 | 20.9 | 3.6 | 1.8 | 13.1 | 3.6 | |||
| Drainage network and maintenance | 64.9 | 27.1 | 6.2 | 1.3 | 0.4 | 16.6 | 4.1 | |||
| Emergency response | 57.3 | 34.2 | 6.7 | 1.8 | 0 | 16.0 | 4.0 | |||
| Waste collection | 52.4 | 33.3 | 11.6 | 2.7 | 0 | 15.2 | 3.9 | |||
| Pest (mosquito) control | 81.3 | 12.4 | 4.4 | 1.3 | 0.4 | 18.0 | 4.2 | |||
| Public toilet facility | 77.3 | 18.7 | 2.7 | 1.3 | 0 | 17.9 | 4.2 | |||
|
|
Corruption free environment | 89.7 | 7.6 | 1.8 | 0.9 | 0 | 19.0 | 4.4 | 4.9 | 95.1 |
| Integration among authorities | 82.6 | 15.2 | 1.3 | 0.9 | 0 | 18.4 | 4.3 | |||
| Political situation | 68.3 | 20.1 | 8 | 2.7 | 0.9 | 16.6 | 4.1 | |||
Dhaka being one of the developing cities in Bangladesh, offers a variety of facilities to its residents which is far greater compared to other parts of the country. But even so, the city itself hasn’t been able to deliver on the promises of a ‘Mega City’. Based on the research, it’s lagging behind on multiple fronts. Respondents were requested to evaluate their levels of satisfaction by rating the domains of life chosen for this study. This helped to assess the responses for each of the domains along multiple attributes. The residents of Dhaka consider environment to be poor in nature, as pollution has become an everyday nuisance. Figure 2 clearly displays that social and economic situation is also in the very poor and poor regions of the axes. Transport- and health-related infrastructure and facilities are perceived to be poor in comparison as well. On the contrary, recreation and utility services in the city are perceived to be comparatively better than the other domains. In the context of urban landscape, respondents also pointed to the beautification and maintenance of the public space.

Figure 2. Resedent’s perception about quality of life in Dhaka City
(Developed by Authors, 2020)
Table 3 demonstrates the result of PCA for the complete respondents’ sample, considering 50 dimensions. The data matrix in the explained variance is 35% and an eigenvalue in each component is extracted as greater than 1. PCA efficiency of this analysis is 5.83 which is greater than 4, indicating an ample magnification power. Axis 1 represents the dominant dimensions in urban areas, however, considerably uncorrelated with the respondents’ socio-economic profile. About 21% of the total variance in data matrix remains in Component 1, whereas components 2 and 3 comprises of nearly 8% and 7% of the total variance. When the total number of variables (n=45) is considered, this proportion is considered quite high.
In the analysis, Components 2 and 3 were identified as specific dimensions that were found to be highly variable in different population segments, unlike Component 1. Through Component 1 it was evident that most of the variables from each domain correlate with each other, especially among the domains ‘Utility and services’, ‘Health and medical services’ and ‘Transportation and mobility problems.’ The highest correlation i.e., similar responses were obtained for variables/dimensions like Inadequate waste collection, Shortage of public toilet, Unhygienic food, Lack of safety and security in vehicles, and Absence of walkability. Along with the subjective dimensions, ‘Gender’ also correlates with the aforementioned variables. As Component 1 explains maximum variance (21% out of 35% total variance), the included variables can be used to represent the data closest to the original, in other words, respondents are more equal about these variables (Figure 3).

Figure 3. Biplot of a Principal Component Analysis
| Dimensions | Component1 | Component2 | Component3 |
|---|---|---|---|
| Air quality | 0.45 | ||
| Water quality | 0.29 | ||
| Pleasant environment (Smell) | 0.49 | ||
| Tranquility (Sound) | 0.51 | ||
| Cleanliness | 0.58 | ||
| Social Cohesion | 0.43 | ||
| Amenities for disabled | 0.33 | ||
| Satisfying workplace | 0.38 | ||
| Impartial and Unbiased approach | 0.44 | ||
| Sense of security | 0.61 | ||
| Amiable locality | 0.37 | ||
| Judicial system | 0.33 | ||
| Hospital accessibility | 0.53 | ||
| Ambulance services | 0.47 | ||
| Quality education | 0.46 | ||
| Modern medical amenities | 0.50 | ||
| Doctors’ attitude and cordiality | 0.44 | ||
| Hygienic food | 0.66 | ||
| Employment opportunities | 0.48 | ||
| Income facilities | 0.46 | ||
| Affordable living | 0.53 | ||
| Opportunities for private investment | 0.37 | ||
| Transport adequacy | 0.39 | ||
| Affordable transport | 0.45 | ||
| Safe vehicles | 0.67 | ||
| Women and children friendly transport | 0.50 | ||
| Parking facility | 0.47 | ||
| Quality of road network | 0.53 | ||
| Walkability | 0.62 | ||
| Traffic rules regulation | 0.56 | ||
| Physical availability of parks | 0.38 | ||
| Quality neighborhood playgrounds | 0.42 | ||
| Adequate recreation centers (cinema hall, theatre) | 0.46 | ||
| Restaurant facility | 0.46 | ||
| Gas supply | 0.38 | ||
| Power supply | 0.42 | ||
| Pure water availability | 0.38 | ||
| Drainage network and maintenance | 0.59 | ||
| Emergency response | 0.61 | ||
| Waste collection | 0.67 | ||
| Pest (mosquito) control | 0.54 | ||
| Public toilet facility | 0.62 | ||
| Corruption free environment | 0.60 | ||
| Integration among authorities | 0.59 | ||
| Political situation | 0.51 | ||
| Correlation of individual variables with components evaluating respondent’s socio economic profile | |||
| Gender | 0.12 | ||
| Age | 0.74 | ||
| Education | 0.73 | ||
| Income | 0.66 | ||
| Marital status | 0.60 | ||
| Explained variance (%) | 21% | 8% | 7% |
Modern researchers tend to use QoL as an ingredient for better understanding the well-being of the population of a specific location. Subjective variables integrated with socio economic indicators concerning QOL are mandatory to perceive a more exploratory analysis of different dimensions of urban livability in order to establish their significance (Marans, 2015; Diener & Suh, 1997). To determine quality of life aspects at different spatial scales i.e., urban, rural and others, both conceptual and practical approaches along with synthesized variables and coherent methodologies are indispensable for a clear analysis (Salvati et al., 2018; Diener & Suh, 1997; Allison, Locker, & Feine, 1997; Dasgupta & Weale, 1992). Considering the special case of Dhaka City, what are the variables needed to consider for this evaluation framework and the priorities rank have been examined using people’s perception. On an average, about 91.5 % of the respondents revealed high dissatisfaction with their city. About 3% of the respondents were highly satisfied and 5.5% were neutral about the situation.
The multivariate statistical analysis developed in this study insight a genuine interpretation of the QOL complexity of Dhaka, identifying different variables which have received a transversal and homogenous feedback among all the components of the city. The variables that are analyzed in this study are separated from a group of QoL variables which have been perceived by the city residents. The underlying idea is to evaluate the overall urban society, including multiple social, economic, environmental factors through the eyes of the citizens. Taken all these factors together, the subjective evaluation of QoL in Dhaka city has come out very poor; especially negative feedback and judgments for almost all variables were observed among different socio-economic contexts.
Among the subjective variables mentioned in the paper, we see that most of the population was dissatisfied with the current services; they graded almost all the services to be Poor to Very Poor. In PCA, the variables with higher correlation with Component 1 are the ones regarding which maximum proportion of respondents had similar responses. Tackling those issues at first or earlier might be helpful for the majority of the urban population. Such issues mostly fall under the domains of utility services, transportation, and health issues. It is understandable from the evident shortage of public toilet, unhygienic food, lack of road security, mismanagement in waste collection etc. Another variable correlating with these is gender, as women in the society are still discriminated against and cannot enjoy their rights equally as their counterparts.
According to environmental Kuznets curve (Kuznets, 1955), rapid urbanization motivated towards economic growth creates income inequality which leads to social separation between poor and wealthy classes. Poor institutional arrangement of housing often results in environmentally low-quality housing with limited social inclusion among different social groups. Artificial land scarcity, promoted by land speculators and developers, creates high land value which excludes low-income people from the affordability to live in any part of the city. Walkability is considered as a key element in achieving resilient and sustainable urban design and strong communities (Hellberg, Guaralda, & Rinchumphu, 2021). Unfortunately, the city lacks adequate provisions to facilitate the residents. Absence of enough healthcare centers and low-quality treatment often fails to meet ever increasing demand of medical facilities for the city dwellers. As living in linear urban metabolism, people are exposed to dirty environments caused by haphazard dropping of wastes here and there. These findings indicate that Dhaka, the primate city of Bangladesh in urban hierarchy, is an unlivable place as far as quality of life is concerned, despite having all the modern amenities for its residents. QoL directly impacts the livability of cities for its citizens through a collection of matrices (Carr et al., 2011) that enables the policy makers to scrutinize the usefulness of their strategies (Marans, 2015) . Attention should be paid to improve specific quality of life aspects, especially transportation and environmental aspects. Policy makers, planners, and development authorities have to have proper understanding of the sectors in which they are lagging behind and which sectors they need to work on, according to the city’s residents’ perceptions.
Any development activity needs to ensure inclusive betterment as several layers of stakeholders are associated with its upcoming consequences, weighing every generic portion’s demand perception. The purpose of this research is to understand the perception of the residents of Dhaka city and find out the quality of life from the point of view of its citizens by explaining the results of the index on common problems faced by residents that hinder the livability and flexibility of choice allowing each resident to demonstrate an ideal standard of living. This will allow the government to plan its development projects, policies, and future infrastructure, according to the residents’ needs. To increase attractiveness of the city, these identified problems need immediate resolutions with proper following of community guidelines and development goals. It needs to be prioritized in urban planning and policies, as urban dwellers want these to be resolved with utmost importance.