Abstract
At present, Japan is facing the problem of increasing medical demands caused by an aging society. The imbalance between supply and demand makes the efficiency of medical services particularly important. In this context, a new medical facility, medical malls, has emerged in recent years. Different from independent clinics, the medical mall is a facility that integrates multiple medical functions and provides multi-disciplinary treatments for patients. In order to verify the effectiveness of this new medical facility and explore its relationship with the urban environment, this paper first identifies the medical malls in Fukuoka City and studies their characteristics, then the SBM model was used to calculate the medical efficiency of the clinics in the 75 medical malls, compared with the independent clinics. Finally, the research analysed the spatial distribution of the medical mall efficiency and the spatial regression with the surrounding urban environment. The results show that the medical mall is a more efficient facility, and population density of the young and the working-aged, the number of main roads, total construction area, the proportion of residence and commerce, and the number of the other medical facilities have significant impacts on the medical efficiency. This research proposes a method to evaluate the effectiveness of utilization of medical resources. Through the evaluation of medical efficiency and the analysis of the urban environment affecting efficiency, this paper provides data support for the site selection of medical malls and the rational layout of urban medical facilities.
Introduction
Japan has the most aging population in the world. The population aging rate reached 28.8% in 2020 and is expected to reach 38.4% in 2065 (Cabinet Office of Japan, 2020). The aging problem continues to intensify, increasing the demands for medical care. However, the number of doctors per capita in Japan is far lower than that of developed countries. The number of practising physicians per thousand population was 2.49 in 2018 (OECD.Stat, 2019), ranking third from the bottom among the OECD countries. Insufficient supply but increased demand poses a challenge to Japan's health care. In order to effectively allocate medical resources, the Japanese government implements a hierarchical diagnosis and treatment system. Among them, primary medical care undertakes the tasks of disease treatment and health management closely related to daily life, which are mainly carried out by clinics and general hospitals. According to a survey on medical facilities by the Ministry of Health,Labour and Welfare (2019), the number of clinics was about 14 times that of general hospitals. Nevertheless, because physicians in Japan are almost all specialists and there are few general practitioners, most of the clinics they operate are specialized clinics focusing on a single diagnosis and treatment subject. This means that it is difficult for one clinic to meet multiple medical needs at the same time, which needs to be realized by referral. In this context, the number of medical malls that set up multiple clinics in the same place and enable people to receive various treatments at the same time is gradually increasing.
Facing the contradiction between the release of medical service demands and the shortage of medical resources brought by the aging society, it is very important to improve the efficiency of medical facilities. Because the medical mall integrates a variety of medical resources, it’s considered to be more effective in primary health care. On the one hand, the brand effect and influence produced by the clinics’ aggregation in the medical mall are more likely to attract more people to come for medical treatment, to make full use of the medical resources such as the medical workers, equipment, sickbeds, and so on. Additionally, there is a variety of diagnosis and treatment departments concentrated in one medical mall, so the patients can carry out multiple examinations and one-stop treatment in a short time, saving time and cost. Some studies have quantitatively calculated the efficiency of medical facilities and medical services (Ozcan & Luke, 1993; Hollingsworth, 2008; Tiemann & Schreyögg, 2012; Ogawa & Kubo, 2005). Their research object was hospitals, and efficiency evaluation mainly focused on economics and management. There is a lack of research on medical efficiency by measuring the relationship between human resource and patients. Meanwhile, it is necessary to quantitatively evaluate the efficiency of primary medical institutions such as medical malls and clinics. The scarcity of medical resources determines the importance of optimal allocation. By calculating the efficiency, we can evaluate the utilization of medical resources in a medical institution, so as to provide a basis for the adjustment and redistribution of medical resources. The ultimate goal is to reduce regional differences and achieve medical equity through efficient utilization and rational allocation of medical resources.
The essence of medical facilities is to provide medical services for patients in need and solve the problem of supply and demand in the area where the clinic is located (Xu, Zhao, & Yamamoto, 2020). There are many effects on the medical resource allocation (Song et al., 2019), in which the demographic factors are generally considered to be related (Tanihara et al., 2011). With the aging process, the demand for medical services will increase rapidly (Lopreite & Mauro, 2017; Hashtarkhani et al., 2020), and the change of population structure will have an impact on medical efficiency. In the process of using medical facilities, traffic accessibility determines the degree of difficulty (Luo & Wang, 2003), and then affects the choices of patients. Similarly, the location, land use, and surrounding medical facilities will also affect the choices of patients, thus affecting medical efficiency. Therefore, the efficiency of medical facilities is affected by the surrounding urban environment, mainly including three aspects: the demographic structure, location and transportation, and building usage. In terms of the medical mall, from the perspective of urban planning and management, existing studies have shown that the location, surrounding community population and traffic conditions are key to the success of the medical mall. Building medical malls in densely populated areas such as near stations with more passengers, near a commercial district, large-scale community or the supermarket, and so on, can play a significant role in receiving more patients in a shorter time. However, building a medical mall in an urban center may make it difficult to reduce rent and operational costs. In addition, nearby clinics may form a competitive relationship with them, resulting in it being difficult for a medical mall to attract more patients (Tsumita & Yasuaki, 2016). The urban environment of the medical mall has an impact on its efficiency, however, whether the impact is positive or not, as well as the extent of the impact, are not conclusive and need to be further verified. Therefore, this paper aims to verify whether the medical mall is efficient and effective, and the relationship between its efficiency and the urban environment.
Methodology
Research process
In order to solve the questions mentioned, this work conducted the following research taking Fukuoka City as a case. First, we sorted the clinics in Fukuoka City and identified 75 medical malls. In order to have a comprehensive understanding of the medical mall, we studied the current situations, mainly including their opening time, scale, location, and composition. Then, after a comparative study of the efficiency evaluation models, the Slacks-based Measure (SBM) model was used to calculate the medical efficiency of 146 Medical mall clinics and 876 non-medical mall clinics. This paper took the number of physicians and the other medical professionals as two kinds of inputs and the average number of patients per day as the output to measure the technical efficiency of medical facilities from the perspective of medical personnel resources. By comparing the efficiency performance between the two kinds of clinics, we could determine whether the medical mall is efficient. Finally, this paper studied the distribution characteristics of the efficiency of medical malls. Through spatial regression analysis of the efficiency value and the urban environment elements around the medical mall, the main influence factors explaining the efficiency of the medical mall were identified.
Research area and data collection
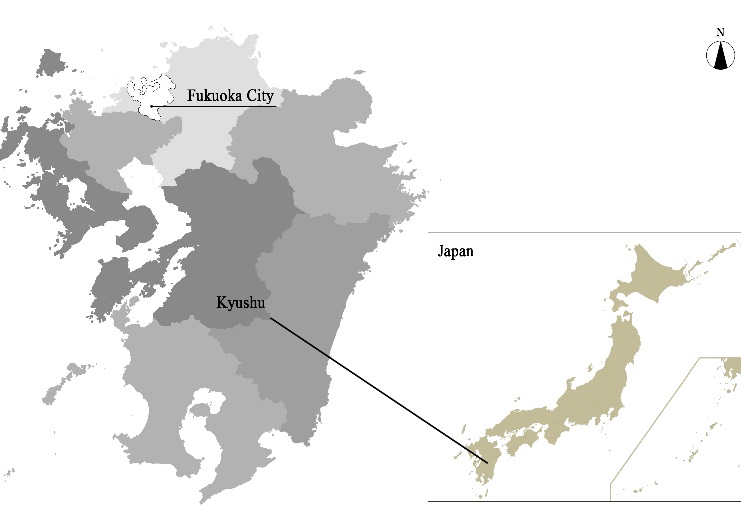
This research takes Fukuoka City (Figure 1), the capital city of Kyushu, Japan as the research area. The database built for the research can be divided into two parts: the data of the medical facilities and the data of the urban environment.
According to the list of the medical institutions of the Kyushu Regional Bureau of Health and Welfare, we collected the information of the clinics (including the general clinics and the dental clinics), pharmacies, and other medical facilities. The available information included the name, address, opening time, main diagnosis and treatment department, etc. of the medical institution. In addition to the above basic property data describing the characteristics of medical facilities, the paper also needs the human resource data of clinics to calculate efficiency. These data came from the Healthcare Market Analysis Platform whose original information was from the Fukuoka Medical Information Network, which were collected in February 2020. The data relating to the urban environment used in this research can be summarized into three aspects. The original data of the demographic structure includes the resident population and the daytime population, which come from the 2015 Population Census and Nippon Statistics Center respectively. These data take the Shi, Ku, Machi, and Mura as the statistical area units in Fukuoka City. The data of transportation are obtained from the National Land Information Division, National Spatial Planning and Regional Policy Bureau, Ministry of Land, Infrastructure, Transport and Tourism (MLIT) of Japan. The building usage data come from the Basic Survey of Urban Planning of the MLIT.
Efficiency is an important index to measure the relationship between input and output. It evaluates the performance of the object and reflects whether the resources are fully utilized (Farrell, 1957). There are several methods to evaluate efficiency such as Stochastic Frontier Analysis (SFA), Data Envelopment Analysis (DEA), Technique for Order of Preference by Similarity to Ideal Solution (TOPSIS), and so on. Compared with other efficiency evaluation methods, DEA does not need to confirm the functional relationship between input and output in advance, nor does it need to estimate parameters. DEA is a linear programming model built by input and output, and constitutes the production frontier against which all Decision Making Units (DMUs) are compared. For the DMUs who provide similar services, the efficiency values refer to their relative positions at the professional level. It avoids the subjective factors of efficiency evaluation results, so it is currently the most widely used and most acceptable method. DEA is used in education, finance, medical and health care, transportation and so on (Boussofiane, Dyson, & Thanassoulis, 1991; Li, Zhao, & Yuan, 2016). In the field of medical and health care, it is currently used for comparison between hospitals, whose content mainly focuses on management methods, operating costs and incomes, and disease treatment (Chern & Wan, 2000; Kontodimopoulos, Nanos, & Niakas, 2006; Vitikainen, Street, & Linna, 2009).
There are many DEA models, among which the traditional DEA models are the CCR model (Charnes, Cooper, & Rhodes, 1978) and the BCC model (Banker, Charnes, & Cooper, 1984). These two traditional models are under constant returns to scale (CRS) and variable returns to scale (VRS) respectively, and measure the overall efficiency and technical efficiency separately. However, CCR and BCC models are radial models whose input and output are reduced or enlarged keeping the same proportion, so they are ideal models (Cook & Seiford, 2009). Different from the traditional DEA model, the SBM model (Tone, 2001) is a non-radial analysis method based on the slack variables, which is more in line with the actual situation. Because the efficiency of the medical mall discussed in this paper measures the relationship between medical staff and patients, that is, technical efficiency, this paper adopts the SBM model based on the VRS.
The nDMUs in this research are the clinics whose input and output are represented by x and y. This paper takes the number of physicians and the other medical professionals, including nurses, midwives, and therapists, as two inputs. The average number of the patients, including the inpatients and outpatients, per day is taken as the output. The matrices of the inputs and output are X and Y respectively. The production possibility set(P)is defined as:
P
=
{
(
x
,
y
)
|
x
≥
Xλ
,
y
≤
Yλ
,
λ
≥
0
}
(1)
Based on the VRS, there are some constraints that
∑
i
=
1
n
λ
i
=
1
.
The optimization function value of
m
e
is the efficiency of the DMU
(
x
0
,
y
0
)
by solving the following linear program:
minimize
m
e
=
1
−
s
−
/
x
0
1
+
s
+
/
y
0
(2)
subject to
x
0
=
Xλ
+
s
−
, (3)
y
0
=
Yλ
−
s
+
,
λ
≥
0
,
s
−
≥
0
,
s
+
≥
0
where
s
−
and
s
+
are the slacks of excess input and insufficient output.
Xλ
and
Yλ
are the input and the output on the production frontier. Based on the SBM model, the efficiency value satisfies 0
<
m
e
≤
1
, if and only if
s
−
=
s
+
=
0
,
m
e
=
1
, that is, the DMU
(
x
0
,
y
0
)
is on the production frontier.
Spatial regression
Medical malls and the urban environment elements have spatial attributes. The traditional regression model based on the premise of independence and randomness only considers the attributes of the data and does not consider its spatial location, so it cannot more truly reflect the relationship between medical mall efficiency and urban environment elements. Therefore, this paper used the spatial regression considering the spatial relationship, so as to more accurately explain the influence of various factors. The following is a general form based on the Ordinary Least Square (OLS) model (Anselin, 1988):
m
e
=
α
+
ρ
W
1
m
e
+
βU
+
μ
(4)
μ
=
λ
W
2
μ
+
ε
(5)
where
m
e
is the efficiency of the medical mall;
U
is the matrix of the urban environment elements which are the influence factors of the medical efficiency;
ρ
is the spatial autoregression coefficient, which indicates the influence of the medical mall efficiency on its neighbours;
W
1
and
W
2
are the spatial weight matrices of the medical efficiency and the random error respectively;
β
is the regression coefficient of the urban environment elements to be estimated;
μ
is a random error term;
λ
is the spatial autocorrelation coefficient, which represents the interaction effect between error terms; and
ε
is the error term with normal distribution.
Spatial Lag Model (SLM) and Spatial Error Model (SEM) are widely used in spatial regression analysis. When ρ≠0, β≠0, λ=0, it follows the SLM. This model assumes that the explained variables have a spatial correlation effect, that is, the medical efficiency is affected by the efficiency of adjacent spatial units. When ρ=0, β≠0, λ≠0, it follows the SEM. The model assumes that the error terms of explanatory variables have a spatial correlation. The errors of explanatory variables affect the errors of its neighbours and then have an influence on the medical efficiency.
Basic information of the medical mall
Definition of the medical mall
The concept of the medical mall was first proposed in the United States, and it mainly refers to the re-planned shopping centre or retail space that is mixed with medical functions (Uscher-Pines, Mehrotra, & Chari, 2013). In Japan, medical malls began to appear in the 1990s and were widely regarded by 2000. Ito (2010) defined the medical mall as a collection of three or more medical functional units which included more than two clinic functional units in the same building or in the same physical space. Medical functional units are the clinic functional units, pharmacies, visiting nursing and other medical related functions. The clinic functional units are divided into general clinics and dental clinics. Besides that, there are also some non-medical functional units, such as offices. Tsumita and Yasuaki (2016) considered that the medical functional units of the medical mall could also be located in close physical space, not necessarily in the same building. The medical malls in the United States and some Asian countries including China and Singapore are mostly commercial and medical complexes with a large scale. Different from that, a large number of the medical malls in Japan are mainly in the form of clinic groups. It means that compared with other countries, Japan’s medical mall is not only smaller in scale, but also more definite and clearer in composition. In this paper, the medical mall is defined as a group of more than three medical functional units formed spontaneously or organized in the same building or site, with the clinic as the main function (Figure 2).
Through determining the locational relationship of these medical functional units one by one, 75 medical malls that meet the definition were identified in Fukuoka City. The first medical mall opened in 1995, which was a building with two general clinics and one pharmacy. From then on, the number of medical malls had increased slowly (see Table 1). Starting from 2000, the number of medical malls began to increase more steadily, at a rate of 2.6 per year. Five new medical malls were opened in 2007, which was the year with the largest increase in the stable growth stage. Since 2011, rapid growth has occurred for the development of the medical mall. On average, there were more than four medical malls established each year. It is worth mentioning that, since the origination of the medical mall, 2019 has been the year where the most effort was made in the development of the medical malls. There were seven medical malls opened in that year.
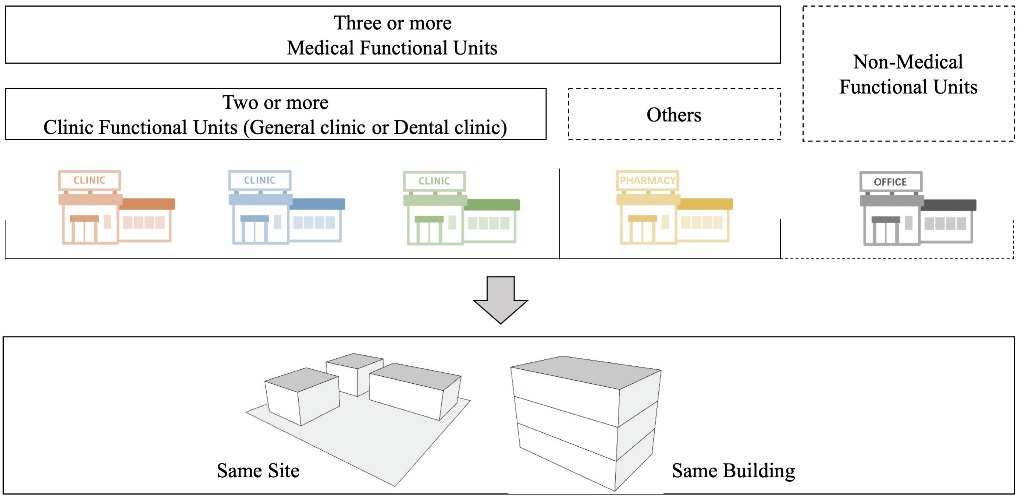
Table 1. Growth in the number of medical malls in Fukuoka City
| Stages
|
Period
|
Number
|
Annual Rate
|
| Slow growth |
1995-2000 |
6 |
1 |
| Stable growth |
2001-2005 |
13 |
2.6 |
| 2006-2010 |
13 |
2.6 |
| Rapid growth |
2011-2015 |
21 |
4.2 |
| 2016-2020 |
22 |
4.4 |
Composition and distribution of the medical mall
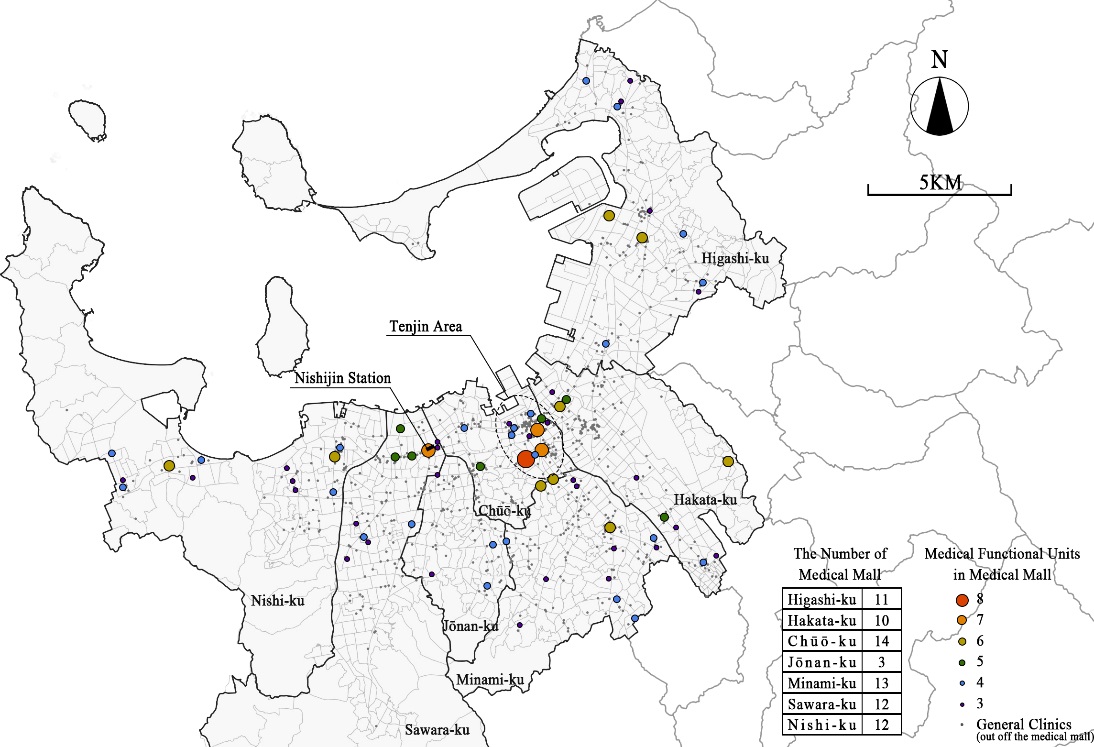
The medical functional units in medical malls are mainly clinics, accounting for 75%, followed by pharmacies, accounting for 23%. A total of 69 medical malls include pharmacies, covering almost all medical malls. In addition, other medical functional units are chiropractic clinics, long-term care institutes and research institutes. The scale of the medical mall is categorized by the number of its medical functional units. A medical mall with three or four medical functional units is the small-scale medical mall, with five to nine medical functional units is the medium-scale, with more than nine medical functional units is the large-scale (Ito, 2010). The average number of medical functional units of the medical mall in Fukuoka City are about four. All of them are small-scale and medium-scale. There are 55 small-scale medical malls, accounting for 73%. The remaining 20 medical malls are medium-scale. Medical malls in Fukuoka City were all small-scale in the early stage of their establishment, and then some small medical malls expanded into medium-scaled ones. The first medium-scaled medical mall appeared in 2005, 10 years since the opening of the first medical mall. Three quarters of medium-scaled medical malls were formed in the last decade, that is, the period of the rapid growth stage.
Medical malls in Fukuoka City are distributed among all administrative districts (Figure 3). Among them, there are 11, 10, 14, 12, 3, 13 and 12 medical malls in Higashi-ku, Hakata-ku, Chūō-ku, Sawara-ku, Jōnan-ku, Minami-ku and Nishi-ku respectively. Except for the Jōnan-ku, where the number of medical malls in other districts are approximately equal. There are two concentrated clusters, one is around the Tenjin area which is in the central area of Fukuoka City, the other one is around the Nishijin station. The medium-scale medical malls are mostly distributed in these two areas.
Composition of diagnosis and treatment departments of the clinic functional units
The clinics are the core function of the medical mall. Because the physicians in Japan are generally highly specialized, accordingly the clinics undertake specific diagnosis and treatment functions. According to Japan's Ministry of Health,Labour and Welfare (2019), the clinics are divided into general clinics and dental clinics. The diagnosis and treatment departments of the clinics can be divided into nine categories: Internal Medicine, General Surgery, Obstetrics and Gynaecology, Paediatrics, Psychiatry, Ophthalmology, Otorhinolaryngology, Dermatology and Dentistry. The first eight categories belong to the diagnosis and treatment contents of general clinics, and dentistry belongs to dental clinics. There are 1,606 general clinics and 1,037 dental clinics in Fukuoka City. Among them, 202 general clinics and 31 dental clinics are in the medical mall respectively. In this research, the clinics located in the medical mall are called the medical mall clinics. The independent clinic, that is, the clinics not located in the medical mall, are called the non-medical mall clinics. The general clinics are classified according to their own diagnosis and treatment departments. When the clinic contains multiple departments, the most important diagnosis and treatment department is regarded as representative of the whole clinic.
First, we can see from Table 2 that the number of Internal Medicine and General Surgery clinics are much higher than the other kinds of clinics, accounting for 45% and 20% respectively. Although the most important departments in medical malls are also these two, the proportion of Internal Medicine is 30%, which is far less than the overall level, while the proportion of General Surgery is 25%, which is significantly higher. Then, Dermatology and Ophthalmology are the second most popular departments in medical malls, accounting for 13% and 10%, both are 4% higher than that in non-medical malls. Then is Psychiatry, Paediatrics and Otorhinolaryngology which occupy 7%, 6% and 5% respectively, slightly higher than non-medical malls. Finally, when sorting the combination forms of diagnosis and treatment departments in medical malls, 57 types were found. In general, Internal Medicine and General Surgery are still the mainstream departments in medical malls. Besides that, medical malls also prefer Dermatology, Ophthalmology, Psychiatry and Paediatrics.The diagnosis and treatment departments in medical malls are more comprehensive and their compositions are diverse.
Table 2. Number and proportion of different departments regarding two types of general clinics
| Department
|
Number (Proportion%)
|
| Total
|
Medical mall clinic
|
Non-medical mall clinic
|
| Internal Medicine |
724 (45) |
59 (30) |
665 (47) |
| General Surgery |
323 (20) |
50 (25) |
273 (19) |
| Obstetrics and Gynaecology |
63 (4) |
8 (4) |
55 (4) |
| Paediatrics |
87 (5) |
12 (6) |
75 (5) |
| Psychiatry |
84 (5) |
15 (7) |
69 (5) |
| Ophthalmology |
106 (7) |
21 (10) |
85 (6) |
| Otorhinolaryngology |
67 (4) |
11 (5) |
56 (4) |
| Dermatology |
152 (9) |
26 (13) |
126 (9) |
|
1,606 (100) |
202 (100) |
1,404 (100) |
Medical efficiency performance
Process of the efficiency evaluation
This paper explored whether medical malls are more efficient by comparing the efficiency between clinics in and not in medical malls. First, we selected the research objects that met the calculation conditions which had complete input and output data. There were 972 eligible clinics, which included 146 clinics in the medical mall and 826 non-medical mall clinics. It was worth mentioning that the objects of the efficiency evaluation in this paper were the general clinics. The reason why the dental clinics were not considered for evaluation was that dental clinics in medical malls accounted for only 3% of all dental clinics, and there were many missing data. Second, taking these clinics as the DMUs, we calculated the efficiency value by using RStudio software with the package of ‘deaR’. Finally, the study conducted a comparison between the medical mall clinics and non-medical mall clinics.
Efficiency evaluation results
Overall evaluation
The average efficiency value of all clinics was 0.25, which represents the average medical efficiency capacity of the clinics in Fukuoka city. The average efficiency of non-medical mall clinics was 0.24, while the average efficiency of clinics in medical malls was 0.32, as shown in Table 3. Medical malls have promoted the medical efficiency of clinics by more than 30%.
Table 3. Descriptive statistical characteristics of the medical efficiency value
| Variable
|
Total
|
Medical mall clinics
|
Non-medical mall clinics
|
| Mean |
0.25 |
0.32 |
0.24 |
| Median |
0.22 |
0.27 |
0.20 |
| Maximum |
1.00 |
1.00 |
1.00 |
| Minimum |
0.00 |
0.02 |
0.00 |
| Std. Dev |
0.17 |
0.20 |
0.15 |
| Skewness |
1.56 |
1.28 |
1.56 |
| Kurtosis |
3.71 |
1.72 |
4.07 |
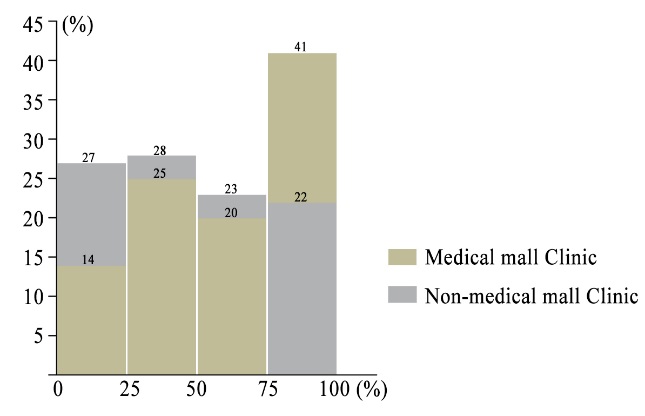
The efficiency’s median value of all clinics was 0.22, which was the medium medical efficiency capacity of the general clinics across the whole city. For the quartiles of the efficiency values of all clinics, the efficiency performance of clinics in Fukuoka city were divided into four equal intervals from low to high. The number and proportion of medical mall and non-medical mall clinics in each interval were counted to analyse the distribution of efficiency values of these two types of clinics. As shown in Figure 4, if a clinic is in the range of 75-100%, it means that its efficiency value exceeds at least 75% of clinics in Fukuoka, or it can be said that its efficiency ranks among the top 25% of all clinics. There were 61% of the medical mall clinics whose efficiency values exceeded the median value of all clinics, while only 45% of the non-medical mall clinics were above the median value. Besides that, nearly half of the medical mall clinics were in the top 25% of the whole clinics’ medical efficiency level, while only a fifth of the non-medical mall clinics. Only 14% of the medical mall clinics ranked in the bottom 25%, but 27% of the non-medical mall clinics did. In general, the clinics in the medical mall are more efficient. This conclusion is not only drawn from the comparison of the average efficiency but also reflected in the fact that most medical mall clinics come out in front among the efficiency values of whole clinics.
Due to the different treatment contents and receiving methods of different types of diagnosis and treatment departments, there may be differences in their performances of medical efficiency. In addition, the number of clinics in these eight types of departments is significantly different. Although in the overall evaluation non-medical mall clinics are not as efficient as non-medical mall clinics, this does not eliminate the situation that they may perform better in some departments. Therefore, this paper compared the efficiency between medical mall clinics and non-medical mall clinics with different departments, and the results are shown in Table 4. The average efficiency of the medical mall clinics in each of these eight departments was higher than that of the non-medical mall clinics to varying degrees. Obstetrics and Gynecology was the department with the greatest disparity. The average medical efficiency of the clinics in the medical mall was about twice that outside of the medical mall. Then followed the General Surgery, Ophthalmology, Otorhinolaryngology and Dermatology, the average efficiencies of the medical mall clinics were 38%, 31%, 26% and 23% higher than that of the non-medical mall clinics in the same department. Besides that, the medical mall clinic’s average efficiency in Psychiatry and Pediatrics increased slightly by 15% and 9%. The average efficiency of the medical mall clinics was close to that of the non-medical mall clinics in Internal Medicine, and the former was only 4% higher than the latter. In addition, the most inefficient clinics in all these eight departments were the non-medical mall clinics.
Table 4. Descriptive statistical characteristics of the medical efficiency value by department
| Variable
|
Mean
|
|
Median
|
|
Std. Dev
|
| Department
|
M
|
N
|
T
|
|
M
|
N
|
T
|
|
M
|
N
|
T
|
| Internal Medicine |
0.20 |
0.19 |
0.20 |
|
0.19 |
0.18 |
0.19 |
|
0.12 |
0.12 |
0.12 |
| General Surgery |
0.41 |
0.30 |
0.32 |
|
0.35 |
0.25 |
0.28 |
|
0.25 |
0.19 |
0.21 |
| Obstetrics and Gynaecology |
0.34 |
0.17 |
0.19 |
|
0.38 |
0.16 |
0.17 |
|
0.10 |
0.10 |
0.11 |
| Paediatrics |
0.33 |
0.30 |
0.30 |
|
0.26 |
0.31 |
0.31 |
|
0.19 |
0.12 |
0.13 |
| Psychiatry |
0.23 |
0.20 |
0.20 |
|
0.21 |
0.19 |
0.19 |
|
0.11 |
0.10 |
0.10 |
| Ophthalmology |
0.37 |
0.28 |
0.30 |
|
0.32 |
0.25 |
0.26 |
|
0.23 |
0.16 |
0.18 |
| Otorhinolaryngology |
0.44 |
0.35 |
0.37 |
|
0.49 |
0.33 |
0.37 |
|
0.11 |
0.13 |
0.13 |
| Dermatology |
0.34 |
0.28 |
0.29 |
|
0.31 |
0.24 |
0.25 |
|
0.18 |
0.22 |
0.22 |
M,N,T represent Medical mall clinics, Non-medical mall clinics, and Total clinics respectively
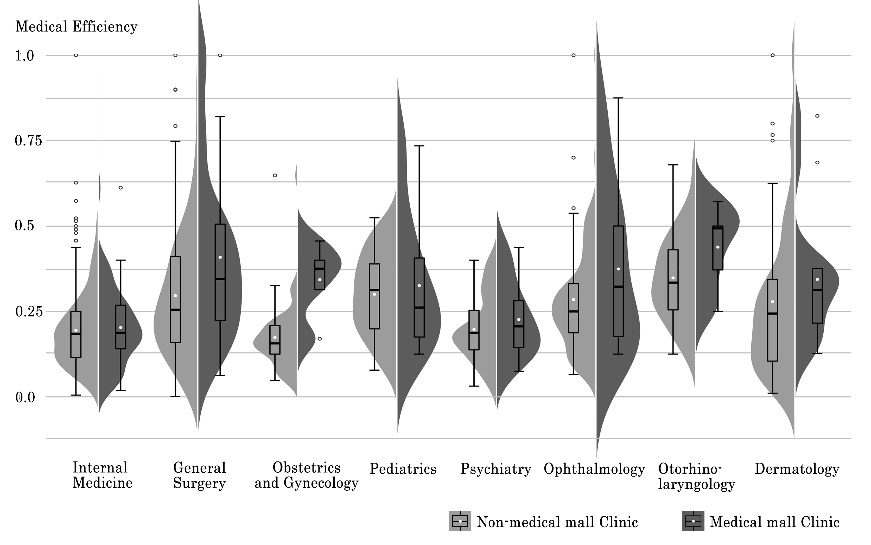
From the distribution of efficiency values, the width of the violin plot in Figure 5 represents the density of the data regarding two types of clinics’ efficiencies at different values. The widest part in the violin plot is the place where medical efficiency value is most concentrated. For General Surgery, Obstetrics and Gynecology, Otorhinolaryngology and Dermatology, the efficiency concentration locations of the medical mall clinics were obviously higher than non-medical mall clinics. Then, the average efficiency values of the medical mall were higher than the non-medical mall in all the departments shown by white points in Figure 5. Finally, the median lines in the box plot of the medical mall clinics were higher in almost all the departments except the Pediatrics. To summarise, medical mall clinics maintain a better technical efficiency, which is reflected to higher average efficiency and higher ranking, and is more prominent in specific departments.
The average efficiency value of all clinics in the medical mall was taken as the medical efficiency of the whole medical mall. The most efficient medical mall in Fukuoka City was a small-scale one located in Higashi-ku whose medical efficiency value was 0.7. On the contrary, the medical mall with the lowest medical efficiency was a medium-scale one with the value of 0.03, located in Hakata-ku. Whether there is a spatial autocorrelation between the medical efficiency of each medical mall in urban space is measured by Moran's I index. In this paper, this calculation process was realized by the GeoDa software. The construction of spatial weights was based on distance criteria, using the inverse distance as the spatial relationship, the Euclidean distance measure used for the distance method and the default value as the threshold distance. The Moran’s Index was 0.107, the z-score was 2.107, and the p-value was 0.029. Since the z-score is greater than 1.96, there is less than a 5% likelihood that the clustered pattern is a result of random chance. The possibility of the aggregation of the medical efficiency is greater than that of random distribution, and the null hypothesis can be significantly rejected. This result shows that the spatial distribution of medical mall efficiency in Fukuoka city has certain aggregation characteristics, and has a spatial positive correlation.
Then we divided the medical malls equally into three types according to their medical efficiencies: low efficiency (0.03-0.22), middle efficiency (0.23-0.37) and high efficiency (0.378-0.70). Figure 6 shows that the proportion of these three types of medical malls varies in each district. Hakata-ku has the greatest number of high efficiency medical malls. There is a small cluster of high efficiency medical malls near the rail transit station located in the southeast of the district. Chūō-ku has the largest number of low efficiency medical malls, almost all of which are in the Tenjin area. Minami-ku and Sawara-ku have more high and medium efficiency medical malls. It can be inferred that the efficiency of medical malls in Fukuoka city is related to its urban environment.
Influence factors on the efficiency of medical malls
Urban environment around medical malls
According to the Support Project for Urban Function in the Urban Renewal Plan, the government attempts to promote the maintenance and promotion of urban vitality through medical, commercial and other facilities. The medical facilities are the guidance facilities in the residential area, whose guiding spatial scopes are the catchment areas within a radius of 500m centred on themselves (Ministry of Land, Infrastructure, Transport and Tourism (MLIT), 2014). In addition, research on housing and living environments for the elderly by (Cabinet Office of Japan, 2018) showed that the medical institutions are the secondary destination for the elderly when they went out. At the same time, the main ways for the elderly to go out were driving and walking. Therefore, the road network around the medical mall should also be considered when calculating the guiding area. For the above reason, a 500m road network-based catchment area was used as the research scope to extract the factors of the urban environment around the medical mall. Figure 7 shows the catchment area of a medical mall in Fukuoka city, which was calculated by using the network analysis tool of Qgis software. The catchment area participated in the regression process as a controlled variable.

There are 18 urban environment elements shown in Table 5, extracted using Qgis software. Firstly, there are five variables of the demographic structure. The total resident population describes the number of people living in the catchment area. In Japan, people can be divided into three categories according to their age: under 14, between 15 and 64, and over 65 years old. These represent the young, the working-age people and the elderly, respectively. The population density of these three kinds of people is used to represent the distribution of age structures. Besides that, we also use the total daytime population to refer to the people who are active in the catchment area during normal business hours. Secondly, there are seven variables of location and transportation. The centroid of the downtown area in Fukuoka city, Tenjin-Hakata area, is taken as the urban centre. The distance from the medical mall to the urban centre is taken as the standard to measure its location. The transportation conditions are divided into the public and the private. The number and distance of the bus stop and the subway station reflect the convenience of public transportation. There are bus stops near almost all medical malls, but the number varies greatly. However, there are few malls near subway stations. For the aspect of public transportation, it is more dependent on buses. According to the classification of road by the MLIT and the road map by the Fukuoka Route Information Providing System, the national road, county road and urban arterial road are identified as the main roads in the city, which are convenient for cars to pass through quickly. Although there are differences in the number of main roads within the catchment area of the medical malls, most malls are built close to the main roads. Finally, there are the six variables of building usage. The total construction area and the floor area ratio (FAR) represent the construction intensity of the whole area. The proportion of residential, commercial, and educational and welfare uses show the main functions of the area. Besides that, the numbers of medical facilities which include hospitals, general clinics and dental clinics are used to measure the medical conditions in the surrounding area of the medical mall.
Table 5. Descriptive statistics of the urban environment elements around the medical mall
| Category
|
Variables
|
Unit
|
Min
|
Max
|
Ave
|
| Demographic Structure |
Total Resident Population |
—— |
497 |
17,892 |
6,038 |
| Population Density of the Young |
pop/ha |
0.5 |
31.9 |
13.7 |
| Population Density of the Working-age |
pop/ha |
7.2 |
222.9 |
81.9 |
| Population Density of the Elderly |
pop/ha |
0.5 |
40.6 |
18.1 |
| Total Daytime Population |
—— |
983 |
57,810 |
9,167 |
| Location and Transportation |
Distance to the Urban Centre |
km |
0.2 |
15.5 |
5.4 |
| Number of Bus Stop |
—— |
0.0 |
28.0 |
5.7 |
| Distance to Nearest Bus Stop |
m |
16 |
615 |
120 |
| Number of Subway Station |
—— |
0.0 |
2.0 |
0.2 |
| Distance to Nearest Subway Station |
m |
30 |
3571 |
698 |
| Number of Main Road |
—— |
1.0 |
7.0 |
3.1 |
| Distance to Nearest Main Road |
m |
3.5 |
245.0 |
26.5 |
| Building Usage |
Total Construction Area |
ha |
4.7 |
176.2 |
45.0 |
| FAR |
% |
156 |
980 |
367 |
| Proportion of Residence |
% |
1.5 |
91.6 |
62.1 |
| Proportion of Commerce |
% |
0.4 |
53.9 |
15.5 |
| Proportion of Education and Welfare |
% |
0.0 |
0.6 |
0.1 |
| Number of Medical Facilities |
—— |
0.0 |
118.0 |
21.0 |
Selection of the spatial regression model
Before using spatial regression to determine the main environmental factors that affect the efficiency of a medical mall, a test is first conducted to determine the appropriate model. The result of the test is shown in Table 6. When creating the spatial weights matrix, this paper used the Queen Contiguity as the Contiguity Weight. Firstly, the Moran's I index of the residual error was -1.614 and significant at the 10% level. The residual of the OLS model had spatial autocorrelation, so it was better to use the spatial regression model. Then, the appropriate spatial regression model was selected by the results of the Lagrange Multiplier test and Robust Lagrange Multiplier test, shown in Table 6. LM-err and Robust LM-err both passed the significance test, so this studey chose the SEM model (Baltagi, Song, & Koh, 2003). In this research, GeoDa software was used to do the OLS regression, test and spatial regression.
Table 6. Result of the Lagrange Multiplier test of the OLS regression
| Lagrange multiplier test statistics
|
Value
|
p-value
|
| Moran’s I
|
-1.614 |
0.096 |
| LM-lag |
1.337 |
0.248 |
| Robust LM-lag |
0.097 |
0.755 |
| LM-err |
4.362 |
0.037 |
| Robust LM-err |
3.122 |
0.077 |
Discussion on regression results and main influence factors of efficiency
Compared with OLS regression results, without considering the impact of the urban environment in the surrounding region on the local medical mall, the SEM model improved the estimation results. The specific performances were: R2 value increased from 0.38 to 0.50, which enhanced the interpretation ability of the model; Log Likelihood (LogL) value increased from 16.27 to 20.54, Akaike Information Criterion (AIC) decreased from 7.46 to -1.09, and Schwarz Criterion (SC) decreased from 53.80 to 45.26. These three values represented the improvement of the goodness of fit.
From the results of SEM regression, the autocorrelation coefficient of the error term was -0.49, and it passed the 1% significance level test. There was the opposite spatial interaction between the errors of the explanatory variables of the local medical malls and their neighbours. For the existing explanatory variables, urban environment elements, the impacts on the efficiency of the medical mall were different. Some explanatory variables did not pass the significance test, which meant that their impact on medical mall efficiency is not significant. Therefore, this paper focuses on discussing the significant influence factors shown in Table 7 which are the urban environment elements that passed the significance test. In terms of demographic structure, the population densities of the young and the working-aged people have significant positive impacts on medical efficiency. On the one hand, because most of the medical malls have not been open for a long time, young people have a higher acceptance of them. On the other hand, the efficiency is related to the composition of the diagnosis and treatment departments in the medical mall. Paediatrics, Dermatology and Obstetrics and Gynaecology departments, mainly with non-elderly as diagnosis and treatment targets, account for a large proportion in medical malls. In terms of transportation, the more main roads in the catchment area, the higher the efficiency of the medical mall. The higher the convenience of private transportation, the faster people can get to the medical mall, which has a positive impact on medical efficiency. For building usage, the more the total construction area of the catchment area, the more likely it is to improve medical efficiency. The proportion of residential and commercial construction also impacts medical efficiency. Where there are more residents living in the community, the medical demands increase accordingly. Commercial facilities can meet the needs of medical treatment and provide convenient shopping, which makes medical malls more attractive. In addition, other medical facilities in the catchment area hurt the efficiency of medical malls.
Table 7. Estimation result of the significant influence factors by SEM model
| Urban Environment Elements
|
Coefficient
|
Positive or Negative
|
| Population Density of the Young |
0.011* |
+ |
| Population Density of the Working-age People |
0.009** |
+ |
| Number of Main Roads |
0.036** |
+ |
| Total Construction Area |
0.013** |
+ |
| Proportion of Residence |
0.008*** |
+ |
| Proportion of Commerce |
0.008** |
+ |
| Number of Medical Facilities |
- 0.009** |
- |
***,**,* denote 1% ,5% and 10% significance level respectively
“+” represents a positive impact, “-” represents a negative impact
Discussion and conclusion
With the help of the SBM model and SEM, this study carried out a quantitative evaluation of the influence factors of medical mall efficiency and conducted a detailed case study in Fukuoka City. Through the calculation of medical efficiency and a comparison study with the clinics, we could objectively draw the conclusion that the medical mall was a more efficient facility. Through regression analysis, this paper found the urban environment factors suitable for the development of medical malls.
The medical mall is a new kind of medical institution, which is characterized by the agglomeration of multiple medical functions. The core components are the clinics with different diagnosis and treatment departments. After sorting all medical facilities in Fukuoka, this paper found that there are 75 medical malls in operation that meet the definition. Since the first medical mall opened in 1995, the development of medical malls in Fukuoka can be divided into three stages: slow growth stage (1995-2000), stable growth stage (2001-2010) and rapid growth stage (2011-2020). Not only is the number increasing, but also the scale is expanding. Medical malls are still under construction and development.
In view of the current situation of increasing medical demands and insufficient supply of medical-related personnel in Japan. Taking the number of the physicians and the other medical professionals as two inputs and the average number of patients per day as the output, this paper calculated the medical efficiency from the perspective of human resources. The use of the SBM model realized the quantitative calculation of efficiency so that the medical facilities could be directly compared through their efficiency values. Through comparison between the clinics inside and outside the medical mall, the research found that the medical efficiency of the former was 30% higher than the latter. Moreover, this characteristic was particularly obvious in clinics with Obstetrics and Gynecology, General Surgery and Ophthalmology as the diagnosis and treatment department. In summary, medical malls with multi- diagnosis and treatment departments is more efficient than the independent clinic.
The medical malls were not evenly distributed in the city. Hakata-ku had the most high-efficiency medical mall, while Chūō-ku had the most low-efficiency medical malls. The results of the spatial autocorrelation suggested that the efficiency of the medical malls in Fukuoka City was clustered. The efficiency performances of the medical malls should be related to the urban environment around their locations. The results of spatial regression analysis using the SEM model showed that the demographic structure, location and transportation, and building usage, all affected the efficiency of the medical mall. The most significant influence factors were the population density of the young (0-14 years old), the population density of working-aged people (15-64 years old), the number of main roads, total construction area, proportion of residence, the proportion of commerce, and number of medical facilities which is the only negative factor. In order to judge whether the medical mall’s location has the potential to improve the efficiency, we should compare these with urban environment elements and consider the urban environment of the adjacent area.
Overall, there are two academic contributions from this work. First, combining and summarizing the characteristics and development of the medical mall will help to establish a basic understanding of this emerging medical facility in order to apply this to the consideration of the construction of primary health care and medical facilities in the future. Second, using human resource data and the SBM model, the quantitative calculation of technical efficiency of the clinic-level medical facilities is realized. To some extent, it reflects the utilization of medical resources. In the future, based on efficiency, we can think more comprehensively about the balance of medical supply and demand and the redistribution of medical resources.
Finally, there are still some potential limitations in this study. Over and above those we have discussed, there are still some factors affecting the efficiency of the medical malls, and the interaction between urban environmental factors is complex. Therefore, we will continue to study the influencing mechanisms of the urban system on medical efficiency. In addition, how to apply the medical efficiency evaluation and influence mechanism to the rational allocation of medical resources and medical facilities will be the direction of future research.
References
- Anselin, L. (1988). "A Typology of Spatial Econometric Models". Spatial Econometrics: Methods and Models (pp. 32-40): Springer. doi: https://doi.org/10.1007/978-94-015-7799-1.
- Baltagi , B. H., Song , S. H., & Koh, W. (2003). "Testing Panel Data Regression Models with Spatial Error Correlation". Journal of econometrics, 117(1), 123-150. doi: https://doi.org/10.1016/S0304-4076(03)00120-9.
- Banker , R. D., Charnes, A., & Cooper , W. W. (1984). "Some Models for Estimating Technical and Scale Inefficiencies in Data Envelopment Analysis". Management science, 30(9), 1078-1092. doi: https://doi.org/10.1287/mnsc.30.9.1078.
- Boussofiane, A., Dyson , R. G., & Thanassoulis, E. (1991). "Applied Data Envelopment Analysis". European journal of operational research, 52(1), 1-15. doi: https://doi.org/10.1016/0377-2217(91)90331-O.
- Cabinet Office of Japan. (2018). "Research on Housing and Living Environment for the Elderly: Summary of Survey Results". Retrieved from https://www8.cao.go.jp/kourei/ishiki/h30/zentai/pdf/s2.pdf on February 14, 2021.
- Cabinet Office of Japan. (2020). "The State of Ageing and Implementation of the Measures for the Ageing Society in 2020". Retrieved from https://www8.cao.go.jp/kourei/whitepaper/w-2021/gaiyou/pdf/1s1s.pdf on January 02, 2021.
- Charnes, A., Cooper , W. W., & Rhodes, E. (1978). "Measuring the Efficiency of Decision Making Units". European journal of operational research, 2(6), 429-444. doi: https://doi.org/10.1016/0377-2217(78)90138-8.
- Chern, J.-Y., & Wan , T. T. (2000). "The Impact of the Prospective Payment System on the Technical Efficiency of Hospitals". Journal of Medical Systems, 24(3), 159-172. doi: https://doi.org/10.1023/A:1005542324990.
- Cook , W. D., & Seiford , L. M. (2009). "Data Envelopment Analysis (Dea)–Thirty Years On". European journal of operational research, 192(1), 1-17. doi: https://doi.org/10.1016/j.ejor.2008.01.032.
- Farrell , M. J. (1957). "The Measurement of Productive Efficiency". Journal of the Royal Statistical Society: Series A, 120(3), 253-281. doi: https://doi.org/10.2307/2343100.
- Hashtarkhani, S., Kiani, B., Bergquist, R., Bagheri, N., VafaeiNejad, R., & Tara, M. (2020). "An Age‐Integrated Approach to Improve Measurement of Potential Spatial Accessibility to Emergency Medical Services for Urban Areas". The International journal of health planning management, 35(3), 788-798. doi: https://doi.org/10.1002/hpm.2960.
- Hollingsworth, B. (2008). "The Measurement of Efficiency and Productivity of Health Care Delivery". Health economics, 17(10), 1107-1128. doi: https://doi.org/10.1002/hec.1391.
- Ito, A. (2010). "Current Situation of Medical Complex in Japan-Its Growth and Managerial Problems". Jiyugaoka Sanno Coll Bull, 43, 49-68. Retrieved from https://www.sanno.ac.jp/undergraduate/library/cpir4n0000005sdg-att/bulletin005_19.pdf.
- Kontodimopoulos, N., Nanos, P., & Niakas, D. (2006). "Balancing Efficiency of Health Services and Equity of Access in Remote Areas in Greece". Health policy, 76(1), 49-57. doi: https://doi.org/10.1016/j.healthpol.2005.04.006.
- Li, Z., Zhao, L., & Yuan, Z. (2016). "Highway Transportation Efficiency Evaluation for Beijing-Tianjin-Hebei Region Based on Advanced Dea Model". International review for spatial planning sustainable development, 4(3), 36-44. doi: https://doi.org/10.14246/irspsd.4.3_36.
- Lopreite, M., & Mauro, M. (2017). "The Effects of Population Ageing on Health Care Expenditure: A Bayesian Var Analysis Using Data from Italy". Health policy, 121(6), 663-674. doi: https://doi.org/10.1016/j.healthpol.2017.03.015.
- Luo, W., & Wang, F. (2003). "Measures of Spatial Accessibility to Health Care in a Gis Environment: Synthesis and a Case Study in the Chicago Region". Environment planning B: planning design, 30(6), 865-884. doi: https://doi.org/10.1068/b29120.
- Ministry of Health,Labour and Welfare. (2019). "Survey on Dynamics of the Medical Institution". Retrieved from https://www.mhlw.go.jp/toukei/saikin/hw/iryosd/m19/dl/is1905_01.pdf on January 03, 2021.
- Ministry of Land, Infrastructure, Transport and Tourism (MLIT). (2014). "Details of Urban Functional Location Support Project". Retrieved from https://www.mlit.go.jp/common/001047657.pdf on February 14, 2021.
- OECD . Stat . (2019). "Health Care Resources (Physicians)". Retrieved from https://stats.oecd.org/index.aspx?queryid=30171 on January 03, 2021.
- Ogawa, H., & Kubo, R. (2005). "Technical Efficiency in the Secondary Medical Service Region". Medical and Society (Iryo To Shakai), 15(2), 39-50. doi: https://doi.org/10.4091/iken.15.2_39.
- Ozcan , Y. A., & Luke , R. D. (1993). "A National Study of the Efficiency of Hospitals in Urban Markets". Health services research, 27(6), 719.
- Song, X., Wei, Y., Deng, W., Zhang, S., Zhou, P., Liu, Y., & Wan, J. (2019). "Spatio-Temporal Distribution, Spillover Effects and Influences of China’s Two Levels of Public Healthcare Resources". International journal of environmental research public health, 16(4), 582. doi: https://doi.org/10.3390/ijerph16040582.
- Tanihara, S., Kobayashi, Y., Une, H., & Kawachi, I. (2011). "Urbanization and Physician Maldistribution: A Longitudinal Study in Japan". BMC health services research, 11(1), 1-7. doi: https://doi.org/10.1186/1472-6963-11-260.
- Tiemann, O., & Schreyögg, J. (2012). "Changes in Hospital Efficiency after Privatization". Health care management science, 15(4), 310-326. doi: https://doi.org/10.1007/s10729-012-9193-z.
- Tone, K. (2001). "A Slacks-Based Measure of Efficiency in Data Envelopment Analysis". European journal of operational research, 130(3), 498-509. doi: https://doi.org/10.1016/S0377-2217(99)00407-5.
- Tsumita, A., & Yasuaki, N. (2016). "Searching the Potential of Medical Mall Management". Annual Report of the Institute of Political Science & Economics of Musashino University, 13, 219-235.
- Uscher-Pines, L., Mehrotra, A., & Chari, R. (2013). "On Call at the Mall: A Mixed Methods Study of Us Medical Malls". BMC health services research, 13(1), 1-8. doi: https://doi.org/10.1186/1472-6963-13-471.
- Vitikainen, K., Street, A., & Linna, M. (2009). "Estimation of Hospital Efficiency—Do Different Definitions and Casemix Measures for Hospital Output Affect the Results?". Health policy, 89(2), 149-159. doi: https://doi.org/10.1016/j.healthpol.2008.05.012.
- Xu, F., Zhao, S., & Yamamoto, R. (2020). "Exploring the Supply and Demand Relationship of Medical Services for Each Diagnosis-Related Group". Journal of Architecture and Planning (Transactions of AIJ), 85(769), 637-646. doi: https://doi.org/10.3130/aija.85.637.