Abstract
It is commonly thought in city development that more development areas should be in the central business districts (CBDs) and residential areas (RAs). However, the existence of green open spaces (GOSs) has received less attention in efforts to preserve colonial cities (CCs) in Indonesia. Green open spaces (GOSs) primarily serve as balancers of ecological functions, including controlling air and water quality and balancing microclimates. The purpose of this study was to calculate the pattern of GOSs due to the development of CBDs and RAs in the CCs of Malang and Bandung. The quantitative descriptive method utilised spatial analysis, normalised difference vegetation index (NDVI) analysis, and connectivity analysis using space syntax. Spatial analysis was used to calculate the GOS patterns, and NDVI analysis was employed to describe changes in the GOS patterns of CBDs and RAs. Furthermore, space syntax analysis was used to analyse the influence of the development of the CBDs and RAs on changes in GOS patterns based on connectivity levels. The study’s results clarified the connectivity calculations using DepthMap and the Google Earth Engine, converting them into easily interpretable metrics for evaluating connectivity and NDVI across two separate areas. The novelty and innovation obtained from this research is a formula that can facilitate seeing more simply and efficiently the correlation between connectivity and the need for GOSs in a city by overlaying these two aspects. The RAs are characterised by low connectivity and elevated NDVI. Conversely, the CBDs exhibited high connectivity but low NDVI.
Introduction
Urban spatial planning in Indonesia has experienced rapid development along with the increasingly complex problems cities face (Makkelo, 2018). This development impacts land use conversion (Daunt, Inostroza, et al., 2021; He, Ling, et al., 2022). Therefore, land use distribution must be well planned for the sustainability of a city through zoning regulations. The history of a city largely influences the zoning system. Indonesia has several colonial cities (CCs) that are historically legacies of the Dutch. The Dutch colonised Indonesia for over 350 years, thereby greatly influencing the development of its cities’ spatial planning (Tutuko, Bonifacius, et al., 2022). Several zones in CCs that have high historical value have changed their function to become more productive areas. Currently, the perspective on historical areas is accompanied by an economic orientation that views objects in historical areas as "productive cultural assets" that benefit the economy, culture, and society (Ferretti, Bottero, et al., 2014; Ribera, Nesticò, et al., 2020). Urban spatial planning in Indonesia is influenced by Dutch colonial history and now faces challenges in managing land conversion due to urban development. Based on past studies, deeper research is needed on maintaining the form of the city, especially in the central business districts (CBDs) and residential areas (RAs).
The change in function still maintains the characteristics of the city's history because it can be a strong tourist attraction (Szromek, Kruczek, et al., 2023). It is also done in several countries, including Egypt, which maintains the form of the city displayed through historical zones (Eldiasty, Sabry Hegazi, et al., 2021). This condition has made Egypt an attractive tourist destination to this day. In addition, the USA maintains its transportation system through stations with high historical value (Renne and Listokin, 2021). Even though they have changed function, colonial cities in Indonesia still maintain their characteristics.
The change in function still maintains the characteristics of the city's history because it can be a strong tourist attraction (Szromek, Kruczek, et al., 2023). This is also done in numerous countries, including Egypt, which maintains the form of the city displayed through historical zones (Eldiasty, Sabry Hegazi, et al., 2021). This condition has made Egypt an attractive tourist destination to this day. Additionally, the US maintains its transportation system through stations with high historical value (Renne and Listokin, 2021). Even though they have changed function, CCs in Indonesia still maintain their characteristics.
Malang and Bandung are CCs designed by Dutch architect Thomas Karsten. The areas intended by Karsten in Malang and Bandung have now developed into CBDs and RAs. Although many have changed their function, some of the characteristics of the CC design are still maintained, especially in the colonial building style. On the other hand, green open spaces (GOSs), one of the important aspects of urban spatial planning, have received less attention from the government. Urban development has reduced the existence of GOSs because it has changed function to become a built-up area. It is marked by the existence of GOSs designed during the colonial period, many of which have undergone transformations in form and function (Falah, 2019)
In fact, GOSs are indicators for assessing the quality of the city landscape and the city’s ecological balance, including as a controller of air quality (Aini, Shen, et al., 2023; Aini and Shen, 2019, 2020a, 2020b), water quality guard (Wikantiyoso, Tutuko, et al., 2020), microclimate regulator (Lüttge and Buckeridge, 2023), etc. Therefore, this study aims to examine changes in GOS patterns due to the development of the CBDs and RAs in CCs.
In response to the global issue of sustainable development, CCs in Indonesia need to study the patterns of CCs in Indonesia to achieve sustainable urban forms. Several studies on CCs have already been conducted in previous research, such as on the participation approach (Agrawal, 2010), studies on politics and economics (Rodríguez-Alegría, Millhauser, et al., 2013; Yi and Ryu, 2015), and sustainable development in cities impacted by urbanisation (Firman, 2002, 2009). To enrich the study of urban development, the research approach that will be taken examines the pattern of urban GOS development and its connectivity on certain city maps in Bandung and Malang in their current conditions in 2024. This approach uses connectivity calculations to determine the relationship in syntactic space and normalised difference vegetation index (NDVI) to determine the GOS patterns. The calculation is expected to demonstrate the relationship between connectivity and GOS patterns that occur in CBDs and RAs in the context of city development.
The current problem is that there is no digital calculation related to the development of GOS patterns in Indonesia's CCs. Hence, to solve this problem, this study has several problem formulations, including (1) What were the GOS patterns in CBDs and RAs during the colonial period? (2) What is the current development of GOS patterns in CBDs and RAs in CCs in Indonesia? (3) How does the development of CBDs and RAs in CCs affect changes in GOS patterns based on their connectivity levels? The problem-solving approach requires innovation in the effective and efficient measurement process using digital calculations with three stages of problem-solving, including (1) Mapping GOS patterns in CBDs and RAs during the colonial period based on literature studies, (2) analysing the development of GOS patterns of CBDs and RAs in CCs based on Landsat 8 data through NDVI analysis, and (3) analysing the influence of the development of CBDs and RAs in CCs on changes in GOS patterns based on their connectivity levels using space syntax analysis.
The target of this research is a calculation that will be used to determine deviations occurring in the development of GOSs in a city. This study shows the suitability of the GOS distribution pattern with the spatial configuration pattern of CCs using spatial syntax attributes. The goal is to help city designers, planners, and policymakers understand the condition of city planning. Next, it will provide a sustainable planning direction for a sustainable urban form. This difference ratio is expected to demonstrate how much change has occurred in the GOSs of CBDs and RAs.
Literature Review
Sustainable Urban Form
A city’s form can affect its sustainability; this is a mutual influence between the form, size, density, and use of the city and its sustainability (Gibbins, 2001). The consequences of the progress of urban sustainability have occurred; the relationship between urban form and the elements of a city at each geographical scale must exist. If this relationship is understood, steps can be taken to achieve a sustainable urban form. Sustainable urban form in historical cities is crucial for maintaining GOSs, particularly in CBDs and RAs. By employing spatial analysis, planners can identify the distribution of green spaces and their relationships with urban features, which informs effective urban planning decisions. Integrating green infrastructure, such as parks and gardens, enhances the ecological and aesthetic value of these areas, mitigating issues like the urban heat island effect (Benedict and McMahon, 2002; Faehnle, 2014; Pitman, Daniels, et al., 2015). Furthermore, compact urban forms promote walkability and reduce sprawl, preserving the integrity of the urban fabric while ensuring that green spaces remain accessible (Christensen, 2013). Historic preservation practices also play a vital role, balancing the need for conservation with sustainable development, thereby enriching the cultural landscape of historical cities (Salama, 2000). Ultimately, sustainable urban design principles, especially in historic cities, combine cultural preservation, green space, and compact design, which are essential for creating resilient environments that support both ecological health and the community’s well-being (Ameen, Mourshed, et al., 2015; Cooper, Evans, et al., 2009; Craun, 2012).
Space Syntax
Space syntax represents a theoretical framework that architects employ graphically to investigate the influence of the spatial configuration of edifices and urban environments on the economic, social, and environmental ramifications of human mobility and interpersonal interactions (Dawson, 2002). The methodology inherent in space syntax applies to urban space analysis. This analytical approach was conceived by a research collective spearheaded by Bill Hillier and Julienne Hanson at the Bartlett School of Architecture and Planning at University College London during the late 1970s and early 1980s to interpret urban spatial configurations (Hillier and Hanson, 1984). The space syntax methodology is instrumental in objectively analysing spatial dimensions, positing a correlation between physical frameworks and social constructs. Urban system dynamics may be elucidated in relation to structural edifices (Önder and Gigi, 2010). Space syntax encompasses a theoretical foundation and methodological techniques associated with the intricate relationships between spatial arrangements and human behaviour (Hölscher, Dalton, et al., 2007).
As a network, the analysis may be framed within the city's geometric configurations and geographical attributes. The investigating space syntax on an urban scale, concentrated on urban development by integrating geometric analysis and assessments of geographic accessibility. The progression of urban development can be appraised through the mobility patterns engendered by the accessibility afforded by existing transportation modalities within the urban landscape (Law, Chiaradia, et al., 2012). The space syntax methodology is typically applied to the architectural arrangement of buildings and urban areas. Space syntax comprises a comprehensive ensemble of theories and a suite of analytical, quantitative, and descriptive instruments for examining spatial formations across varying scales, encompassing cities, individual structures, and interior environments (Hillier, 2007; Hillier and Hanson, 1984; Tutuko, Bonifacius, et al., 2021). An additional investigation posited that space syntax emphasises linear elements (e.g., roadways and passageways) and serves as a valuable framework for evaluating spatial arrangements (Batty, 2004). Within the urban milieu, this framework is significantly shaped by human movement and social engagement (Dawson, 2002). The space syntax methodology can be applied to the analysis of urban spaces (Hillier, 2007). It proves beneficial in comprehending objective spatial areas while also asserting the interrelationship between physical and social structures. In exploring urban spatial analyses, the functionalities of urban systems can be interpreted in conjunction with structural edifices (Önder and Gigi, 2010). This methodological approach is amenable to application across extensive urban locales as well as within various settlement and architectural contexts.
Methods
Location Study
The study location was CCs that had developed into CBDs and RAs. Bandung and Malang were chosen as they have similar urban designs. Furthermore, the architect, Thomas Karsten, designed both cities. Figure 1 and Figure 2 show the CBD and RA research locations in the CCs of Bandung and Malang.
The present study is the first to examine the GOS patterns of CBDs and RAs in Indonesia. It used vegetation indices and spatial syntaxes to develop a sustainable urban form. As such, the results of the present study will enrich the field of examining the GOS patterns of metropolitan areas using spatial syntax.
Analysis Process
This research involves three stages of the analytical process. The first stage uses space syntax to analyse the connectivity levels of CBDs and RAs in two CCs. The second stage analyses GOSs in CCs through a vegetation index approach. The final stage involves overlaying the results from both analyses.
Connectivity Analysis Using Space Syntax
Analysing the influence of the development of CBDs and RAs in CCs is based on changes in the pattern of GOSs according to their connectivity level. This stage is based on connectivity analysis using space syntax. Space syntax is an approach used to analyse the spatial distribution of parks and assess the accessibility of urban green spaces, thus helping to create sustainable cities (Leghrib and Laroui, 2024; Tannous, Major, et al., 2021). This research used this approach to calculate connectivity in the master plans of Bandung’s and Malang’s CCs. Bandung and Malang were selected because these cities have almost the same conditions and have Dutch colonial historical value.
When calculating connectivity using space syntax in CBDs and RAs, the radius was used to understand how spatial relationship patterns work at a scale relevant to each area’s function. Central business districts (CBDs) have intensive activities with high movement, hence wide connectivity is vital to support business interactions, accessibility, and mobility. Global radius (n) was used to understand global connectivity across the city network. Residential areas (RAs) tend to focus more on local convenience, with lower connectivity needs than CBDs. Local radius (n=0-3) was used to analyse direct connectivity between homes, local facilities, and neighbourhood roads. By selecting the appropriate radius for each area, space syntax analysis can provide insights into movement patterns, accessibility, and spatial efficiency relevant to each functional characteristic (Table 1).
Table 1. A comparison of the radius used in the CBDs and RAs
| Aspects
|
CBDs
|
RAs
|
| Connectivity Focus |
High mobility and strategic access |
Local convenience and daily functions |
| Dominant Radius |
Global or medium radius (5–n) |
Local or medium radius (0–7) |
| Analysis Results |
Global integration, connectivity between areas |
Local connectivity between facilities and homes |
Green Open Space (GOS) Pattern Analysis Using Normalised Difference Vegetation Index (NDVI)
This second stage used the NDVI analysis technique. The NDVI quantifies a satellite image's greenness and vegetation density. The formula used in NDVI analysis is as follows ( Bahadur, 2018; Sruthi and Aslam, 2015):
NDVI = (NIR – Red) / (NIR + Red) (1)
NIR : Near infrared band reflectance for a cell.
RED : Red band reflectance for a cell.
The NDVI ranges from -1.0 to 1.0. A range of 0.1 to 0.7 is used to represent vegetation, while values outside the range describe the health level of vegetation cover. NDVI analysis uses satellite imagery with red and near-infrared (NIR) bands obtained through Landsat, NOO AVHRR, or Worldview-2. Furthermore, the satellite imagery was analysed using ArcGIS based on the NDVI formula.
Overlay Analysis
Overlay analysis in geographic information systems integrates multiple spatial datasets to assess their relationships. In this study, the overlay process combines two outputs: the connectivity map from space syntax analysis and the vegetation density map derived from NDVI analysis. Space syntax analyses the spatial configuration of urban areas and measures connectivity between locations, which helps to predict pedestrian movement and accessibility (Nes and Yamu, 2018). This approach is essential for identifying areas with high connectivity, often associated with greater social interaction and economic potential.
Normalised difference vegetation index (NDVI) analysis, on the other hand, evaluates vegetation distribution and health based on satellite image data. This index is widely used to assess GOSs in urban areas, demonstrating vegetation density and condition. The NDVI ranges from -1 to +1, with higher values indicating healthier vegetation (Bahadur, 2018; Sruthi and Aslam, 2015). By overlaying the NDVI results onto the space syntax connectivity map, researchers can examine how well green spaces are distributed relative to the most accessible urban areas.
The overlay process helps urban planners identify areas with high connectivity but limited vegetation, which can be prioritised for green space development or infrastructure improvements. Conversely, areas with abundant green spaces but low connectivity can be evaluated for potential accessibility enhancements. Integrating spatial and ecological factors is key to achieving balanced and sustainable urban development, ensuring that social and environmental needs are addressed. Figure 4 is a flow diagram illustrating the process of overlaying the space syntax connectivity map with the NDVI green space conditions map.
Results and Discussion
Connectivity in the Central Business Districts (CBDs) and Residential Areas (RAs) of Both Colonial Cities (CCs)
Space syntax was used to quantitatively assess connectivity within the urban master plans of Malang and Bandung. These cities have historically been acknowledged for their planning under the guidance of Herman Thomas Karsten (Bogaers, 1983). The selection process for Malang and Bandung was predicated on the premise that these urban centres exhibit analogous contextual characteristics. Both municipalities are recognised for their contributions to cultural and educational advancement. Prior investigations used justified graph methodology to evaluate the spatial depth of traditional Javanese residences and the structural patterns of CCs in Indonesia and established the groundwork for this inquiry (Bonifacius, Tutuko, et al., 2021; Tutuko, Bonifacius, et al., 2019, 2022; Tutuko and Shen, 2014). The analysis revealed noteworthy parallels in the urban master plans of Indonesian cities compared to their foundational cities. From the viewpoint of similarity ratios, the elements of depth and connectivity play crucial roles in illuminating the resemblance between the urban configurations of Indonesian CCs and those of the Netherlands (despite their physical disparities), as this investigation specifically emphasises justified graphs (Tutuko, Bonifacius, et al., 2019, 2021). Moreover, to enhance the understanding of spatial syntax in the context of evolving urban patterns towards sustainable urban configurations, an investigation was undertaken into developing GOS patterns within RAs and CBDs that possess specific historical significance.
Connectivity in the Central Business Districts (CBDs) of Both Colonial Cities (CCs)
Connectivity calculations were conducted in the CBDs, famous for their Dutch-designed paths. The results of connectivity calculations using DepthMap are shown in visual graphic analysis images, with red indicating a high level of connectivity, while green and blue indicate lower connectivity (Figure 4). The highest connectivity was on the north side of the road corridor in the Braga CBD (Bandung City), while the Kayutangan CBD (Malang City) was on the south side.
Connectivity in the Residential Areas (RAs) of Both Colonial Cities (CCs)
Connectivity calculations were carried out in RAs of Bandung and Malang’s CCs. These RAs have similar road and vegetation planning, with large trees and wide roads. The yards of the houses are wider and have trees planted in the front yards. The connectivity calculations using DepthMap show that the red indicates a high connectivity level on the southern and western sides of Bandung’s RA. Similarly, from the results of connectivity calculations in Malang’s RA, the highest connectivity is also on the southern and western sides (Figure 5).
Figure 4. Connectivity in the CBDs of the two CCs (Source: DepthMap Calcultion Analysis, 2024)
Connectivity Analysis
The connectivity analysis using DepthMap showed that the highest average connectivity in Bandung’s CBD and RA were 333.37 and 278.45, respectively (Table 2). This was due to the significantly higher number of connected lines due to the complexity of the city’s digital map. On the contrary, Malang’s RA (91188.00) had more lines than Bandung’s RA (65793.00). However, connectivity in Malang was lower than in Bandung. The standard deviation figures for the four maps show the same results; namely, the connectivity distribution was relatively even in the four areas.
Table 2. The DepthMap-based connectivity results.
| Location
|
Average
|
Minimum
|
Maximum
|
Count
|
| CBD on Braga |
333,37 |
18,00 |
1508,00 |
10869,00 |
| CBD on Kayutangan |
190,27 |
10,00 |
911,00 |
10249,00 |
| Residential Area on Bandung |
278,45 |
4,00 |
3360,00 |
65793,00 |
| Residential Area on Malang |
161,52 |
2,00 |
1382,00 |
91188,00 |
The distribution of line and connectivity data on the map is a consideration of whether the distribution of connectivity in RAs and CBDs is even or not. Calculations were carried out using scatter plots to determine the data distribution between lines and connectivity for both Malang and Bandung.

The more points connected at the intersection between lines, the stronger the relationship between the lines. Thus, if r > 0.5, the correlation is stronger. Here, it means that a line of a certain length has connectivity with a certain range (the more yellow, the greater the connectivity). The data distribution in Bandung’s Braga CBD appears even with a data distribution at r=0.70 (Figure 6). Likewise, the data distribution in Malang’s Kayutangan CBD is r=0.76 (Figure 7). The data distribution in RAs differs slightly. In Bandung’s RA, the data distribution was r=0.73 (Figure 8), while in Malang’s RA, the data distribution was r=0.58 (Figure 9). This shows that connectivity in Malang’s RA was lower compared to the lines spread in the space syntax calculation from the results of the DepthMap analysis. It can also be concluded that Malang’s RA has lower density points than Bandung’s RA.
Green Open Space (GOS) Patterns of the Central Business Districts (CBDs) and Residential Areas (RAs) of Both Colonial Cities (CCs)
Next, the GOS patterns of Malang’s and Bandung’s CBDs and RAs were analysed using NDVI. The NDVI is a widely used method to assess the presence and density of green spaces in urban environments. By calculating the difference between the visible and near-infrared light reflected by vegetation, NDVI helps determine the extent and health of GOSs in urban areas. This approach is beneficial for evaluating how much greenery is available in highly developed regions, like the CBDs and RAs of the CCs. The classifications used in the NDVI analysis were as follows:
Table 3. The NDVI classifications
| Classification
|
NDVI Range
|
| Water |
-0.28 – 0.015 |
| Built-Up |
0.015-0.14 |
| Barren Land |
0.14-0.18 |
| Shrub and Grassland |
0.18-0.27 |
| Sparse Vegetation |
0.27-0.36 |
| Dense Vegetation |
0.36-0.74 |
Green Open Space (GOS) Patterns of the Central Business Districts (CBDs) of Both Colonial Cities (CCs)
Malang and Bandung’s CBDs have developed rapidly. Bandung’s CBD is part of the CC and is in a historical area, Braga Street, while Malang’s is in the Kayutangan area. Development in that area increases yearly, so various developments continue to be carried out, which affects the GOSs in CBDs. According to Atchison, Hendrigan, et al. (2024), CBDs usually have less shade from existing trees, poor maintenance of GOSs, and poor facilities in GOS. This also occurs in Bandung’s and Malang’s CBDs. The increasingly rapid development in CBDs impacts changes in urban design during the colonial era.
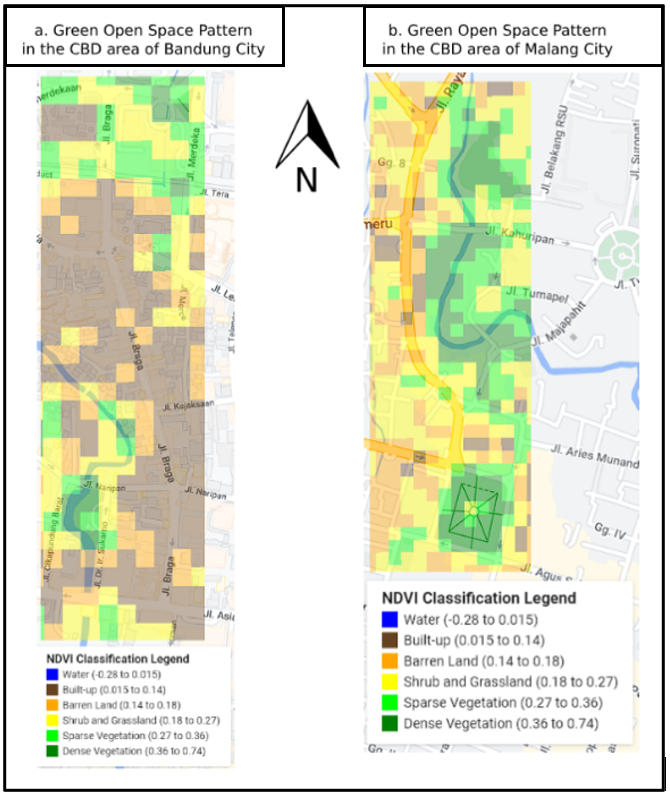
The GOS patterns of Bandung’s and Malang’s CBDs were analysed. Figure 10 shows the NDVI results of Bandung's and Malang’s CBDs. These results visually represent the distribution of GOSs within the urban landscape, highlighting areas where vegetation is more abundant and regions where it is sparse or lacking. Based on the results of the NDVI analysis, Bandung’s CBD is dominated by brown, indicating that it is more dominated by built-up areas. This differs significantly from Malang’s CBD, which is dominated by green and yellow, indicating dense vegetation, sparse vegetation, and shrub and grassland.
Green Open Space (GOS) Patterns of the Residential Areas (RAs) of Both Colonial Cities (CCs)
Malang’s and Bandung’s RAs continue to undergo development, leading to significant changes in their GOS patterns. Preserving these green spaces in RAs is essential due to their substantial impact on environmental quality. One critical ecological benefit of GOSs is their cooling effect, which helps regulate urban temperatures (Jaganmohan, Knapp, et al., 2016). This is essential in densely populated cities, where green spaces contribute to a healthier and more liveable environment.

In addition to environmental benefits, GOSs also positively influence the property values of nearby residential properties. The closer a home is to a green space, the higher its value tends to be. Conversely, homes far from green spaces generally have lower value (Wu, Wang, et al., 2015). This highlights the dual importance of maintaining GOSs for enhancing environmental conditions and preserving and increasing the economic value of residential properties. Figure 11 shows the GOS patterns of Bandung and Malang’s RAs. Both GOS patterns were equal and similar, with yellow and green evenly distributed, indicating that both RAs still have many GOSs with shrub and grassland, sparse vegetation, and dense vegetation.
Green Open Space (GOS) Pattern Analysis
The NDVI divided the results into six classifications: water, built-up, barren land, shrub and grassland, sparse vegetation, and dense vegetation. Table 3 shows detailed information about the NDVI of Malang’s and Bandung’s CBDs and RAs. Malang’s CBD has better GOS distribution than Bandung’s. The maximum NDVI of Malang’s CBD is 0.257, and the average is 0.257. The maximum NDVI of Bandung’s CBD is 0.43, and the average is only 0.18.
Meanwhile, the NDVI of Malang’s and Bandung’s RAs were similar. The maximum vegetation was also almost identical; 0.614 in Bandung and 0.618 in Malang, indicating both RAs had dense vegetation. However, according to the average GOS distribution, Malang’s RA has a slightly higher average (0.257) than Bandung’s (0.235) (Table 4).
Table 4. The GOS pattern distributions of the CBDs and RAs of the two CCs
| Location
|
Average
|
Min.
|
Max.
|
| CBD in Bandung’s CC (Braga Street) |
0.181 |
0.037 |
0.439 |
| CBD in Malang’s CC (Kayutangan Street) |
0.257 |
0.077 |
0.562 |
| RA in Bandung’s CC |
0.235 |
0.038 |
0.614 |
| RA in Malang’s CC |
0.257 |
0.059 |
0.618 |
Correlation between Connectivity and Normalised Difference Vegetation Index (NDVI)
Lastly, the correlation between connectivity and NDVI in the land use of both Bandung and Malang’s CCs was analysed. Figure 12 and Figure 13 provide an overlay of the connectivity and NDVI of Bandung and Malang’s RAs and CBDs.
Figure 14 and Figure 15 depict the distribution of the correlation between connectivity and NDVI.


The results indicate that connectivity values in residential areas tend to be lower compared to the CBDs, with a diverse range of vegetation index values. It indicates that the relatively low connectivity in residential areas corresponds to a sufficiently high vegetation index (Figure 14). In contrast, Figure 15 shows that as connectivity increases in the CBDs area, it is predominantly associated with lower vegetation values. It suggests that the CBDs prioritizes physical development for urban growth over providing green open spaces. Therefore, it can be concluded that residential areas still regard green open spaces as an essential indicator of livability that should be maintained. It strengthens previous research, which explains that the formation of city centers works through the spatial configuration of street networks, where spatial syntax methods can describe spatial properties and help define the spatial features of various histories and cultures (Tutuko, Bonifacius, et al., 2022).
Findings on the development pattern of GOS in urban areas, especially those analyzed through connectivity and NDVI, show that the distribution of GOS not only affects environmental quality but also has implications for the sustainability of urban ecosystems. Good connectivity allows green spaces to become an integral part of the city network, supporting ecological in the cities, while high NDVI values reflect the presence of dense vegetation. However, urban development that often ignores the strategic distribution of GOS can cause fragmentation of green spaces and reduce ecological effectiveness. Therefore, an analysis that integrates connectivity with NDVI becomes crucial in urban planning to ensure ecological sustainability that not only functions at the local level but also supports broader spatial relationships in the context of modern urbanization.
Conclusion
There are similarities in the magnitude of connectivity and NDVI of both CCs. As a manifestation of a sustainable city, the results of connectivity analysis using DepthMap show that connectivity plays an essential role in seeing areas where activities are concentrated in a city area, such as RAs and CBDs. The study’s results explain the calculations of raster images on digital maps and Google Earth Engine into calculations that are easy to understand when tracing connectivity and NDVI in two areas in the CCs of Malang and Bandung. The spatial syntax analysis of a city depends on the spatial character of the topology of the urban environment. The NDVI analysis depends on an area’s green distribution contained in data processing from Google Earth Engine. Residential areas (RAs) are areas that have low connectivity and high NDVI. Central business districts (CBDs) are zones with high connectivity and low NDVI. Both aspects are indicated by building density and diverse land use. The correlation between area type and GOS pattern is a primary requirement for sustainable cities. Interventions in road connectivity and green vegetation density impact socio-economic life in urban areas, especially in cities with historical value, such as Malang and Bandung.
Research on the calculation of GOS patterns in Dutch CCs, such as Malang and Bandung, reveals the importance of connectivity analysis and the NDVI in managing GOSs in CBDs and RAs. Green open spaces (GOS) serve crucial roles in maintaining ecological balance, reducing the impact of urbanisation and preserving a city's historical heritage. By understanding the distribution and correlation of green spaces through this approach, urban spatial planning can be more effective in creating a sustainable environment, supporting ecological functions, and improving the quality of life of people in CCs with rich cultural value.
This study’s limitation is that it only examined RAs and limited CBDs. Several other zones, such as educational and industrial areas, have not been conducted. Thus, this study can be expanded by evaluating other areas that contribute to city development. This study is expected to help city planners and policymakers maintain city sustainability.
Author Contributions
Conceptualization, P.T.; methodology, P.T., and N.A.; software, P.T. N.A. and A.G.S.; investigation, A.S. and N.A.; resources, P.T. and A.G.S.; data curation, P.T., A.G.S., A.S., and N.A.; writing—original draft preparation, P.T. and N.A.; writing—review and editing, P.T. and N.A.; supervision, P.T. All authors have read and agreed to the published version of the manuscript.
Ethics Declaration
There are no conflicts of interest regarding the publication of this paper.
Acknowledgments
We acknowledge the contribution of The Ministry of Education and Culture- Research and Technology, the Republic of Indonesia, for funding this study and providing the opportunity to conduct research. We want to thank members of the Laboratory of Urban and Human Settlements - Department of Architecture, Faculty of Engineering, University of Merdeka Malang, and individuals who assisted with the Housing and Human Settlement project, specifically by providing supporting data.
Funding Statement
This research was funded by the Ministry of Education and Culture-Research and Technology, Republic of Indonesia(No. 109/E5/PG.02.00.PL/2024).
References
- Agrawal , S. K. (2010). "Design Review in A Post-Colonial City: The Delhi Urban Art Commission". Cities, 27(5), 397–404. doi: https://doi.org/10.1016/j.cities.2010.01.004.
- Aini, N. and Shen, Z. (2019). "The Effect of Tree Planting within Roadside Green Space on Dispersion of CO 2 from Transportation". International Review for Spatial Planning and Sustainable Development, 7(4), 97–112. doi: https://doi.org/https://doi.org/10.14246/irspsd.7.4_97.
- Aini, N. and Shen, Z. (2020a). "Design of Trees Planting Pattern: Impacting on The Road-Air Quality for Pedestrian Emitted from Transportation". International Journal of Sustainable Society.
- Aini, N. and Shen, Z. (2020b). "How the Position of Trees Planting Can Improve the Near-Road Air Quality Exposed to CO<SUB align="right">2 Emission from Transportation". International Journal of Sustainable Society, 12(4), 291. doi: https://doi.org/10.1504/ijssoc.2020.112446.
- Aini, N., Shen, Z., et al. (2023). "Evaluation of the Shape of Tree Crowns to Protect Air Quality on the Roadside from the CO2 Dispersion Produced by Transportation". International Review for Spatial Planning and Sustainable Development, 11(2), 26–41. doi: https://doi.org/10.14246/irspsd.11.2_26.
- Ameen , R. F. M., Mourshed, M., et al. (2015). "A Critical Review of Environmental Assessment Tools for Sustainable Urban Design". Environmental Impact Assessment Review, 55, 110–125. doi: https://doi.org/10.1016/J.EIAR.2015.07.006.
- Atchison, J., Hendrigan, C., et al. (2024). "Widely Valued but Differently Experienced; Understanding Relationships with Greenspace in the CBD". Landscape and Urban Planning, 252(April). doi: https://doi.org/10.1016/j.landurbplan.2024.105175.
- Bahadur . (2018). "NDVI, NDBI & NDWI Calculation Using Landsat 7,8". Retrieved from https://www.linkedin.com/ on September 2018, 8.
- Batty, M. (2004). A New Theoryof Space Syntax (75; 03/04). CASA, Working Paper Series.
- Benedict , M. A. and McMahon , E. T. (2002). "Green Infrastructure: Smart Conservation for the 21st Century". Renewable Resources Journal, Autumn 2002, 12–17.
- Bogaers, E. (1983). Ir. Thomas Karsten en de Stedebouw in Nederlands-Indië 1915-1940. Universiteit van Amsterdam.
- Bonifacius, N., Tutuko, P., et al. (2021). "Study on the Deviation and Ratio of Spatial Arrangement Patterns in Housing and City Development to Achieve Sustainable Urban form in Indonesia: Introduction of Observations and Calculations by Space Syntax". IOP Conference Series: Earth and Environmental Science, 780(1), 12049. doi: https://doi.org/10.1088/1755-1315/780/1/012049.
- Christensen, J. (2013). "On Compact Cities". Lincoln Planning Review, 5, 37–42.
- Cooper, R., Evans, G., et al. (2009). Designing Sustainable Cities. Wiley-Blackwell.
- Craun, Z. (2012). "Refurbishment as a Sustainable Urban-Design Strategy". Journal of International Affairs, 65(2), 157.
- Daunt , A. B. P., Inostroza, L., et al. (2021). "The Role of Spatial Planning in Land Change: An Assessment of Urban Planning and Nature Conservation Efficiency at the Southeastern Coast of Brazil". Land Use Policy, 111, 105771. doi: https://doi.org/10.1016/j.landusepol.2021.105771.
- Dawson , P. C. (2002). "Space Syntax Analysis of Central Inuit Snow Houses". Journal of Anthropological Archaeology, 21(4), 464–480. doi: https://doi.org/10.1016/S0278-4165(02)00009-0.
- Eldiasty, A., Sabry Hegazi, Y., et al. (2021). "Using Space Syntax and TOPSIS to Evaluate the Conservation of Urban Heritage Sites for Possible UNESCO Listing the Case Study of the Historic Centre of Rosetta, Egypt". Ain Shams Engineering Journal, 12(4), 4233–4245. doi: https://doi.org/https://doi.org/10.1016/j.asej.2021.04.017.
- Faehnle, M. (2014). Collaborative Planning of Urban Green Infrastructure : Need, Quality, Evaluation, and Design. Unigrafia.
- Falah, M. (2019). "Keletakan Ruang Terbuka Hijau Dalam Tata Ruang Kota Bandung Akhir Abad XIX Hingga Pertengahan Abad XX". Sosiohumaniora, 21(2), 130–139. doi: https://doi.org/10.24198/sosiohumaniora.v21i2.21020.
- Ferretti, V., Bottero, M., et al. (2014). "Decision Making and Cultural Heritage: An Application of the Multi-Attribute Value Theory for The Reuse of Historical Buildings". Journal of Cultural Heritage, 15(6), 644–655. doi: https://doi.org/10.1016/j.culher.2013.12.007.
- Firman, T. (2002). "Urban Development in Indonesia, 1990-2001: From the Boom to the Early Reform Era Through the Crisis". Habitat International, 26(2), 229–249. doi: https://doi.org/10.1016/S0197-3975(01)00045-5.
- Firman, T. (2009). "The Continuity and Change in Mega-Urbanization in Indonesia: A Survey of Jakarta–Bandung Region (JBR) Development". Habitat International, 33(4), 327–339. doi: https://doi.org/10.1016/j.habitatint.2008.08.005.
- Gibbins, C. (2001). "Book review: Saving a Place: Endangered Species in the 21st Century". Land Use Policy, 18, 201–202.
- He, Z., Ling, Y., et al. (2022). "Does Zoning Contain Built-Up Land Expansion? Causal Evidence from Zhangzhou City, China". Landscape and Urban Planning, 220, 104339. doi: https://doi.org/10.1016/j.landurbplan.2021.104339.
- Hillier, B. (2007). "Space is the machine: A Configurational Theory of Architecture". Press Syndicate of the University of Cambridge. doi: https://doi.org/10.1016/S0142-694X(97)89854-7.
- Hillier, B. and Hanson, J. (1984). The Social Logic of Space. Cambridge University Press. doi: https://doi.org/10.1017/CBO9780511597237.
- Hölscher, C., Dalton , R. C., et al. (2007). "Space Syntax and Spatial Cognition". Proceedings of Spatial Cognition, (September).
- Jaganmohan, M., Knapp, S., et al. (2016). "The Bigger, The Better? The Influence of Urban Green Space Design on Cooling Effects for Residential Areas". Journal of Environmental Qualityfile:///H:/02 PENELITIAN/2024/Referensi Kota Kolonial/Widely Valued but Differently Experienced; Understanding Relationships with Greenspace in the CBD.Pdf, 45(1), 134–145.
- Law, S., Chiaradia, A., et al. (2012). "Towards A Multi-Modal Space Syntax Analysis: A Case Study of the London Street and Underground Network". Eighth International Space Syntax Symposium, 1–20.
- Leghrib, F. and Laroui, A. (2024). "Assessing Urban Green Space Accessibility for Sustainable Development in Mostaganem , Algeria : A Space Syntax Approach". Journal of Contemporary Urban Affairs, 8(1), 197–211.
- Lüttge, U. and Buckeridge, M. (2023). "Trees: Structure and Function and the Challenges of Urbanization". Trees - Structure and Function, 37(1), 9–16. doi: https://doi.org/10.1007/s00468-020-01964-1.
- Makkelo , I. D. (2018). "Sejarah Perkotaan: Sebuah Tinjauan Historiografis Dan Tematis". Lensa Budaya: Jurnal Ilmiah Ilmu-Ilmu Budaya, 12(2), 83–101. doi: https://doi.org/10.34050/JLB.V12I2.3052.
- Nes, A. van and Yamu, C. (2018). "Space Syntax". The Virtual and the Real in Planning and Urban Design, December, 136–150. doi: https://doi.org/10.4324/9781315270241-10.
- Önder , D. E. and Gigi, Y. (2010). "Reading Urban Spaces by the Space-Syntax Method: A Proposal for the South Haliç Region". Cities, 27(4), 260–271. doi: https://doi.org/10.1016/j.cities.2009.12.006.
- Pitman , S. D., Daniels , C. B., et al. (2015). "Green Infrastructure as Life Support: Urban Nature and Climate Change". Transactions of The Royal Society of South Australia, 139(1), 97–112. doi: https://doi.org/10.1080/03721426.2015.1035219.
- Renne , J. L. and Listokin, D. (2021). "Transit-Oriented Development and Historic Preservation Across the United States: A Geospatial Analysis". Transportation Research Interdisciplinary Perspectives, 10, 100373. doi: https://doi.org/10.1016/j.trip.2021.100373.
- Ribera, F., Nesticò, A., et al. (2020). "A Multicriteria Approach to Identify the Highest and Best Use for Historical Buildings". Journal of Cultural Heritage, 41, 166–177. doi: https://doi.org/10.1016/j.culher.2019.06.004.
- Rodríguez-Alegría, E., Millhauser , J. K., et al. (2013). "Trade, Tribute, and Neutron Activation: The Colonial Political Economy of Xaltocan, Mexico". Journal of Anthropological Archaeology, 32(4), 397–414. doi: https://doi.org/10.1016/j.jaa.2013.07.001.
- Salama, A. M. (2000). Cultural Sustainability of Historic Cities : notes on conservation projects in Old Cairo. Strathprints.
- Sruthi, S. and Aslam , M. A. M. (2015). "Agricultural Drought Analysis Using the NDVI and Land Surface Temperature Data; A Case Study of Raichur District". Aquatic Procedia, 4(Icwrcoe), 1258–1264. doi: https://doi.org/10.1016/j.aqpro.2015.02.164.
- Szromek , A. R., Kruczek, Z., et al. (2023). "Stakeholders’ Attitudes Towards Tools for Sustainable Tourism in Historical Cities". Tourism Recreation Research, 48(3), 419–431. doi: https://doi.org/10.1080/02508281.2021.1931774.
- Tannous , H. O., Major , M. D., et al. (2021). "Accessibility of Green Spaces in a Metropolitan Network Using Space Syntax to Objectively Evaluate the Spatial Locations of Parks and Promenades in Doha, State of Qatar". In Urban Forestry & Urban Greening, Vol. 58, 126892. Elsevier BV. doi: https://doi.org/10.1016/j.ufug.2020.126892.
- Tutuko, P., Bonifacius, N., et al. (2022). "The Pattern of Land Use Integration in Historic Areas in the CBD Zone". International Review for Spatial Planning and Sustainable Development, 10(3), 148–169. doi: https://doi.org/10.14246/irspsd.10.3_148.
- Tutuko, P., Bonifacius, N., et al. (2021). "Measuring Spatial Arrangement of Indonesian Colonial Cities using Depth and Connectivity Calculations: Ratio study on master plans using Space Syntax". International Review for Spatial Planning and Sustainable Development, 9(4), 67–81. doi: https://doi.org/https://doi.org/10.14246/irspsd.9.4_67.
- Tutuko, P., Bonifacius, N., et al. (2019). "Tracing the City Pattern of Netherlands and Indonesia using Depth Calculation and Connectivity". Journal of Physics: Conference Series, 1167, 12012. doi: https://doi.org/10.1088/1742-6596/1167/1/012012.
- Tutuko, P. and Shen, Z. (2014). "Vernacular Pattern of House Development for Home based Enterprises in Malang, Indonesia". International Review for Spatial Planning and Sustainable Development, 2(3), 63–77. doi: https://doi.org/https://doi.org/10.14246/irspsd.2.3_63.
- Wikantiyoso, R., Tutuko, P., et al. (2020). "Green city MIS as a Sustainable Urban GOS Provision Control Implementation Model: Case Study: The GOS Provision in the Brantas Riverbanks Revitalization, Malang City, Indonesia". International Review for Spatial Planning and Sustainable Development, 8(1), 160–172. https://doi.org/10.14246/irspsda.8.1_160.
- Wu, J., Wang, M., et al. (2015). "Impact of Urban Green Space on Residential Housing Prices: Case study in Shenzhen". Journal of Urban Planning and Development, 141(4), 5014023.
- Yi, C. and Ryu, J. (2015). "Growth, Decline and the Challenges Facing a Policy-Dependent and Former-Colonial City: Gunsan, Korea". Cities, 43, 37–47. doi: https://doi.org/https://doi.org/10.1016/j.cities.2014.11.007.


